
Auto-Enrollment’s Long-Term Effect On Retirement Saving
Defaults Matter: Do Auto-Features in 401(k) Plans Lead to Better Financial Outcomes?
Key Insights
- 401(k) savings plans are increasingly offering auto-enrollment coupled with higher employee default deferral rates.
- Auto-enrollment almost doubles plan participation and successfully gets participants who might not have otherwise saved saving. However, it can also result in participants saving less than those who voluntarily opt in and set their own deferral rate.
- Auto-enrollment combined with auto-escalation creates better participation and savings outcomes.
Automatic enrollment in employer-sponsored 401(k) savings plans has transformed the way that millions of Americans save for retirement.
Contrary to common perception, automatic enrollment did not start with the passage of the Pension Protection Act (PPA) in 2006. Rather, it was made possible by Internal Revenue Service Revenue Ruling 98-30 in 1998. This ruling gave employers the ability to automatically enroll employees through a concept called “negative consent,” where, absent objection, employees were automatically enrolled in their company’s 401(k) plan and needed to voluntarily opt out of participating.
PPA as a Catalyst
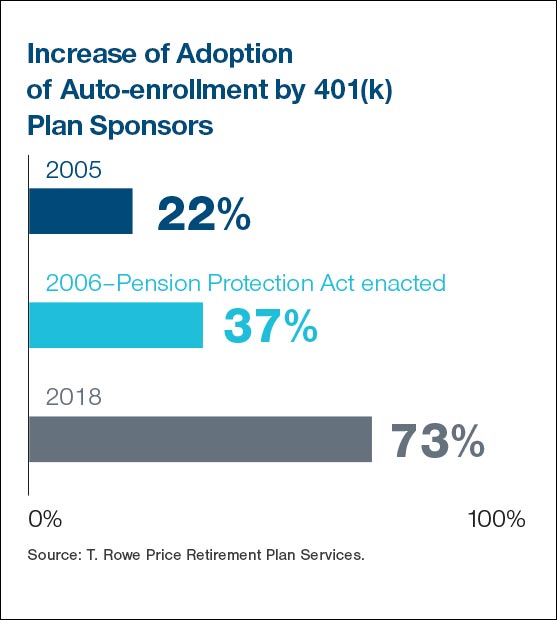
Still, the true catalyst for adoption of automatic enrollment was the protections and opportunities provided in the PPA. Specifically, federal preemption over state laws that may have prohibited auto enrollment (because of broader prohibitions on wage withholding without affirmative consent), fiduciary protection for Qualified Default Investment Alternatives (QDIAs), and a new safe harbor for Qualified Automatic Contribution Arrangements (QACAs). The latter provided relief from contribution restrictions on “highly compensated employees” for plan sponsors who automatically enroll their eligible employees at a minimum of 3% of compensation and achieve a target of 6% within four years; but no greater than 10%. In the 10 years following the PPA, the number of T. Rowe Price clients who implemented auto-enrollment almost doubled from 37% to 73%.
Setting a Default Contribution Rate
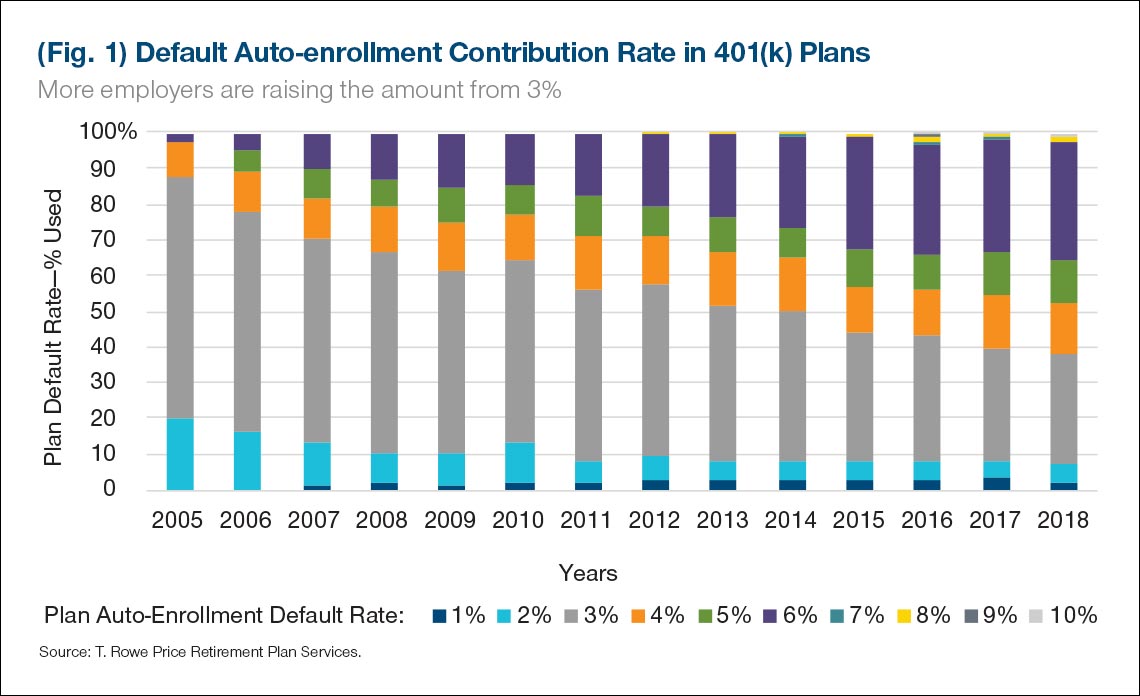
When the PPA was enacted, the most common default rate was 3% and 61% of T. Rowe Price’s clients who implemented auto-enrollment chose that as their default; likely influenced by Internal Revenue Service rulings approving of automatic enrollment arrangements, using a 3% default as an example. Figure 1 shows that number had fallen to 31% by 2018. Moreover, the percentage of clients who are setting their default deferral policy rate at 6% has grown from 4% to 33%—a likely result of some plan sponsors availing themselves to the QACA safe harbor and others simply adopting the model example set forth in the QACA as a best practice.
Defaults play a large role in helping employees achieve financial security in retirement, but are they enough? T. Rowe Price has long professed that the key to achieving financial security in retirement is to save at least 15% of one’s gross income or salary annually, inclusive of both employee and employer contributions.
So where do savers stand? In 2018, T. Rowe Price surveyed 1,000 participants it recordkeeps and asked them: How much should you be saving, and how much are you saving? Positively, 62% said they needed to save at least 15% of their income. However, on average, they are only saving 11% (including employee and employer contributions), which is below the target amount.
So, what can an employer do to help employees save more?
Employers are increasingly being asked to, and as a result, are proactively stepping forward to encourage employees to adopt healthy financial behaviors. However, success isn’t a function of luck. There needs to be intentionality and purpose to achieve a desired outcome. That said, not every employer’s desired outcome is the same. Let’s face it: Employers offer retirement plans for a variety of reasons. Some view it as a means of attracting and retaining talent.
Others may view it as a means of creating a more engaged workforce. Or it may be a lever to drive greater corporate profitability. Whatever the combination of factors, there is an implicit acknowledgment that for 401(k) plans to be as effective as possible, the design needs to be reflective of a benefit vision or philosophy. After all, form follows function, or, put another way, the 401(k) plan design is a means to an end.
The good comes with an unintended consequence to savings rates.
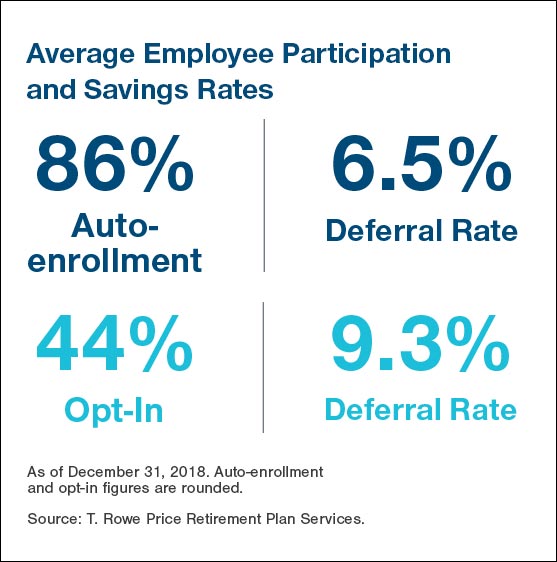
There is little doubt that plan sponsors have embraced the use of auto-enrollment as a means of creating employee engagement with retirement savings and promoting a healthy financial behavior—saving for retirement. Further, auto-enrollment is clearly an effective means of increasing plan participation. In fact, plan participation for T. Rowe Price-recordkept plans that have adopted auto-enrollment is 86% compared with just 44% for those who had not implemented it.
However, with the good comes an unintended consequence of lower savings rates. Those who were not auto-enrolled deferred almost 3% more of their salary on average (9.3%) compared with those who were auto-enrolled (6.5%). This discrepancy suggests that deferral rates set by the employer could result in an endorsement effect. The employee might infer that the default rate is “safe” and may not think of contributing more.
So, how can plan sponsors optimize both participation and savings? And what are the effects of auto-enrollment over a working lifetime? Download the full article to continue reading.
Important Information
This material is provided for general and educational purposes only and is not intended to provide legal, tax, or investment advice. This material does not provide fiduciary recommendations concerning investments; it is not individualized to the needs of any specific benefit plan or retirement investor, nor is it intended to serve as the primary basis for investment decision-making.
Information and opinions presented have been obtained or derived from sources believed to be reliable and current; however, we cannot guarantee the sources’ accuracy or completeness. The views contained herein are those of the authors and are subject to change without notice; these views may differ from those of other T. Rowe Price associates.
All investments involve risk, including possible loss of principal. All charts and tables are shown for illustrative purposes only.
Contact your T. Rowe Price representative to find out how we can take your plan to the next level.