- On Exchange-Traded Funds
- Know What You Own: Investors Have More Options Than Ever in Active ETFs
- T. Rowe Price Blue Chip Growth ETF (TCHP*) has outperformed benchmark growth indices so far in 2023.
- 2023-09-20 16:39
- Key Insights
-
- As a result of the market extremes in 2022, some key U.S. growth indices don’t currently reflect the traditional characteristics of growth stocks.
- Actively managed ETFs have the flexibility to adapt to changing market conditions while remaining true to style and portfolio objectives.
- Over the past three years, active ETFs have quickly become the fastest-growing category in the ETF space.
Last year’s harsh economic environment and pivot into a higher rates greatly impacted growth stocks. The result has been major shifts in weightings across growth indices. In some key respects, these indices may no longer reflect the traditional characteristics of growth stocks, which could present a challenge for passive investors.
Active investing strategies have played a key role as part of investors’ playbooks, and recent market changes demonstrate the important role active management can play in helping funds stay true to their investment style. Though exchange-traded funds (ETFs) have long been synonymous with passive funds, the active ETF marketplace is growing rapidly.
Is Your “Growth” Truly Growth?
Extreme shifts in growth leadership, valuations, and the risk-free rate1 can have consequences—especially for indices that track these markets.
The recent performance of major U.S. large-cap growth indices paints a clear picture of the impact these tectonic shifts have had on growth stocks.
The S&P 500 Growth and Value Indices went through their annual reconstitution in December 2022. According to S&P Dow Jones Indices, this most recent reconstitution included the highest turnover on record, with the Growth Index experiencing 32% total turnover.
Taking a closer look at the S&P 500 Growth and Value Indices (Fig. 1), we can see that they also experienced dramatic shifts across sectors. Notably, the energy, consumer staples, and materials sectors now account for 18% of the total S&P 500 Growth Index.
"Following a passive investment strategy means investors are indentured to the methodology and rules of an index and lack the discretion to adjust."
For passive investors, these shifts could be problematic. Following a passive investment strategy means investors are indentured to the methodology and rules of an index and lack the discretion to adjust. In this scenario, they’re invested in the S&P 500 Growth Index, which has taken on some distinctly non‑growth attributes since December 2022.
As Market Volatility Persists, Active ETFs Rise in Popularity
Exchange-traded funds, in many investors’ minds, are passive funds. According to Morningstar, 94% of ETF assets are passive strategies, it’s easy to understand why. However, the USD 7 trillion ETF market is changing, and actively managed ETFs are quickly becoming the fastest‑growing category.
Both Indices Experienced Significant Shifts in Value Weight Across Sectors
(Fig. 1) Shifts in value weight of S&P 500 Growth and Value Indices
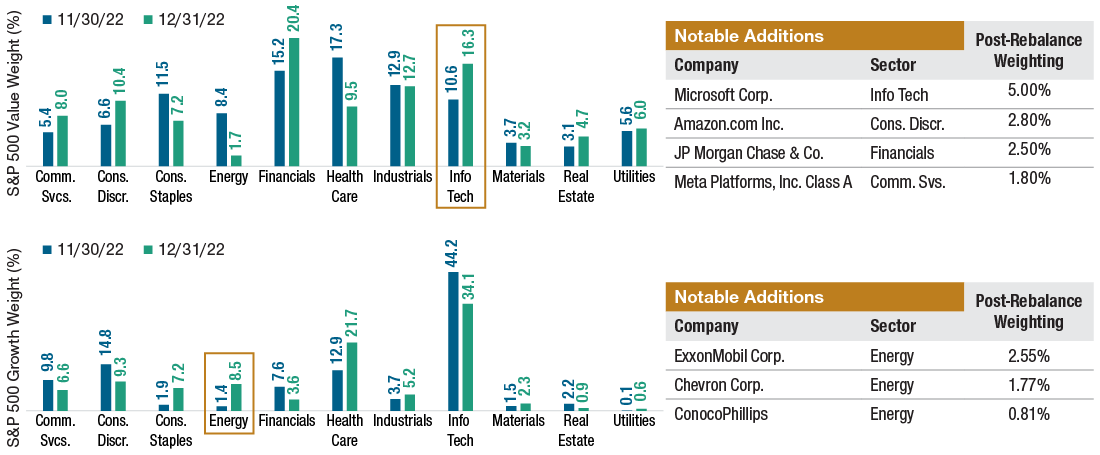
Source: Spyderweb.
The specific securities identified and described are shown for illustrative purposes only and do not necessarily represent securities purchased or sold by T. Rowe Price. This information is not intended to be a recommendation to take any particular investment action and is subject to change. No assumptions should be made that the securities identified and discussed were or will be profitable.
Through the first half of 2023, active ETFs have taken in USD 48.7 billion, which represents about 25% of the total ETF industry cash flow.2 This is impressive, given that they only account for 6% of the overall ETF market. In addition to flows, we’ve seen a tremendous number of active ETFs hitting the market. In 2021 and 2022 alone, actively managed ETFs accounted for 60% of new ETF launches.
"...active ETFs have taken in USD 48.7 billion, which represents about 25% of the total ETF industry cash flow."
We believe a critical juncture has been reached between supply and demand for actively managed ETFs, and these offerings are only just beginning their journey.
TCHP Outperformed in the First Half of 2023
As a result of 2023 performance thus far, growth has reasserted leadership in the marketplace. An active manager like T. Rowe Price, who has stayed true to the style of pure growth, has shown better results than passive alternatives like S&P 500 Growth and Russell 1000 Growth Indices.
With headline names such as Meta, Microsoft, and Amazon leaving growth for value in key indices, we have seen a notable difference in the year‑to‑date performance of S&P 500 Growth ETFs versus other growth benchmarks. The Russell 1000 Growth Index outperformed the S&P 500 Growth Index by around 632 basis points in the first half of 2023. Both were outperformed by the actively managed T. Rowe Price Blue Chip Growth ETF.*
The Blue Chip Growth ETF* stayed true to its growth mandate as compared with the nontraditional characteristics currently portrayed in both growth indices.
We believe this is an excellent example of why it may be a better option for investors, especially during periods of market volatility, to use an active manager who stays true to the fund style objectives. T. Rowe Price Active ETFs seek to outperform benchmark indices through the added value of our investment management expertise and global research capabilities.
For years, investors interested in active ETF strategies lacked options, especially within the U.S. large‑cap growth category. Before June 2020, there was only one active large-cap growth ETF industry‑wide. Investors now have several active U.S. large-cap growth ETFs from T. Rowe Price to choose from: Growth ETF (TGRT), Growth Stock ETF (TGRW),* and Blue Chip Growth ETF (TCHP).*
We have long believed that we could deliver the benefits of our core investment approach in the form of an ETF. Managed through rigorous fundamental research and a forward-looking strategic perspective, T. Rowe Price Active ETFs enable us to package this expertise for clients who may prefer the ETF structure.
The Russell 1000 Growth Index Outperformed the S&P 500 Growth Index by Around 632 bps in the First Half of 2023, Though Both Were Outperformed by the Actively Managed Blue Chip Growth ETF*
(Fig. 2) 1H 2023 performance of growth indices
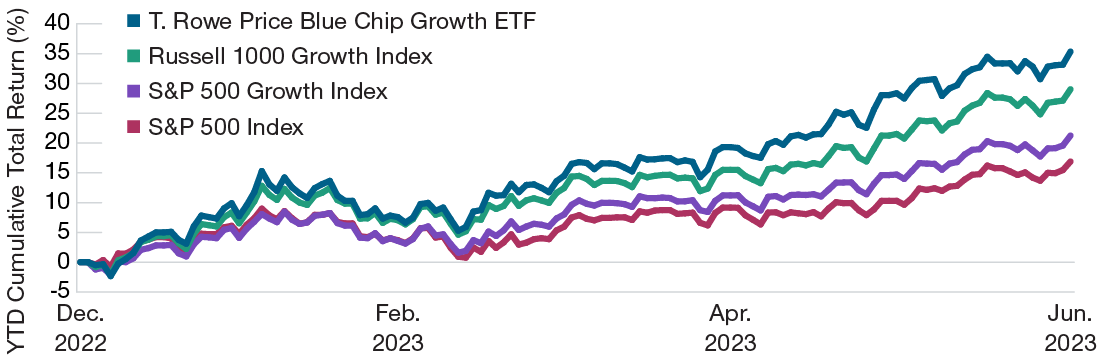
As of June 30, 2023.
Past performance cannot guarantee future results. Index performance is for illustrative purposes only and is not indicative of any specific investment. Investors cannot invest directly in an index.
Source: FactSet.
Blue Chip Growth ETF (TCHP)
TOP 10 HOLDINGS
| Industry | % of Fund | |
|---|---|---|
| Microsoft | Software | 14.1% |
| Apple | Technology Hardware, Storage & Peripherals | 11.4% |
| Amazon.com | Broadline Retail | 7.8% |
| Alphabet | Interactive Media & Services | 7.6% |
| NVIDIA | Semiconductors & Semiconductor Equipment | 6.0% |
| Meta Platforms | Interactive Media & Services | 5.0% |
| UnitedHealth Group | Health Care Providers & Services | 3.3% |
| Visa | Financial Services | 3.3% |
| Tesla | Automobiles | 2.9% |
| MasterCard | Financial Services | 2.7% |
As of June 30, 2023.
Holdings are shown at the issuer/company level as of the date indicated and are subject to change.
PERFORMANCE
| One Month | Three Months | One Year | Annualized Since Inception* | |
| NAV | 6.17% | 16.17% | 26.78% | 3.83% |
| Market Price | 6.09 | 16.26 | 26.90 | 3.83 |
| S&P 500 Growth Index | 6.38 | 10.59 | 18.25 | 9.16 |
| Russell 1000 Growth Index | 6.84 | 12.81 | 27.11 | 10.76 |
As of June 30, 2023.
*Inception Date = 8/4/2020.
The fund’s expense ratio as of the most recent prospectus was 0.57%.
Performance data quoted represents past performance and does not guarantee future results; current performance may be higher or lower than performance quoted. Investment returns and principal value will fluctuate and shares, when sold, may be worth more or less than their original cost. To obtain the most recent month-end performance, visit troweprice.com. Market returns are based on the midpoint of the bid/ask spread at market close (typically, 4 p.m. ET) and do not represent returns an investor would receive if shares were traded at other times.
For Sourcing Information, please see Additional Disclosures.
-
*This ETF is different from traditional ETFs. Traditional ETFs tell the public what assets they hold each day. This ETF will not. This may create additional risks for your investment. For example:
- You may have to pay more money to trade the ETF’s shares. This ETF will provide less information to traders, who tend to charge more for trades when they have less information.
- The price you pay to buy ETF shares on an exchange may not match the value of the ETF’s portfolio. The same is true when you sell shares. These price differences may be greater for this ETF compared to other ETFs because it provides less information to traders.
- These additional risks may be even greater in bad or uncertain market conditions.
- The ETF will publish on its website each day a “Proxy Portfolio” designed to help trading in shares of the ETF. While the Proxy Portfolio includes some of the ETF’s holdings, it is not the ETF’s actual portfolio.
The differences between this ETF and other ETFs may also have advantages. By keeping certain information about the ETF secret, this ETF may face less risk that other traders can predict or copy its investment strategy. This may improve the ETF’s performance. If other traders are able to copy or predict the ETF’s investment strategy, however, this may hurt the ETF’s performance.
For additional information regarding the unique attributes and risks of the ETF, please see the Important Information as well as the fund’s prospectus.
1 Risk-free rate: The risk-free rate of return refers to the theoretical rate of return of an investment with zero risk.
2 Source: FactSet.
Additional Disclosures
Copyright © 2023, S&P Global Market Intelligence (and its affiliates, as applicable). Reproduction of any information, data or material, including ratings (“Content”) in any form is prohibited except with the prior written permission of the relevant party. Such party, its affiliates and suppliers (“Content Providers”) do not guarantee the accuracy, adequacy, completeness, timeliness or availability of any Content and are not responsible for any errors or omissions (negligent or otherwise), regardless of the cause, or for the results obtained from the use of such Content. In no event shall Content Providers be liable for any damages, costs, expenses, legal fees, or losses (including lost income or lost profit and opportunity costs) in connection with any use of the Content. A reference to a particular investment or security, a rating or any observation concerning an investment that is part of the Content is not a recommendation to buy, sell or hold such investment or security, does not address the suitability of an investment or security and should not be relied on as investment advice. Credit ratings are statements of opinions and are not statements of fact.
London Stock Exchange Group plc and its group undertakings (collectively, the “LSE Group”). © LSE Group 2023. FTSE Russell is a trading name of certain of the LSE Group companies. Russell® is a trademark of the relevant LSE Group companies and is used by any other LSE Group company under license. All rights in the FTSE Russell indexes or data vest in the relevant LSE Group company which owns the index or the data. Neither LSE Group nor its licensors accept any liability for any errors or omissions in the indexes or data and no party may rely on any indexes or data contained in this communication. No further distribution of data from the LSE Group is permitted without the relevant LSE Group company’s express written consent. The LSE Group does not promote, sponsor or endorse the content of this communication. The LSE Group is not responsible for the formatting or configuration of this material or for any inaccuracy in T. Rowe Price Associates’ presentation thereof.
© 2023 Morningstar, Inc. All rights reserved. The information contained herein: (1) is proprietary to Morningstar and/or its content providers; (2) may not be copied or distributed; and (3) is not warranted to be accurate, complete, or timely. Neither Morningstar nor its content providers are responsible for any damages or losses arising from any use of this information. Past performance is no guarantee of future results.
-
Important Information
ETFs are bought and sold at market prices, not net asset value (NAV). Investors generally incur the cost of the spread between the prices at which shares are bought and sold. Buying and selling shares may result in brokerage commissions, which will reduce returns.
*This ETF publishes a daily Proxy Portfolio, a basket of securities designed to closely track the daily performance of the actual portfolio holdings. While the Proxy Portfolio includes some of the ETF’s holdings, it is not the actual portfolio. Daily portfolio statistics will be provided as an indication of the similarities and differences between the Proxy Portfolio and the actual holdings. The Proxy Portfolio and other metrics, including Portfolio Overlap, are intended to provide investors and traders with enough information to encourage transactions that help keep the ETF’s market price close to its NAV. There is a risk that market prices will differ from the NAV. ETFs trading on the basis of a Proxy Portfolio may trade at a wider bid/ask spread than shares of ETFs that publish their portfolios on a daily basis, especially during periods of market disruption or volatility and, therefore, may cost investors more to trade. The ETF’s daily Proxy Portfolio, Portfolio Overlap, and other tracking data are available at troweprice.com.
*Although the ETF seeks to benefit from keeping its portfolio information confidential, others may attempt to use publicly available information to identify the ETF’s investment and trading strategy. If successful, these trading practices may have the potential to reduce the efficiency and performance of the ETF.
Call 1-800-225-5132 to request a prospectus or summary prospectus; each includes investment objectives, risks, fees, expenses, and other information that you should read and consider carefully before investing.
The views contained herein are those of the authors as of September 2023 and are subject to change without notice; these views may differ from those of other T. Rowe Price associates.
This material is provided for informational purposes only and is not intended to be investment advice or a recommendation to take any particular investment action.This information is not intended to reflect a current or past recommendation concerning investments, investment strategies, or account types; advice of any kind; or a solicitation of an offer to buy or sell any securities or investment services. The opinions and commentary provided do not take into account the investment objectives or financial situation of any particular investor or class of investor. Please consider your own circumstances before making an investment decision.
Information contained herein is based upon sources we consider to be reliable; we do not, however, guarantee its accuracy.
Risk Considerations: Past performance is not a reliable indicator of future performance. All investments are subject to market risk, including the possible loss of principal. Active investing may have higher costs than passive investing and may underperform the broad market or passive peers with similar objectives. Because growth stocks have higher valuations and lower dividend yields than slower-growth or cyclical companies, the fund’s share price could decline further in market downturns than non-growth-oriented funds. The fund’s growth investing style may become out of favor, which may result in periods of underperformance.
T. Rowe Price Investment Services, Inc.
© 2023 T. Rowe Price. All Rights Reserved. T. ROWE PRICE, INVEST WITH CONFIDENCE, and the Bighorn Sheep design are, collectively and/or apart, trademarks of T. Rowe Price Group, Inc.
202309-3078992