July 2026
Global Asset Allocation Viewpoints

Welcome to our latest Asset Allocation Viewpoints - your monthly source for actionable insights on portfolio positioning from our Asset Allocation Committee and Multi-Asset team.
Outlook
- Markets have continued to push higher despite geopolitical uncertainty, supported by resilient earnings and ongoing AI-driven investment, even as inflation and policy risks remain.
- The global economy continues to benefit from fiscal spending and investment in AI infrastructure, though growth is becoming more uneven across regions and the path of energy prices remains uncertain.
- The policy outlook remains uncertain as central banks balance lingering inflation pressures against concerns about moderating growth and a gradually softening labor market, leaving the path for interest rates increasingly data dependent.
- Key risks include a renewed rise in energy prices and inflation, further geopolitical escalation, continued reliance on a narrow set of market leaders, and signs of deterioration in labor markets or private market liquidity.
Themes Driving Positioning
Fed Gets Less Chatty
The arrival of a new Fed chair appears to have changed the policy backdrop, though not necessarily by putting rates on a meaningfully different near-term path. The bigger shift may be in communication: Kevin Warsh appears less inclined to guide markets toward a specific policy outcome, placing greater emphasis on incoming data and making the path of policy less predictable. This matters because inflation remains the Fed’s primary constraint. While signs of labor market softening could increase pressure to ease policy, they may no longer be enough on their own to prompt rate cuts, particularly with inflation still above target. In other words, while inflation remains above target, investors may not be able to count on the Fed to respond quickly to every bout of market or economic weakness, as policymakers place greater weight on maintaining inflation credibility. Importantly, this shift extends beyond the new chair. The latest Fed projections showed a broader committee-wide move away from cuts and toward the possibility of hikes, despite political pressure for easier policy. For investors, that points to continued rate and yield curve volatility and reinforces the case for a cautious stance on duration.
The Dot Plot Thickens1
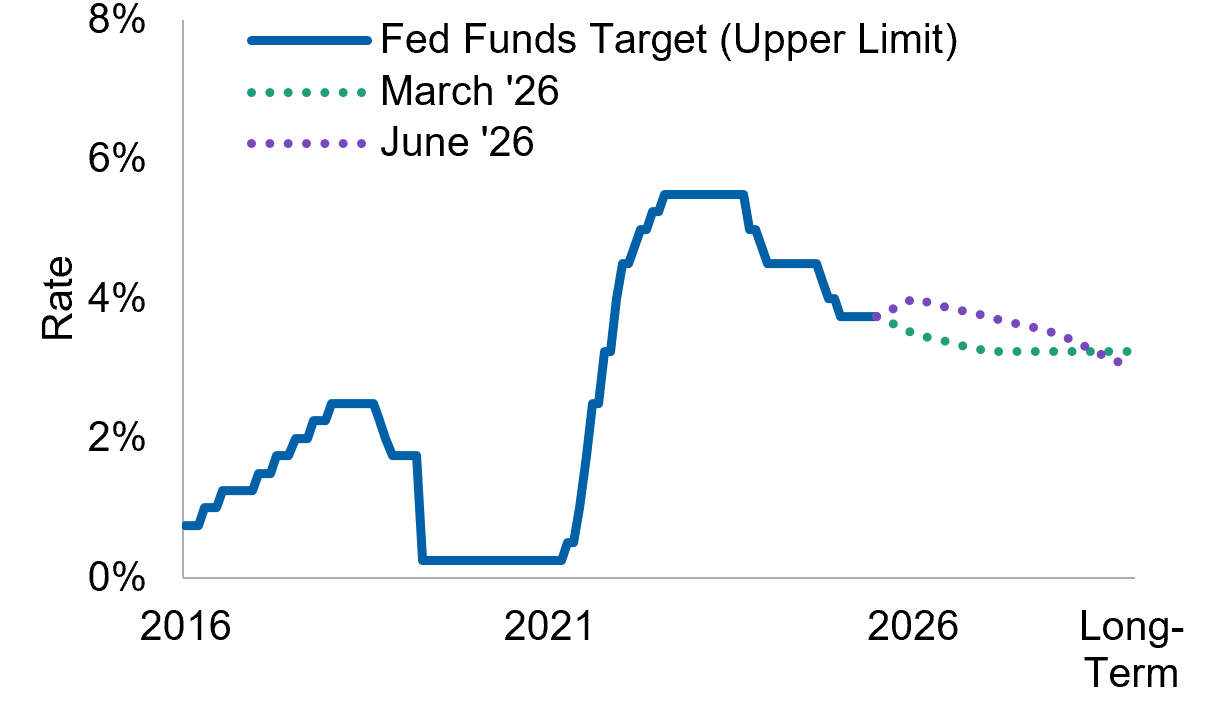
Data as of 30 June 2026 unless otherwise noted.
1Source: Macrobond/Federal Reserve.
A Tale of Two Styles
Style leadership is becoming increasingly regional. In the U.S., we remain modestly overweight Growth over Value. Continued AI investment, positive earnings revisions, strong free cash flow, and healthy balance sheets continue to support the Growth complex. A high-profile IPO pipeline could also support interest in U.S. Growth by bringing more innovation-led companies into public markets. Valuations and concentration remain risks, so this is not a call to chase Growth indiscriminately, but the earnings engine remains compelling and has been supported by strong return on equity. That leadership is not universal. In developed markets outside the U.S., Growth does not have the same depth of AI exposure, while Value benefits from a more attractive mix of valuations and improving fundamentals. Positive interest rates continue to support financials, fiscal expansion is benefiting cyclicals, and rising defense spending is creating a multi-year tailwind for industrials and infrastructure. The takeaway: we favor Growth where earnings leadership remains strongest, and Value where improving fundamentals and supportive policy have the potential to drive the next leg of earnings growth.
Mind the Valuation Gap2
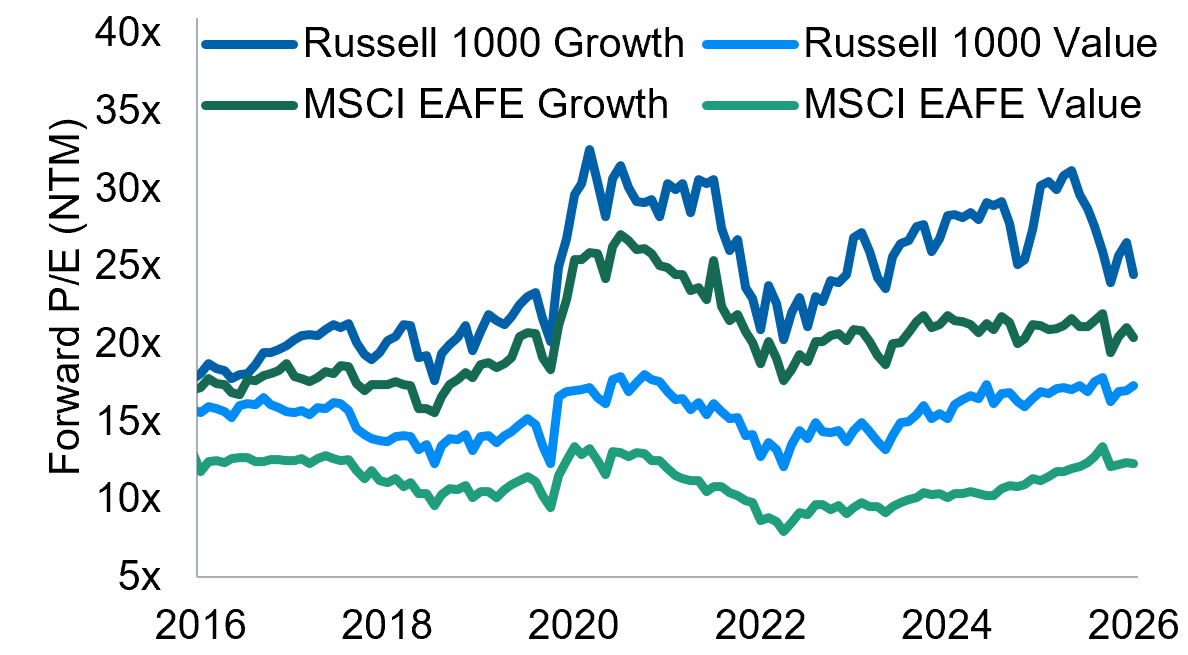
Data as of 30 June 2026 unless otherwise noted.
2Sources: FactSet, FTSE Russell and MSCI. Please see additional disclosures for more information.
Asset Class Positioning
These views are informed by a subjective assessment of the relative attractiveness of asset classes and subclasses over a 6- to 18-month horizon.

Asset Classes
- We remain neutral on equities overall predicated on a constructive earnings outlook and fiscal stimulus balanced against elevated valuations and the uncertain geopolitical backdrop.
- Within equities, we continue to favor U.S. growth, emerging markets, and small-cap stocks.
- We maintain a cautious stance on duration reflected through underweights to long-term U.S. Treasuries and Core bonds, along with an overweight to high yield.
- We also maintain a long position in short-term TIPS held as inflation protection.
- Though we still find cash yield levels reasonably attractive, we maintain a neutral position given cash yields are slightly below short-term bond yields.
Equities
Regional Views
Valuations remain elevated, but strong earnings, AI capex, and M&A support fundamentals. Inflation and policy uncertainty remain risks.
Fiscal support, improving manufacturing, and moderated energy risks improve the outlook, but economic growth remains modest.
Attractive valuations and healthy earnings remain supportive, but budget concerns, inflation, and policy uncertainty weigh on sentiment.
Fiscal stimulus, capex tailwinds, and improving earnings revisions support sentiment, while tighter monetary policy remains a risk.
Energy and materials exposure cushions inflation, but commodity tailwinds could fade as oil normalizes. Valuations remain slightly elevated.
Commodity exposure supports earnings, but restrictive monetary policy, softer labor markets, and energy-sensitive demand keep the outlook cautious.
Reasonable valuations and AI-infrastructure scarcity support further strength, but crowded positioning and earnings cyclicality pose risks.
Policy support and anti-involution efforts may aid margins, but housing weakness and soft demand keep gains uneven.
Style & Capitalization Views
Tailwinds increasing due to the shift to agentic AI and earnings momentum. IPO pipeline and Russell rebalance likely boost momentum and volatility further.
Value supported by continued strength in cyclically oriented sectors. However, Fed cuts unlikely and valuation has become less attractive.
Growth stocks’ valuations are relatively expensive, while fundamentals remain somewhat underwhelming, and elevated energy costs pose a headwind.
Targeted fiscal spending and normalized interest rates driving earnings growth, particularly in industrials and financials. Valuations remain attractive.
Fundamentals are strong and accelerating among AI infrastructure beneficiaries. However, mega-cap tech companies could be held back by heavy capex spending.
Mid-caps have seen an influx of AI infrastructure capex beneficiaries due to the Russell rebalance. This should improve earnings growth outlook but increase volatility.
Small-cap momentum currently driven by expectations of broadening economic growth and attractive valuations for higher quality small-cap names. However, rising rates could become a headwind.
Rising fiscal stimulus, particularly in Europe and Japan offer support. However, elevated energy costs could weigh on consumer activity.
Fiscal policies could provide a tailwind for cyclical areas with still very attractive valuations. Sector offers greater number of idiosyncratic opportunities.
Offers mitigation from inflation shocks and benefits from AI build-out demand. Meanwhile, prices are more attractive after recent pullback in energy and precious metals.
Bonds
Regional & Sector Views
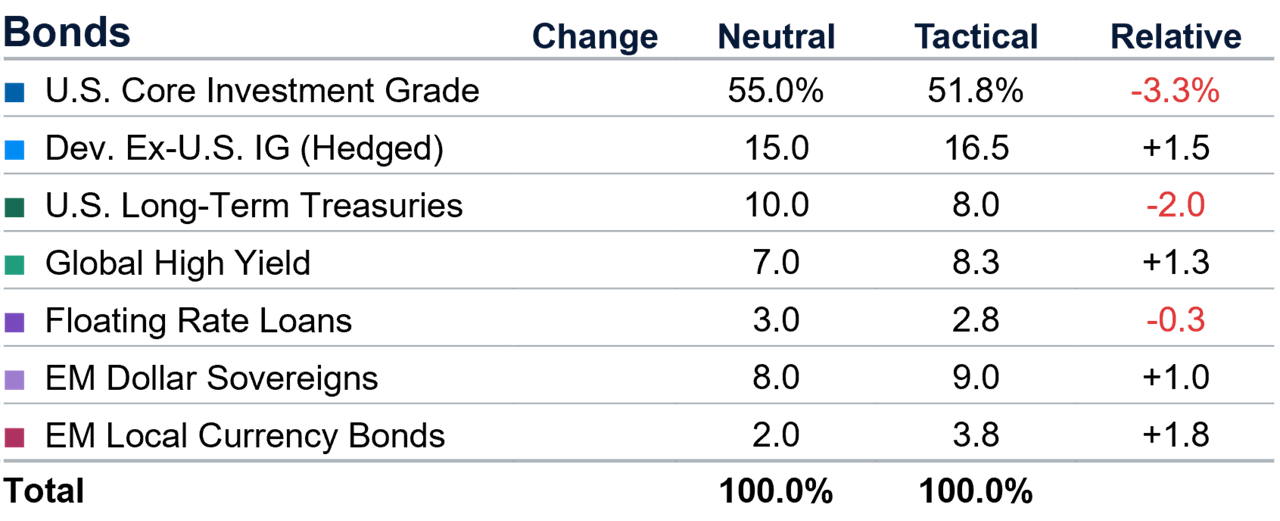
Persistent inflation pressures, stable growth and Fed on pause will likely keep rates elevated. Credit fundamentals still supportive, with spreads expensive relative to history.
Attractive yield levels, however higher vulnerabilities to energy price volatility warranting continued hawkish central bank tone.
Concerns around elevated inflation and fiscal deficits could keep upward pressure on long-end yields, with limited recession risk.
Although expectations seem to have peaked, inflation pressures driven by still elevated and volatile energy prices remains a risk.
Tight spreads may limit further upside potential, but sector is supported by healthy fundamentals, favorable sector exposures and low default expectations.
Sector still offers attractive yield levels, however, software sector challenges and tight spreads could limit further upside.
Attractive yields and fundamentals are supportive, though geopolitical backdrop could weigh on sentiment.
Compelling yields, however, recent dollar strength and war in Iran could continue to pose headwinds for the asset class.

Asset Allocation Viewpoints Webcast
Tune in. Take away actionable insights—direct from our top multi-asset experts.
Portfolio Implementation
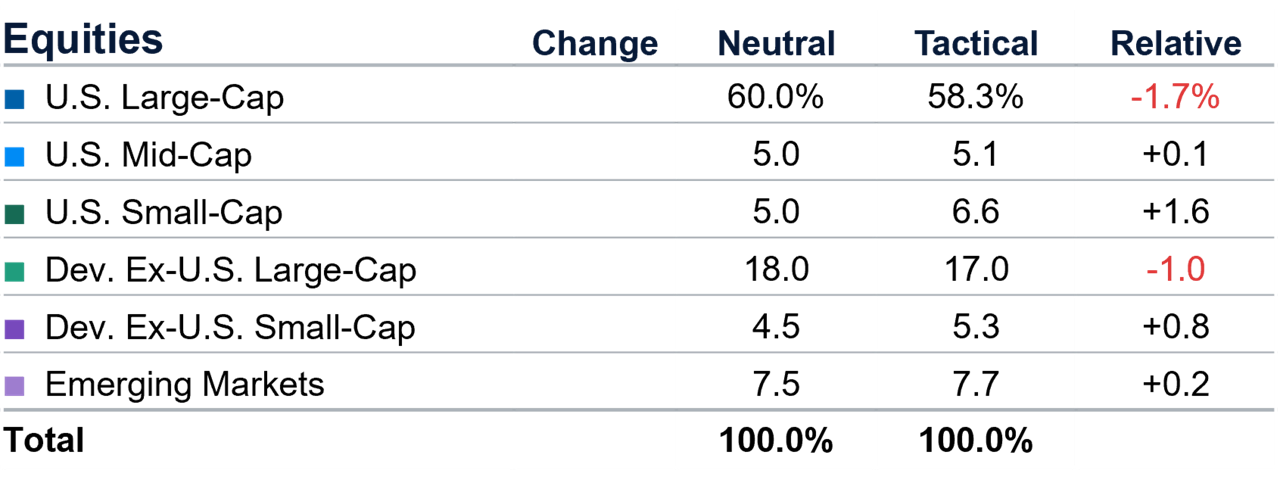
Equity
Tactical Allocation Weights

Bonds
Tactical Allocation Weights

ADDITIONAL DISCLOSURES
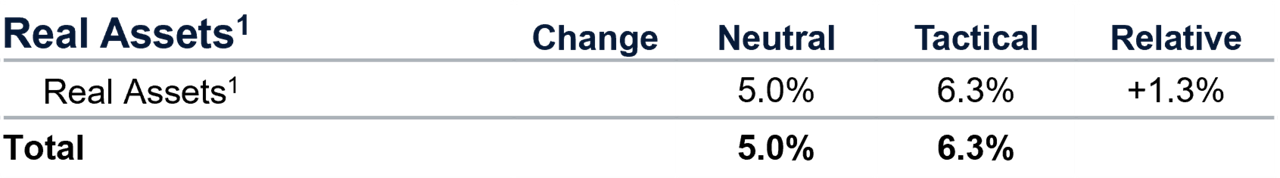
1 Real Assets allocation is representative as a percentage of the overall equity allocation.
Source: T. Rowe Price. Unless otherwise stated, all market data are sourced from FactSet. Copyright 2026 FactSet. All Rights Reserved.
These are subject to change without further notice. Figures may not total due to rounding.
Neutral equity portfolio weights are representative of a U.S.-biased portfolio with a 70% U.S. and 30% international allocation; includes allocation to real assets equities. Core fixed income allocation is representative of a U.S.-biased portfolio with 55% allocation to U.S. investment grade.
S&P, MSCI and FactSet do not accept any liability for any errors or omissions in the indexes or data, and hereby expressly disclaim all warranties of originality, accuracy, completeness, timeliness, merchantability, and fitness for a particular purpose. No party may rely on any indexes or data contained in this communication. Visit www.troweprice.com/marketdata for additional legal notices & disclaimers.
IMPORTANT INFORMATION
This material is being furnished for general informational and/or marketing purposes only. The material does not constitute or undertake to give advice of any nature, including fiduciary investment advice. Prospective investors are recommended to seek independent legal, financial and tax advice before making any investment decision. T. Rowe Price group of companies including T. Rowe Price Associates, Inc. and/or its affiliates receive revenue from T. Rowe Price investment products and services. Past performance is not a guarantee or a reliable indicator of future results.
This information is not intended to reflect a current or past recommendation concerning investments, investment strategies, or account types, advice of any kind, or a solicitation of an offer to buy or sell any securities or investment services. The opinions and commentary provided do not take into account the investment objectives or financial situation of any particular investor or class of investor. Please consider your own circumstances before making an investment decision.
Information and opinions presented have been obtained or derived from sources believed to be reliable and current; however, we cannot guarantee the sources’ accuracy or completeness. There is no guarantee that any forecasts made will come to pass. The views contained herein are as of the date noted on the material and are subject to change without notice; these views may differ from those of other T. Rowe Price group companies and/or associates. Under no circumstances should the material, in whole or in part, be copied or redistributed without consent from T. Rowe Price.
Risks: All investments are subject to risk, including possible loss of principal. Stock prices can fall because of weakness in the broad market, a particular industry, or specific holdings. Fixed-income securities are subject to credit risk, liquidity risk, call risk, and interest- rate risk. As interest rates rise, bond prices generally fall. Diversification does not assure a profit or protect against a loss in a declining market.
USA: T. Rowe Price Investment Services, Inc., and T. Rowe Price Associates, Inc.
© 2026 T. Rowe Price. All Rights Reserved. T. ROWE PRICE, INVEST WITH CONFIDENCE, the Bighorn Sheep design and related indicators (see troweprice.com/ip) are trademarks of T. Rowe Price Group, Inc. All other trademarks are the property of their respective owners. Use does not imply endorsement, sponsorship, or affiliation of T. Rowe Price with any of the trademark owners.
202607-5727173