
Stagflation calls for flexibility in fixed income, not abandonment
July 2026, Fixed Income
- Key Insights
-
- Stagflation has rarely affected all markets equally, with regional differences creating both opportunities and risks across global fixed income markets.
- History suggests inflation shocks are often followed by more supportive environments for fixed income returns.
- We believe the environment calls for a flexible fixed income approach that has the ability to adjust duration dynamically and invest broadly across a variety of different fixed income sectors.
Recent tensions in the Middle East and the resulting energy supply shock have heightened investor concerns about a return of stagflation—a period of rising inflation alongside slowing economic growth. While stagflation can be challenging for traditional bond benchmarks, history suggests it is not a reason to abandon fixed income. In fact, some of the strongest bond returns have historically followed periods of elevated inflation, as economies transition from stagflation to disinflation. The key question for investors is not whether to own bonds, but whether they own a strategy with the flexibility to navigate both phases of the cycle.
The key question for investors is not whether to own bonds, but whether they own a strategy with the flexibility to navigate both phases of the cycle.
Stagflation is rarely global
One of the biggest misconceptions about stagflation is that it affects all markets equally. History shows otherwise.
The oil shocks of the 1970s created dramatically different outcomes across regions. Energy‑importing economies such as the UK experienced surging inflation, weaker growth, and poor bond returns, while commodity‑producing economies generally proved more resilient. Similar patterns emerged following the Iranian Revolution in 1979 and during the inflation shock of 2021 to 2022, when Europe was more exposed to rising energy prices than the U.S. and several emerging markets benefited from having tightened policy earlier.
As Figure 1 illustrates, stagflation has historically produced very different outcomes across regions. Energy‑importing economies have often been the most vulnerable, while commodity exporters and countries with credible monetary policy frameworks have generally been more resilient. This regional divergence is one of the strongest arguments for a flexible global fixed income approach.
Historical stagflation episodes and fixed income outcomes
(Fig. 1) How sovereign bonds and credit markets performed during past inflation shocks.
| Period | Inflation Shock | Sovereign Bonds | Credit Markets | Regional Differences |
| 1973–1975 | OPEC oil embargo | Significant real losses as inflation surged. | Cyclicals and energy‑intensive sectors came under pressure. | UK and Europe were among the hardest hit due to their energy dependence, while commodity‑exporting economies generally benefited. |
| 1979–1982 | Iranian Revolution and oil shock | Duration1 came under pressure initially before recovering as inflation peaked. | Greater issuer dispersion and refinancing pressure. | Energy‑importing economies were particularly affected, while commodity‑producing economies proved more resilient. |
| 1990–1991 | Gulf War oil shock | Recovered as recession fears emerged. | Credit spreads2 widened. | U.S. and developed markets experienced a temporary inflation shock rather than a prolonged stagflation regime. |
| 2021–2022 | Supply chains and energy shock | Bond and equity markets experienced simultaneous declines. | Higher‑quality credit generally proved more resilient. | Europe was more exposed to energy disruption than the U.S., while several emerging market countries benefited from earlier policy tightening. |
Past performance is not a guarantee or a reliable indicator of future results.
As of June 2026.
For illustrative purposes only.
1 Duration is a measure of a bond or bond portfolio’s interest rate sensitivity. Short duration bonds are less sensitive than longer‑duration bonds to changes in interest rates.
2 Credit spread is the difference in yield between securities with similar maturity but different credit quality. Widening spreads generally indicate deteriorating creditworthiness of corporate borrowers, and narrowing indicate improving.
Source: T. Rowe Price analysis.
To illustrate how fixed income markets can behave during inflationary shocks, Figure 2 compares the performance of major fixed income sectors during the 2022 inflation shock and the subsequent recovery in 2023. As inflation surged and central banks aggressively tightened policy, bond yields rose sharply, credit spreads widened and most fixed income sectors experienced significant drawdowns, with longer‑duration assets hit hardest.
Bond sector performance during 2022 stagflation environment
(Fig. 2) Comparison of performance during the shock and over the subsequent 3‑, 6‑, and 12‑month periods.
| Sector | Cumulative Performance Feb. ‘22–July ‘23 (%) | Max Drawdown During the Stagflation Event (%) | 3 Months After Aug. ‘23–Oct. ‘23 (%) | 6 Months After Aug. ‘23–Jan. ‘24 (%) | 12 Months After Aug. ‘23–July ‘24 ;(%) |
| Emerging Market U.S. Dollar Corporates | -7.8 | -13.2 | -3.0 | 4.6 | 9.4 |
| Emerging Market U.S. Dollar Sovereigns | -10.2 | -16.2 | -5.4 | 3.7 | 9.2 |
| U.S. High Yield Corporates | -2.5 | -11.4 | -2.1 | 6.2 | 11.1 |
| Developed Market Treasuries Excl. U.S. | -14.9 | -19.6 | -5.9 | 1.0 | 1.1 |
| European High Yield Corporates | -6.0 | -22.8 | -3.8 | 5.8 | 9.1 |
| European Investment‑Grade Corporates | -17.1 | -26.0 | -5.7 | 3.0 | 4.0 |
| U.S. investment-grade Corporates | -9.7 | -15.1 | -5.2 | 4.6 | 6.8 |
| U.S. Treasuries | -9.7 | -12.1 | -3.9 | 2.5 | 4.1 |
| U.S. agency mortgage‑backed securities | -8.9 | -12.8 | -6.0 | 2.7 | 4.9 |
Past performance is not a guarantee or a reliable indicator of future results.
As of June 2026.
For illustrative purposes only. Maximum drawdown is the largest peak-to-trough decline in total return experienced during the stagflation period. Emerging market U.S. dollar corporates are represented by the Bloomberg Emerging Markets USD Corporate Bond Index, Emerging market U.S. dollar sovereigns are represented by the Bloomberg EM USD Sovereign Bond Index, U.S. high yield corporates are represented by the Bloomberg US Corporate High Yield Index, Developed market treasuries (excluding U.S.) are represented by the Bloomberg Global Aggregate Treasuries Index, European high yield corporates are represented by Bloomberg Euro High Yield Index, European investment‑grade corporates are represented by Bloomberg Euro Corporate Index, U.S. investment‑grade corporates are represented by the Bloomberg US Corporate Index, U.S. Treasuries are represented by the Bloomberg US Treasury Index, U.S. agency mortgage‑backed securities (MBS) are represented by the Bloomberg US MBS Index.
Source: Bloomberg Finance L.P. Analysis by T. Rowe Price.
The recovery that followed was equally instructive. As inflation moderated and markets began pricing the end of tightening cycles, fixed income sectors rebounded strongly. The episode highlights an important lesson: inflation shocks can create short‑term pain, but they have often been followed by attractive fixed income returns.
It also demonstrated the value of flexibility. A strategy able to reduce duration and allocate to break‑even inflation would likely have been more resilient during the drawdown, while retaining the flexibility to add duration and potentially capture the subsequent recovery as inflation peaked and disinflation emerged.
While 2022 is the closest historical comparison to today’s environment, there are some important differences. Most notably, investors are starting from significantly higher bond yield levels. This does not eliminate volatility, but it can provide a larger income cushion against rising yields and improve prospective return potential relative to the starting point investors faced in 2022.
…regional divergence is one of the strongest arguments for a flexible global fixed income approach.
The opportunity after stagflation
While stagflationary shocks can create short‑term pain, history shows they have often been followed by periods of strong fixed income returns. As inflation peaked and markets began pricing policy easing, bond markets have historically entered powerful recovery phases. Investors who reduce bond allocations during periods of peak inflation risk missing some of the most potentially attractive opportunities in fixed income.
The stagflation cycle
(Fig. 3) The path from an energy shock to a bond bull market.
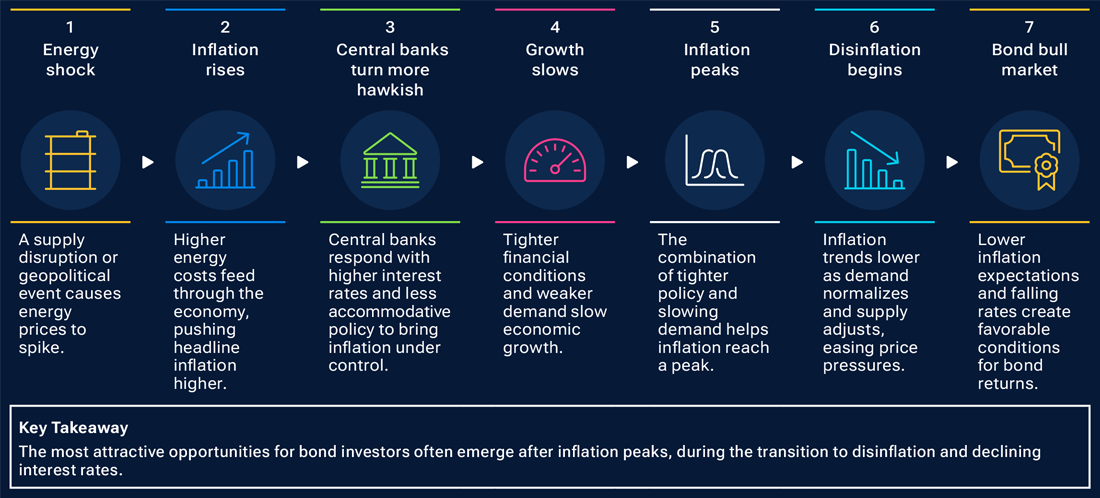
Past performance is not a guarantee or a reliable indicator of future results. Actual future outcomes may differ, perhaps materially.
For illustrative purposes only, past cycles may not repeat. This is not to be construed to be investment advice or a recommendation to take any particular investment action. Investments involve risks, including possible loss of principal.
Source: T. Rowe Price.
close
The importance of flexibility
We believe the environment calls for a global flexible fixed income strategy with the ability to adjust duration dynamically and invest across a broad range of sectors, including government bonds, corporate bonds, securitized assets, and inflation‑linked securities.
This flexibility can be particularly valuable during periods of stagflation. If an Iran‑related energy shock pushes inflation expectations higher while simultaneously weakening growth, a global flexible strategy could adjust duration exposure, reposition across regions, sectors, and issuers, and seek opportunities where markets may be mispricing inflation risks.
Is stagflation our base case?
Stagflation is not our base case, but it is a credible risk scenario if an extended Iran‑related conflict leads to a sustained energy shock. For now, the more likely outcome is slower growth and pockets of sticky inflation rather than a broad‑based repeat of the 1970s. Importantly, U.S. growth momentum remains relatively resilient, helping to reduce the likelihood of a severe stagflationary outcome. The key indicators to watch are energy prices, inflation expectations, wage growth, and whether central banks are forced to adopt a more hawkish stance in response to persistent inflation pressures.
Another important differentiator is central bank credibility. Countries where central banks have a strong track record of controlling inflation are often better positioned in stagflationary environments. While policymakers in these countries may need to raise rates earlier and more aggressively in response to an inflation shock, they typically do not need to tighten as much overall because inflation expectations remain better anchored. The experience of the 1970s illustrates this point. Germany’s Bundesbank was generally more proactive in responding to inflation pressures than many of its peers, helping to preserve policy credibility and ultimately limiting the scale of tightening required relative to countries where inflation became more deeply embedded.
While stagflationary shocks can create short‑term pain, history shows they are often followed by periods of strong fixed income returns.
Regional vulnerability to a stagflation shock
Higher Vulnerability: UK and Europe
Most exposed due to imported energy dependence, weaker growth prospects, and greater sensitivity to higher commodity prices.
Lower Vulnerability: United States
Stronger growth momentum and domestic energy production may help provide insulation, although a prolonged energy shock could keep inflation elevated and force a more hawkish policy stance.
Mixed Outlook:
- Asia: Japan remains vulnerable due to its dependence on imported energy and inflation that is already elevated relative to its historical experience. China presents a more nuanced picture. Weak domestic demand and excess industrial capacity remain disinflationary forces, although efforts to reduce destructive price competition and improve corporate profitability could eventually allow Chinese producers to pass through more cost pressures, potentially exporting inflation rather than suppressing it. More broadly, many Asian economies responded earlier to the postpandemic inflation shock than developed markets, leaving the region generally better positioned to absorb a renewed energy‑driven inflation impulse.
- Rest of World: Commodity exporters such as Canada and parts of Latin America could benefit from stronger terms of trade and higher commodity revenues. Meanwhile, countries such as Brazil and Mexico entered this period with higher real yields and greater policy flexibility after tightening aggressively earlier in the inflation cycle.
KEY TAKEAWAY
Stagflation is rarely a global phenomenon. Regional differences in energy dependence, growth momentum, inflation dynamics, and policy settings create both risks and opportunities—reinforcing the value of a flexible global fixed income approach.
Periods of stagflation can be uncomfortable for investors, but they should not be a reason to abandon fixed income. History shows that inflation shocks can create significant divergences across regions, sectors, and asset classes, generating opportunities for active managers with the flexibility to respond. More importantly, stagflation has historically been a transition phase rather than a permanent state. As inflation eventually moderates and growth slows, bond markets have often entered a disinflationary environment that has been supportive of fixed income returns.
The investment implication is clear: rather than reducing bond allocations, investors should consider whether their fixed income exposure is flexible enough to navigate both the inflationary shock and the disinflationary recovery that often follows.
 Vincent Chung, CFA
Portfolio Manager
Vincent Chung, CFA
Portfolio Manager
 Amanda Stitt
Portfolio Specialist
Amanda Stitt
Portfolio Specialist
Guidance for your next step.
Our planners and professionals share perspectives to support your financial journey.
T. Rowe Price cautions that economic estimates and forward‑looking statements are subject to numerous assumptions, risks, and uncertainties, which change over time. Actual outcomes could differ materially from those anticipated in estimates and forward‑looking statements, and future results could differ materially from historical performance. The information presented herein is shown for illustrative, informational purposes only. Any historical data used as a basis for analysis is based on information gathered by T. Rowe Price and from third‑party sources that have not been verified. Forecasts are based on subjective estimates about market environments that may never occur. Any forward‑looking statements speak only as of the date they are made. T. Rowe Price assumes no duty to, and does not undertake to, update forward‑looking statements.
Investment Risks
Fixed‑income securities are subject to credit risk, liquidity risk, call risk, and interest‑rate risk. As interest rates rise, bond prices generally fall. Investments in high‑yield bonds involve greater risk of price volatility, illiquidity, and default than higher‑rated debt securities. International investments can be riskier than U.S. investments due to the adverse effects of currency exchange rates, differences in market structure and liquidity, as well as specific country, regional, and economic developments. These risks are generally greater for investments in emerging markets. Mortgage‑backed securities are subject to credit risk, interest‑rate risk, prepayment risk, and extension risk. In periods of no or low inflation, other types of bonds, such as US Treasury Bonds, may perform better than Treasury Inflation Protected Securities.
Additional Disclosures
For U.S. investors, visit troweprice.com/glossary for definitions of financial terms.
Please see vendor indices for more information, including definitions and source data: troweprice.com/marketdata.
Important Information
This material is being furnished for informational and/or marketing purposes only and does not constitute an offer, recommendation, advice, or solicitation to sell or buy any security.
Prospective investors should seek independent legal, financial and tax advice before making any investment decision. T. Rowe Price group of companies including T. Rowe Price Associates, Inc. and/or its affiliates receive revenue from T. Rowe Price investment products and services.
Past performance is not a guarantee or a reliable indicator of future results. All investments involve risk, including possible loss of principal.
Information presented has been obtained from sources believed to be reliable, however, we cannot guarantee the accuracy or completeness. The views contained herein are those of the author(s), are as of July 2026, are subject to change, and may differ from the views of other T. Rowe Price Group companies and/or associates. Under no circumstances should the material, in whole or in part, be copied or redistributed without consent from T. Rowe Price.
All charts and tables are shown for illustrative purposes only. Actual future outcomes may differ materially from any estimates or forward‑looking statements provided.
The material is not intended for use by persons in jurisdictions which prohibit or restrict the distribution of the material and in certain countries the material is provided upon specific request.
Issued in the USA by T. Rowe Price Investment Services, Inc., distributor and T. Rowe Price Associates, Inc., investment adviser, 1307 Point Street, Baltimore, MD 21231, which are regulated by the Financial Industry Regulatory Authority and the U.S. Securities and Exchange Commission, respectively.
© 2026 T. Rowe Price. All Rights Reserved. T. Rowe Price, INVEST WITH CONFIDENCE, the Bighorn Sheep design, and related indicators (see troweprice.com/ip) are trademarks of T. Rowe Price Group, Inc. All other trademarks are the property of their respective owners. Use does not imply endorsement, sponsorship, or affiliation of T. Rowe Price with any of the trademark owners.
- 202606-5641090