Financial Planning Tools
Designed to help you make informed choices. Access the tools and resources you need to confidently choose accounts, research funds, and manage your portfolio independently. We’re here to help whenever you need it.
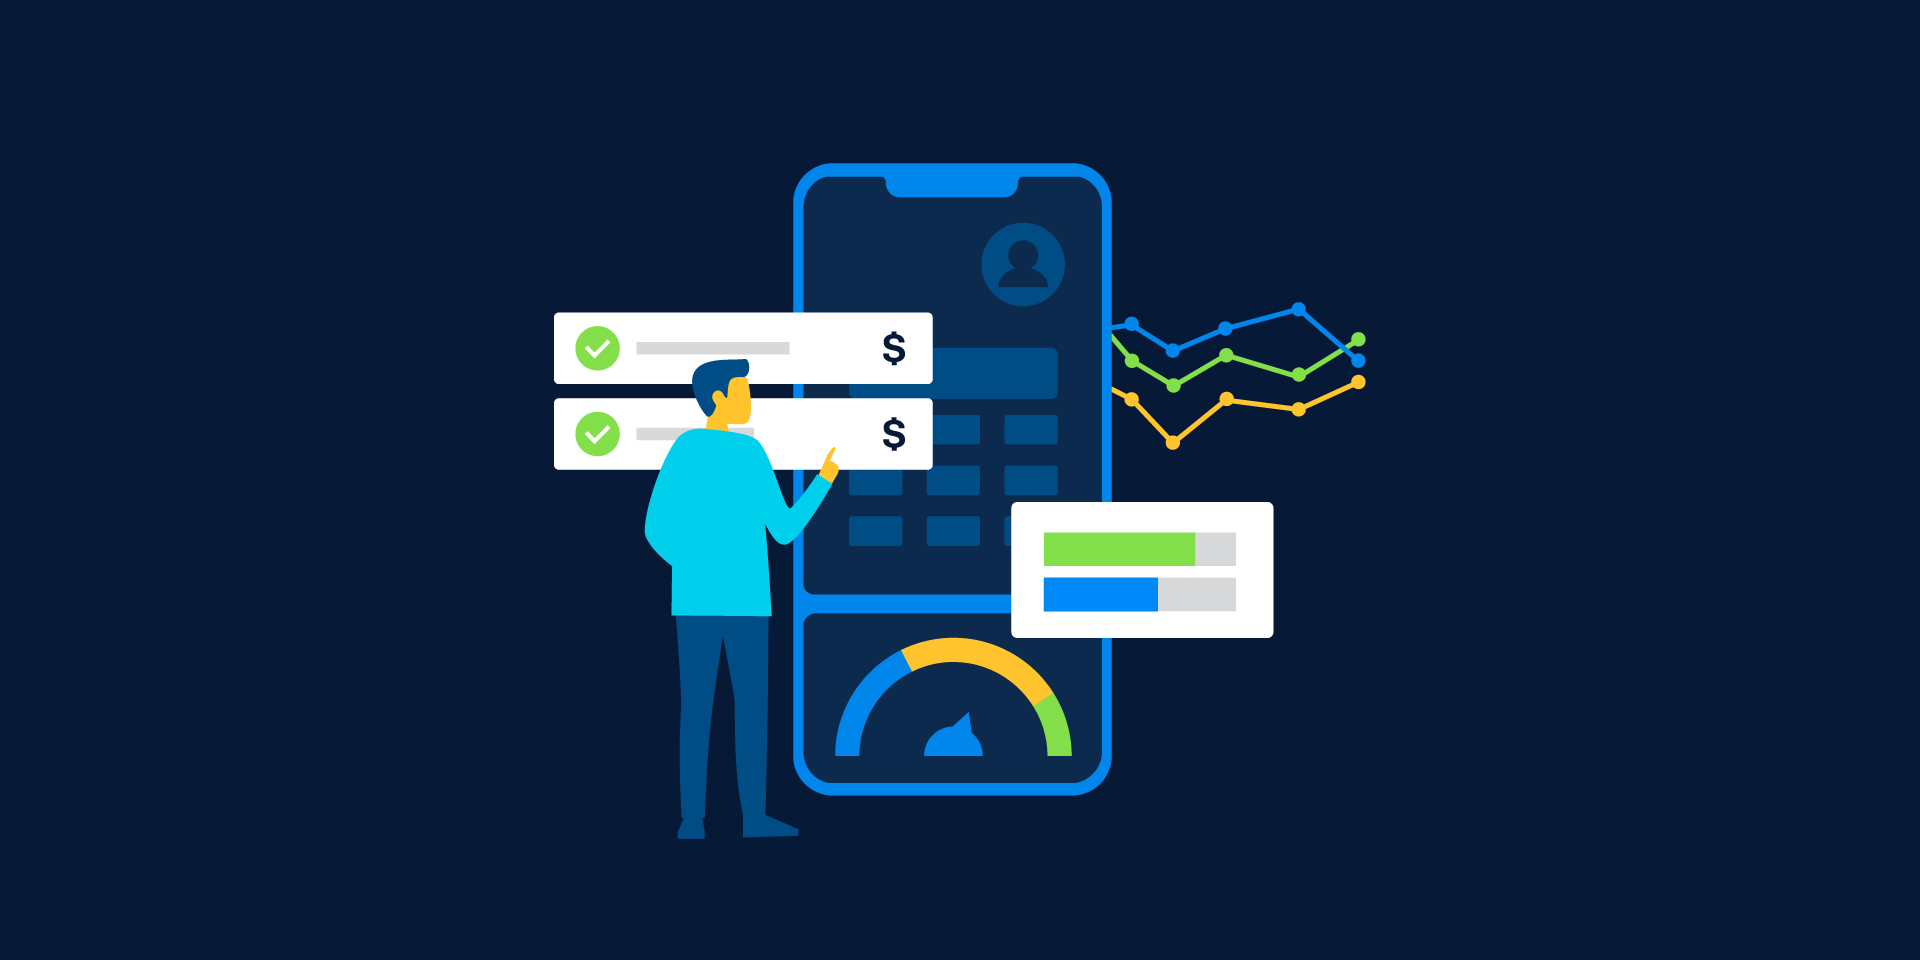
Our tools are designed to help make investing easy
Use our financial tools and calculators to help inform your decisions, from saving for retirement to finding funds that match your investment goals.

Investment Goal Guide

Evaluate your retirement readiness
See how changes to your investing approach may impact your retirement progress based on your age, income, Social Security eligibility, and current savings.

Research active ETFs and other funds
Choose T. Rowe Price mutual funds, or open a Brokerage account to invest in exchange-traded funds (ETFs) and non-T. Rowe Price securities.

Determine your Social Security claiming strategy
Looking to maximize your Social Security benefits? Our Social Security Optimizer can help you get the most out of your monthly payout in retirement.

Explore Watchlists
Track and monitor specific investments with your Watchlist. Easily keep an eye on performance, price changes, and detailed historical data that help you make investment choices when you're ready.

Consider Automatic Buy
Invest for your goals automatically with regular, recurring transfers from your bank account to your T. Rowe Price portfolio.

Diversify your portfolio
As a T. Rowe Price client, see how your current portfolio measures up to a Target Asset Allocation that you select with our Portfolio Optimizer.
Why T. Rowe Price is the best place to invest your money
60%+
For the 10-year period ended March 31, 2026, over 60% of our mutual funds with a 10-year track record outperformed their 10-year Lipper average.*
55+
Over 55 of our mutual funds have earned 4- or 5-star Overall Morningstar Ratings as of 3/31/2026.**
85+
With over 85 years of experience, our solutions are time-tested.
Invest for your short- and long-term goals
Start investing today
Help make the most of your money.
Need help finding the right account?
Our Financial Consultants can help you find the right solution for your goals.
Monday—Friday, 8 a.m.—8 p.m. ET
Financial advice solutions
We offer different levels of advice to fit your needs and help you save enough for the future you envision.
All investments are subject to market risk, including the possible loss of principal. Past performance is no guarantee or reliable indicator of future results.
ETFs are bought and sold at market prices, not NAV. Investors generally incur the cost of the spread between the prices at which shares are bought and sold. Buying and selling shares may result in brokerage commissions which will reduce returns.
This material is provided for general and educational purposes only and is not intended to provide legal, tax, or investment advice. This material does not provide recommendations concerning investments, investment strategies, or account types; it is not individualized to the needs of any specific investor and is not intended to suggest that any particular investment action is appropriate for you.
(*) 142 of our 307 mutual funds had a 10-year track record as of 3/31/2026 (includes Investor Class and I Class Shares). 88 of these 142 mutual funds (62%) beat their Lipper average for the 10-year period. 154 of 301 (51%), 159 of 280 (57%), and 137 of 241 (57%) of the mutual funds outperformed their Lipper average for the 1-, 3-, and 5-year periods ended 3/31/2026, respectively. Calculations based on cumulative total return. Not all mutual funds outperformed for all periods. (Source for data: Lipper Inc.) Past performance is no guarantee or a reliable indicator of future results.
(**) Morningstar gives its best ratings of 5 or 4 stars to the top 32.5% of all funds (of the 32.5%, 10% get 5 stars and 22.5% get 4 stars) based on their risk-adjusted returns. The Overall Morningstar Rating™ is derived from a weighted average of the performance figures associated with a fund’s 3-, 5-, and 10-year (if applicable) Morningstar Rating™ metrics. As of 3/31/2026, 60 of 156 of our Investor Class mutual funds (excludes mutual funds not available for direct purchase) received an overall rating of 5 or 4 stars.
The Morningstar Rating™ for funds, or “star rating,” is calculated for funds with at least a three-year history. Exchange-traded funds and open-ended mutual funds are considered a single population for comparative purposes. It is calculated based on a Morningstar Risk-Adjusted Return measure that accounts for variation in a managed product’s monthly excess performance, placing more emphasis on downward variations and rewarding consistent performance. The top 10% of products in each product category receive 5 stars, the next 22.5% receive 4 stars, the next 35% receive 3 stars, the next 22.5% receive 2 stars, and the bottom 10% receive 1 star.
Source for Morningstar data: ©2025 Morningstar, Inc. All Rights Reserved. The information contained herein: (1) is proprietary to Morningstar and/or its content providers; (2) may not be copied or distributed; and (3) is not warranted to be accurate, complete, or timely. Neither Morningstar nor its content providers are responsible for any damages or losses arising from any use of this information. Past performance is no guarantee of future results.
202606-5496295