
Metamorphosis: How flows, ownership and technology are changing markets
July 2026, Markets and Economy
When faced with uncertainty, markets sell first and ask questions later. This tends to trigger episodes of elevated volatility (“volatility” being a euphemism for declining markets). Yet market recoveries appear to be occurring more quickly, with periods of heightened volatility proving increasingly short‑lived—suggesting that the nature of market corrections may be changing.
Take the March sell‑off at the start of the current military conflict. If investors were told six months ago that there would be direct military conflict in the Middle East, a subsequent 80bp rise in yields, and months of disruption in the Strait of Hormuz, most would have penciled in a 15% S&P 500 drawdown. Instead, the S&P 500 Index corrected only 8% and a full recovery to pre‑conflict levels took just 11 trading sessions.1 Given the inflation risk typically associated with supply shocks, this seems like an unreasonably short space of time.
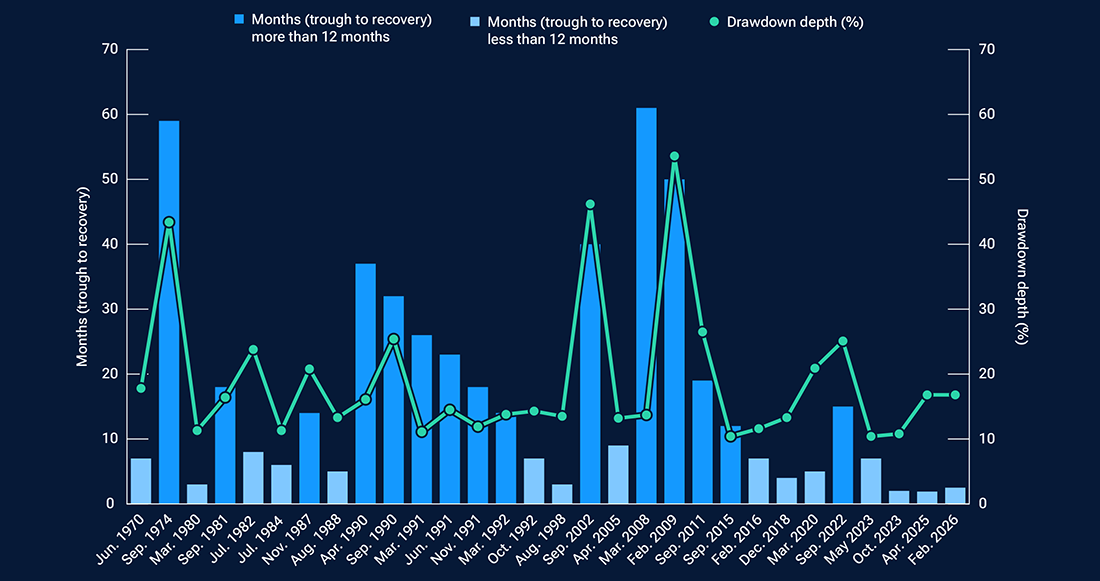
It is not, however, new: the market’s resilience has been building for some time. Since 1970, the MSCI World Index has experienced 28 episodes of drawdowns reaching 10% or more. Four of the five fastest recoveries occurred after 1998, with three happening in the past decade. And the three fastest recoveries from bear market lows to a bull‑market doubling since the S&P 500’s inception in 1950 have happened since the 2008 global financial crisis. This clustering of “V‑shaped” recoveries is not just an artifact of a few outliers; it is a defining feature of modern markets (Figure 1).
Markets are bouncing back faster
(Fig. 1) V‑shaped recoveries have occurred more often in recent years
As of May 20, 2026.
Source: Bloomberg Finance L.P.
close
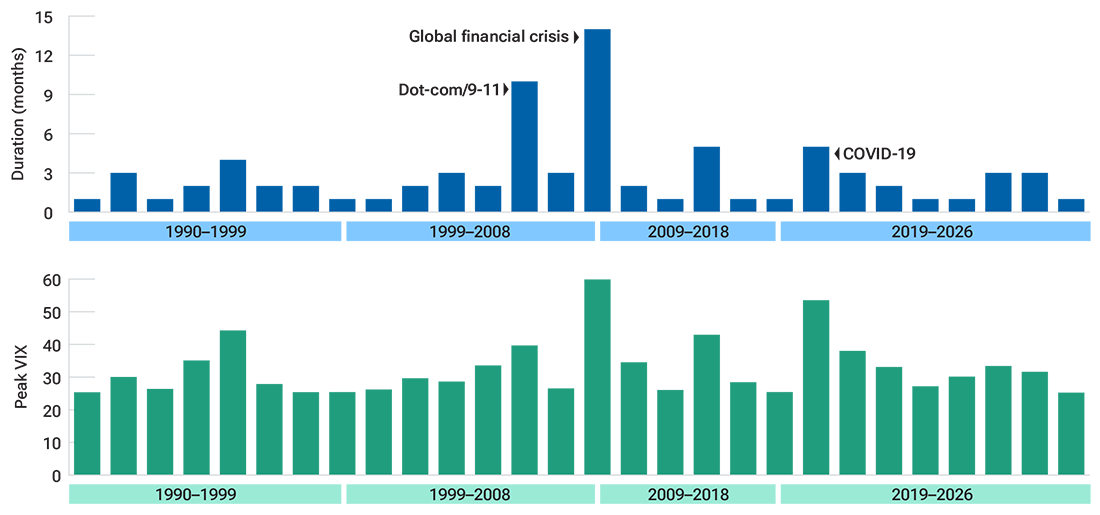
The episodes of volatility associated with these drawdowns have also been shorter in recent periods, the two most prolonged periods of sustained fear on record, the 2002–03 dot‑com/9/11 cluster and the 2008–09 global financial crisis, ran for 10 months and 14 months respectively. Since 2010, however, volatility spikes have compressed sharply (Figure 2). The 2011 European debt crisis and the 2020 Covid‑19 dislocation, for example, both ran for just five months. A number of more recent episodes amounted to little more than one‑month disruptions, including the 2015 China devaluation, the December 2018 Fed pivot scare, the November 2021 Omicron Covid‑19 variant, Russia’s invasion of Ukraine in February 2022, the April 2025 tariff shock, and the March 2026 U.S.‑Iran conflict.
Volatility spikes have been shorter in duration
(Fig. 2) Most recent episodes have ended quickly
As of March 31, 2026.
The VIX measures expected stock market volatility over the next 30 days based on S&P 500 option prices. Each “volatility spike” is measured in months from the start of a selloff to the end.
Source: Bloomberg Finance L.P. and the Chicago Board Options Exchange.
close
Why is this happening? Part of the reason is that policy reaction functions have changed. The policy responses to the global financial crisis and Covid‑19 pandemic demonstrate a willingness of central banks and fiscal authorities to respond forcefully and quickly to market and economic stress. Forward guidance, emergency facilities, and large‑scale balance sheet operations have compressed both the depth and the duration of many risk‑off episodes. Put simply, every time the market falls off its bike, the authorities wipe its knee. And because the market knows this, it has been conditioned to buy the dips and move on.
However, it would be lazy to suggest that public policy is the sole influence on investor behavior, and dangerous to assume that it will continue indefinitely. In the analysis below, rather than focusing on policy responses or central bank interventions, we look at how markets themselves have changed.
Since 2010, however, volatility spikes have compressed sharply.
The volatility paradox
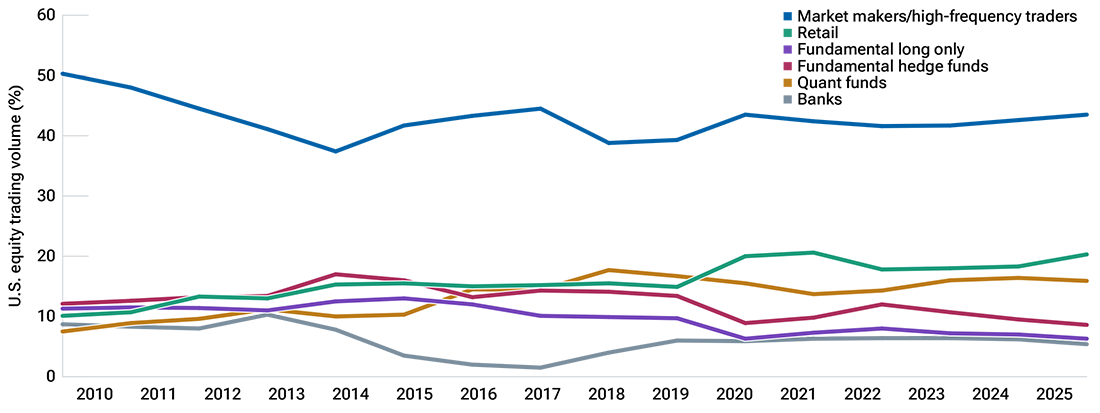
Over the past 15 years, retail and quantitative funds have gained market share as fundamental strategies, both long‑only and long‑short, have declined (Figure 3). This, combined with the growth of indexation and other passive investment strategies, has materially changed how U.S. equities trade: it has increased market‑level correlations, altered liquidity and volatility patterns, and made flows and positioning as important as fundamentals in the short run. The Investment Company Institute’s 2025 Investment Company Fact Book reports that, by the end of 2024, index mutual funds and ETFs together accounted for 51% of assets in long‑term mutual funds—around 18% of the value of U.S. stocks at that time.
One consequence of this has been a migration of liquidity toward the market close. Because index funds and ETFs seek to minimize tracking error, they typically execute trades near the close so their transaction prices align closely with the official closing prices used to calculate both index values and fund net asset values. According to Mehmet Kinak, Global Head of Equity Trading at T. Rowe Price, roughly 30% of U.S. equity trading volume now occurs in the last 30 minutes inclusive of the close. And while this concentration of liquidity at end of day has not impaired the market’s ability to incorporate information into prices, it can reduce intraday resilience and make prices more prone to shocks away from the close, especially in less liquid names and around index rebalancing events. This has increased volatility at the individual stock level.
Retail and quant funds have gained market share
(Fig. 3) Fundamental strategies’ trading volume has declined
As of December 31, 2025.
Source: Bloomberg Finance L.P.
close
There are, however, other forces at work. Passive flows are systematic, regular, and largely insensitive to price or valuation, and continue to buy even during periods of market weakness. Defined‑outcome ETFs are also helping to suppress volatility by systematically selling index options, creating a structural bid for short VIX exposure. As a result, stock‑level volatility has been elevated while, paradoxically, index‑level volatility is suppressed.
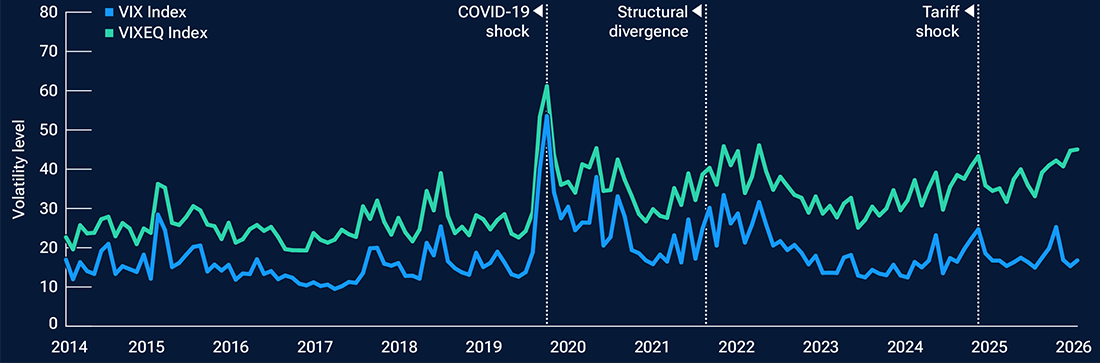
Sector dynamics reinforce this effect. Intra‑sector movements within Information Technology are the single largest driver of dispersion and Big Tech has realized volatility approximately three times that of the S&P 500. This helps explain the widening gap between VIX (index volatility) and VIXEQ (the implied volatility of the individual stocks within the S&P 500). In the current AI‑driven market regime, stocks are increasingly moving in different directions; when aggregated into an index, those offsetting moves partially cancel each other out, dampening index‑level volatility even as volatility within individual stocks remains elevated.
Since early 2022, the spread between the VIXEQ and the VIX has persistently widened well beyond its historic range, expanding from 10 points to 20–28 points as VIX compressed into the low teens while VIXEQ remained anchored in the 30s–40s (Figure 4). On June 2, the dispersion between stock‑level and index‑level volatility reached a record high of 30.8 points.
Index volatility has declined while stock volatility has remained elevated
(Fig. 4) The gap between the VIX and the VIXEQ has widened
As of June 19, 2026.
Source: Bloomberg Finance L.P.
close
Small‑cap lottery
It is well understood that passive flows into cap‑weighted2 indices mechanically allocate more to the largest winners, increasing concentration in mega‑cap stocks at the expense of smaller companies. However, the current low‑volatility/high dispersion regime has complicated the small vs large cap dynamic.
Volatility has historically been one of the strongest negative correlates of small cap relative performance: when volatility was high, small caps tended to underperform, and when it was low the dynamic tended to reverse. Yet despite a decade of volatility compression, small caps have meaningfully underperformed, giving back most of their historic small‑cap (illiquidity) premium (Figure 5). This suggests that passive flows and growing index concentration have become more powerful drivers of relative performance than the traditional volatility regime.
Market structure explains part of this divergence; investor behavior may explain another part. Prospect theory suggests that investors tend to overestimate the probability of positively skewed, lottery‑like payoffs. These tendencies underpin a preference for high‑risk stocks with high potential rewards. As a result, these securities often become overpriced and subsequently deliver disappointing forward returns.
Small caps have underperformed despite low volatility
(Fig. 5) Passive flows and index concentration are likely becoming more powerful drivers of performance
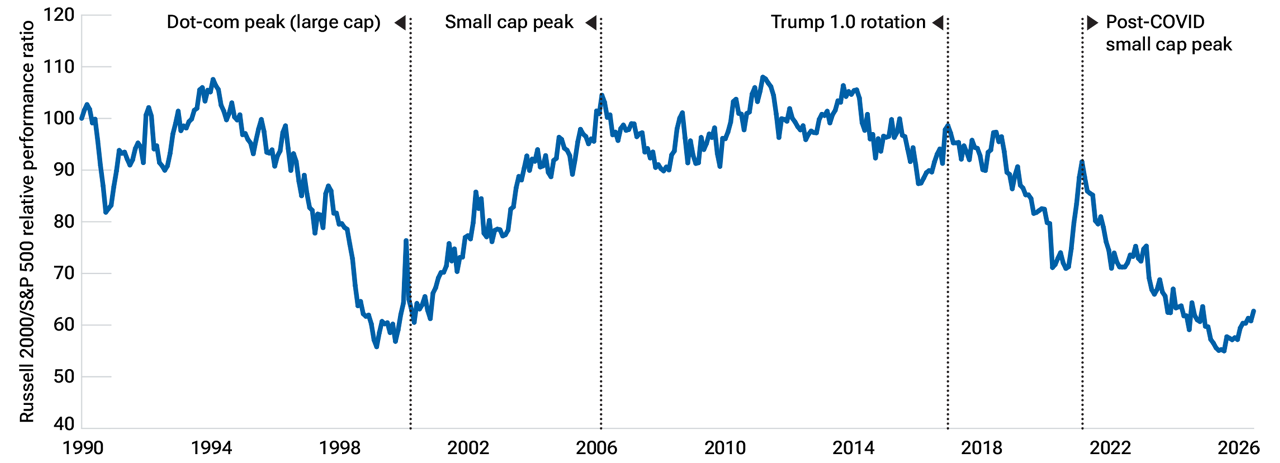
As of June 28, 2026.
The chart plots the Russell 2000 divided by the S&P 500. A declining line indicates the Russell 2000 is losing value relative to the S&P 500—i.e., small‑cap stocks are underperforming large‑cap stocks.
Source: Bloomberg Finance L.P.
close
We believe three phenomena are currently exacerbating this effect: AI innovation, which is creating the opportunity for outsized gains and may entice investors to seek huge payouts; market structure changes, such as growing retail participation and the popularity of options and thematic investing; and a lack of risk aversion, as fewer of today’s investors have experienced a sustained market correction.
The emergence of a potentially transformational technology like AI can produce an unusually wide dispersion of outcomes. Many firms resemble the short‑lived Pets.com; only a few will become the next Amazon.com. This breadth of possibilities increases the appeal of “lottery ticket” narratives. As the perception of AI’s capabilities grows, the imagined jackpot grows as well, drawing in investors and potentially driving price appreciation. The result is a reflexive loop in which rising prices reinforce conviction in the stock or theme, attracting more capital. Investors may also start treating stocks as options, where perceived fair value rises with volatility.
...despite a decade of volatility compression, small caps have meaningfully underperformed....
Retail intermediation: Loiter and lose money with friends
Understanding this “lottery phenomenon” requires an appreciation of how market plumbing has changed. Modern equity markets have undergone a series of structural transformations over the past two decades that have altered not only how securities are traded, but also where price discovery occurs and who drives liquidity.
Three developments are particularly important. First, decimalization compressed spreads and lowered trading costs, changing the economics of liquidity provision. Second, a growing share of trading migrated off‑exchange into dark pools (private trading venues) and wholesaler networks, fragmenting liquidity while concentrating much of the price discovery process in a smaller visible market. Third, commission‑free trading and the rapid growth of zero‑days‑to‑expiration (0DTE) options dramatically lowered the barriers to retail participation and concentrated activity in major indices and the largest stocks (Figure 6). On some days, retail investors account for as much as half of equity trading volume.
Retail participation in equity markets has grown
(Fig. 6) This has concentrated activity in the largest stocks
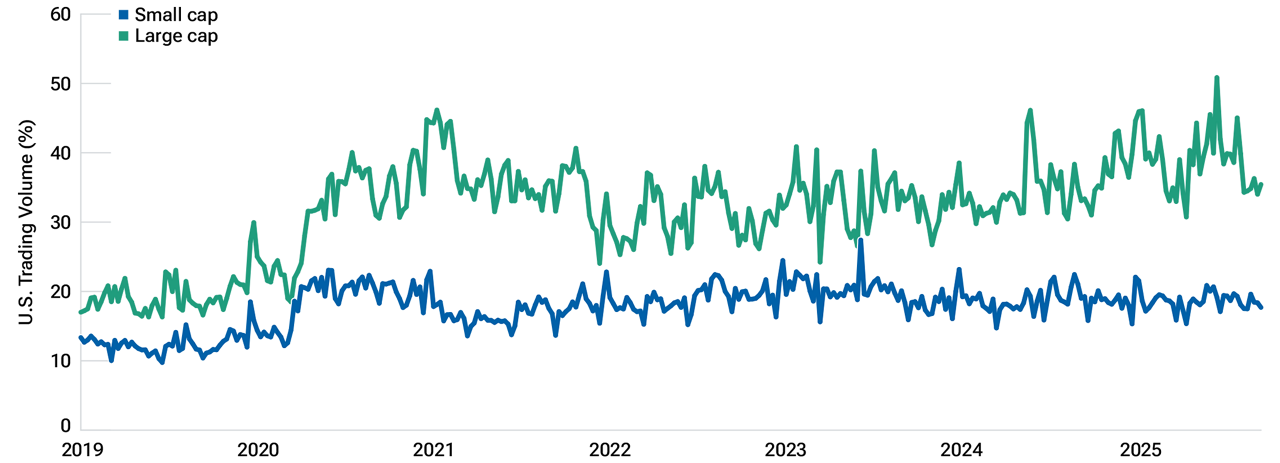
As of September 22, 2025.
Source(s): FINRA OTC Transparency Data and BofA Securities Methodology.
close
Against this backdrop, the emergence of meme stocks in 2021 marked a new phase in market behavior. The GameStop short squeeze demonstrated that retail investors, when coordinated through digital platforms and social media, can identify highly shorted stocks with challenging liquidity to mobilize sufficient demand to create extreme volatility. GameStop demonstrated that the interaction between modern brokerage platforms such as Robinhood, social platforms such as Reddit, and particularly subreddits such as WallStreetBets had become a meaningful force in short‑term price discovery. Communities such as Reddit’s WallStreetBets blur the lines between investing, entertainment and social identity—captured by the forum’s own irreverent invitation to “loiter and lose money with friends.”
In a 2024 paper, renowned U.S. quantitative manager Cliff Asness described the phenomenon as: “Instantaneous, gamified, cheap, 24‑hour trading…on your smartphone after getting all your biases reinforced by exhortations on social media from randos and grifters with vaguely not‑safe‑for‑work (NSFW) pseudonyms…what could possibly go wrong?3”
Retail investors now participate at scale and, aided by increasingly powerful AI tools, are often better informed than previous generations. But they also accelerate the spread of narratives and thematic investing. To the extent that retail investors have become the marginal buyers in many securities, attention itself has become a source of liquidity. Their incentives may be as much social as financial (although this thesis has yet to be tested by a sustained bear market) creating a market in which narratives can drive flows, and flows can drive prices.
The rise of passive in fixed income
While this paper has focused on equity markets, ownership and flow dynamics are impacting fixed income markets too. Passive fixed income (ex‑municipal bond) flows have exceeded active, and the stock of passively‑managed funds is approximately 40% of the total (Figure 7). Just as in equity markets, this has changed the dynamics in fixed income investing.
Steven Boothe, head of Investment Grade summarizes the impact: “The rise of passive has accelerated the growth of the ETF ecosystem. To be clear, ETFs are not popular solely because of passive, but the shift out of active into passive has allowed ETFs to scale much faster than otherwise.”
Ownership and flow dynamics have reshaped bond markets
(Fig. 7) Passive ownership is growing steadily
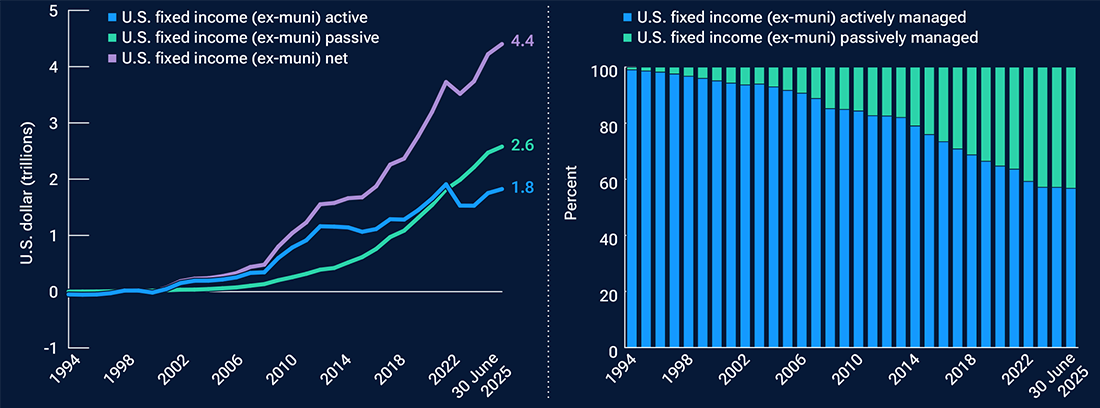
As of June 30, 2025.
Source: Morningstar Direct.
close
“The broader point is as passive takes greater share and must buy at any price, markets behave very differently than they did 20 years ago. Markets, both stocks and bonds, are increasingly inelastic.”
The implications extend beyond fixed income. Across equities and bonds alike, the balance of influence has shifted from traditional fundamental investors toward a broader set of actors including passive vehicles, derivatives markets, retail investors, and algorithmic strategies. These developments have not changed the importance of fundamentals, but they have changed how prices are formed and how capital is allocated.
Fundamentals still determine value. But flows, incentives, and market structure increasingly determine the path prices take to get there.
The key changes and what they mean
| What Changed? | What It Has Meant for Markets | What It Has Meant for Investors |
| Passive investing has become dominant | Flows have increasingly influenced prices alongside fundamentals | Understanding ownership and fund flows is now critical |
| Liquidity has migrated to the market close | Trading activity is increasingly concentrated in auctions | Execution and liquidity management have become more important |
| Index volatility has fallen while stock volatility has risen | Markets can appear calm even as individual stocks experience large moves | Active stock selection opportunities have increased with rising dispersion |
| AI innovation and lottery‑like pay‑offs | Investor behavior has become more speculative as potential outcomes have widened | Consider diversification when evaluating speculative themes. ‘Basket’ approaches may be valuable |
| Mega‑cap stocks attracted disproportionate passive inflows | Market concentration has increased significantly | Benchmark risks may be higher than they appear |
| Trading has moved off‑exchange into dark pools and wholesalers | Visible market liquidity represents only part of total activity | Traders and investors need a deeper understanding of market structure |
| Retail participation has surged | Social sentiment and narratives can influence prices | Attention and positioning have become important market drivers |
| 0DTE options and derivatives have grown rapidly | Short‑term flows can amplify market moves | Intraday volatility can be driven by technical rather than fundamental factors |
| Meme stocks and social investing have emerged | Prices can move sharply on crowd behaviour and social media activity | Liquidity and short‑selling risks require greater scrutiny |
| Passive investing has expanded into fixed income | Bond markets are increasingly influenced by ETF and index flows | Traditional fundamental signals may weaken |
| Quantitative and systematic strategies account for a larger share of trading | Markets have recently reacted faster and more mechanically to information | Understanding market participants is as important as understanding companies |
 Justin Thomson
Head, Investment Institute and CIO
Justin Thomson
Head, Investment Institute and CIO
Guidance for your next step.
Our planners and professionals share perspectives to support your financial journey.