
Beyond mega‑caps: Why SMID stocks deserve another look
June 2026, Equity
- Key Insights
-
- Now may be the time to look beyond large- and mega-caps—where a narrow group of benchmark leaders has dominated returns—toward small- and mid‑cap stocks (SMIDs), which currently offer improving earnings prospects, broader participation, and more attractive relative valuations.
- Lower research coverage in small‑ and mid‑cap stocks may create market inefficiencies, giving experienced active managers room to add value through fundamental research and stock selection.
- Fundamentals vary widely across the SMID universe, making selectivity especially important when seeking companies with durable earnings power, sound balance sheets, and the ability to compound through a full market cycle.
- For investors seeking exposure to this segment, the T. Rowe Price Small-Mid Cap ETF (TMSL) offers a research-driven way to access the SMID opportunity set, while retaining the flexibility, liquidity, and potential tax efficiency of the exchange‑traded fund (ETF) structure.
In recent years, a narrow group of mega‑cap companies has driven a disproportionate share of U.S. equity returns, pushing the S&P 500 Index to new highs. Yet market leadership has historically rotated, and many of tomorrow’s compounders begin their journey as small‑ and mid‑cap companies. Small‑ and mid‑cap, or SMID, companies typically sit earlier in their development cycles, with longer reinvestment runways and more room to expand margins, earnings, and cash flow. For investors whose portfolios are heavily concentrated in today’s index heavyweights, SMID exposure can reintroduce breadth, balance, and access to the next generation of leaders.
Finding tomorrow’s leaders beyond large‑caps
The case for looking beyond large‑ and mega‑caps appears to be strengthening. SMID companies are benefiting from a market environment that looks more balanced than it has in years.
On a forward price‑to‑earnings (P/E) basis, small‑ and mid‑cap companies currently trade at a notable discount to large‑caps. The gap in forward P/E ratios has widened over the past five years to levels well above the 20‑year average. Large‑cap valuations remain elevated versus their own history, while SMID valuations are closer to, or below, long‑term averages.
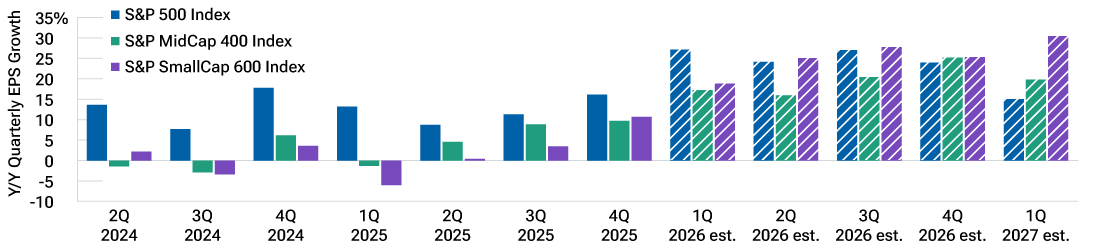
SMID earnings are also inflecting from a cyclical low. In TMSL, we focus on businesses where improving earnings are supported by durable competitive advantages and sound balance sheets. As shown in Figure 1, year‑over‑year earnings per share (EPS) growth estimates for SMID stocks have turned positive and are projected to outpace large‑cap stocks over the next several quarters. Supportive economic tailwinds—including potential interest rate cuts, reshoring initiatives, and infrastructure spending—tend to benefit domestically focused, operationally agile SMID businesses. This improving earnings momentum, off a depressed base, could position SMID stocks to participate more fully if market leadership broadens beyond the largest benchmark constituents.
SMID earnings growth expected to outpace large‑caps
(Fig. 1) Quarterly earnings per share growth, year over year
As of March 31, 2026.
Past performance cannot guarantee future results.
Source: Standard and Poor, analysis by T. Rowe Price.
close
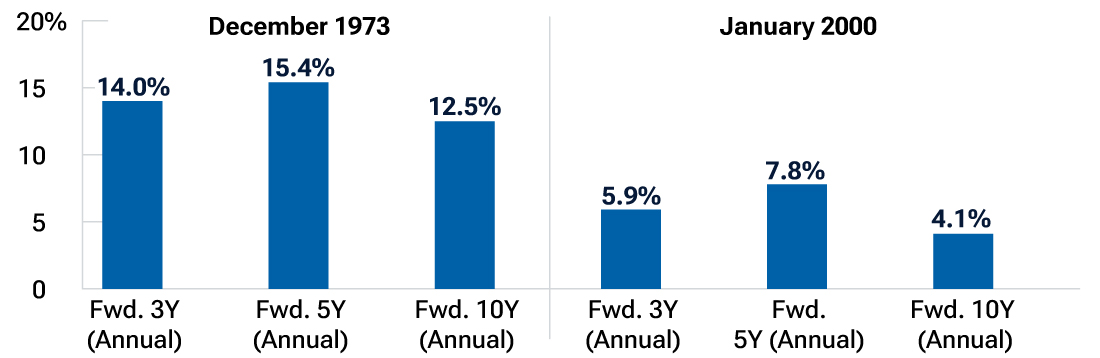
History also offers valuable perspective. Large‑cap leadership can persist for long periods. When that leadership wanes, however, small‑ and mid‑cap stocks have historically experienced periods of meaningful outperformance relative to large‑caps. Understanding why that opportunity exists requires a closer look at how this part of the market works. That’s where T. Rowe Price’s combination of long‑tenured SMID specialists and centralized portfolio construction can help distinguish healthy market broadening from lower‑quality beta participation.
Historical leadership shifts have favored small‑caps
(Fig. 2) Small‑cap returns relative to large‑cap returns following leadership shifts
As of March 31, 2026.
Past performance cannot guarantee future results.
Source: FactSet, analysis by T. Rowe Price. Please see Additional Disclosures for more information.
close
Taken together, valuation spreads, improving earnings expectations, and the potential for broader market leadership strengthen the case for SMID exposure. The opportunity, however, is not uniform, which makes quality and implementation critical.
Where active management makes a difference
What makes this segment of the market compelling for investors is not only valuation or earnings potential, but also the structure of the opportunity set itself—an environment where fundamental stock picking and research depth can be a real differentiator.
Small‑ and mid‑cap stocks typically receive less analyst coverage and investor attention than the largest U.S. companies. Among large‑cap stocks, new information is often widely disseminated and quickly reflected in prices. In the less efficiently covered SMID universe, fundamental research can be especially valuable when it helps distinguish temporary earnings recovery from durable improvement in business value.
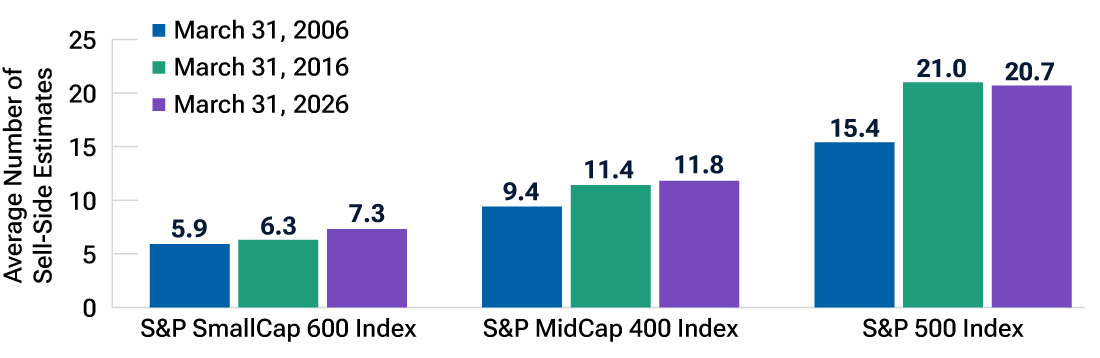
Lower analyst coverage may create information gaps in SMID stocks
(Fig. 3) Average number of sell‑side estimates per S&P index
As of March 31, 2026.
Source: FactSet, analysis by T. Rowe Price. Please see Additional Disclosures for more information.
close
As of March 31, 2026, the S&P 500 Index averaged 20.7 sell‑side analyst estimates per company. By comparison, the S&P SmallCap 600 Index averaged 7.3 estimates and the S&P MidCap 400 Index averaged 11.8. Lower coverage does not guarantee better investment outcomes, but it may create a broader opportunity for skilled active managers to identify mispriced businesses through fundamental research and stock selection. In TMSL, sector specialist research is combined with benchmark-aware portfolio construction so that stock selection—not factor bets—drives results over time.
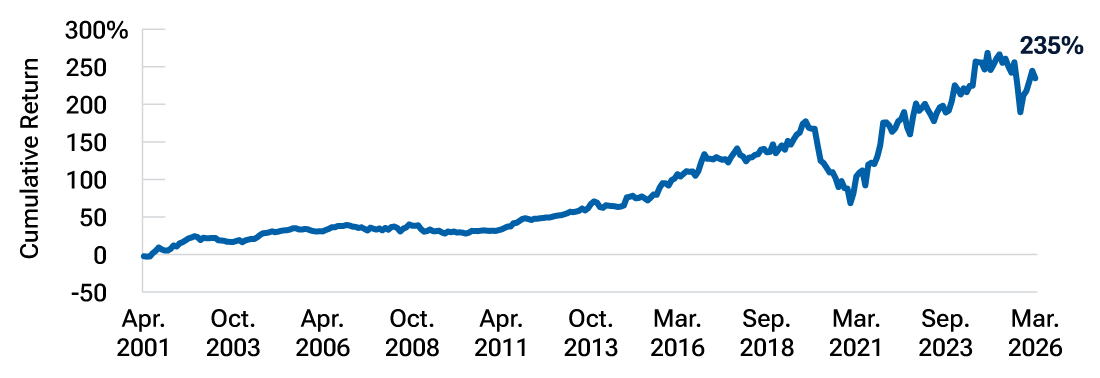
Quality is another reason selectivity matters. As shown in Figure 4, the Russell 2000 Defensive Index has outperformed the Russell 2000 Index over full market cycles, underscoring the importance of focusing on stronger businesses within a highly dispersed opportunity set. This supports a broader point: quality can matter more when fundamentals vary widely across the opportunity set, and active management can help apply that selectivity.
While passive exposure can provide broad access to the SMID universe, it does not distinguish between durable businesses and more speculative companies. In this part of the market, balance sheet strength, cash generation, management execution, and earnings durability can vary widely. In TMSL, we focus on companies with stronger balance sheets, durable earnings power, and better long‑term fundamentals, even if that means being selective within the SMID benchmark.
Higher quality has outperformed over full market cycles
(Fig. 4) Cumulative excess return of Russell 2000 Defensive Index vs. Russell 2000 Index
As of March 31, 2026.
Past performance cannot guarantee future results.
Source: Frank Russell Company, analysis by T. Rowe Price.
close
Built for this market: How T. Rowe Price puts research to work
For investors who want exposure to this part of the market, the question is not only how much small‑ and mid‑cap exposure to own, but how best to access it.
TMSL is an active small‑ and mid‑cap ETF with flexibility across the style spectrum, anchored by a persistent emphasis on quality, improving earnings, and valuation discipline.
The portfolio is built from the bottom up, drawing on T. Rowe Price’s research platform to identify businesses with durable cash flows, high or rising returns on capital, strong margins, and sound balance sheets. The strategy is implemented in a diversified portfolio designed to adapt as fundamentals and market leadership evolve, with the goal of allowing high‑conviction positions to contribute meaningfully to returns.
The strategy is supported by a collaborative co‑portfolio manager structure, centralized portfolio construction, and disciplined risk oversight. Together, these elements help translate specialist research into a diversified, conviction‑driven ETF while keeping the portfolio aligned with its mandate, liquidity profile, and tax‑aware implementation goals.
That process is supported by more than 65 years of SMID investing experience, over $68 billion in SMID assets under management, and more than 1,000 small‑ and mid‑cap company meetings annually.
That research depth is important because the best opportunities in small‑ and mid‑cap stocks are not always obvious. Some may come from companies tied to major long‑term themes that operate outside the most crowded large‑cap names, including artificial intelligence (AI), digital infrastructure, and other areas of long‑term growth.
Within T. Rowe Price’s SMID research universe, many compelling ideas are not headline AI or mega‑cap growth stocks, but enabling businesses one or two layers behind those themes. Rambus, for example, provides semiconductor technology that helps data move faster and more securely inside servers and other computing systems. VIAVI Solutions provides testing and measurement equipment used to help communications networks and optical components operate reliably as AI‑related complexity grows. Vicor makes advanced power systems designed to convert and deliver electricity efficiently inside high‑performance computing equipment, including next‑generation data center systems. These examples illustrate how a research‑driven approach can identify companies connected to enabling technologies behind major long‑term themes, including AI infrastructure.
The point is not that every company tied to a long‑term theme will succeed. It is that a research‑driven approach may be better positioned to identify which businesses are building durable advantages and which ones are simply riding investor momentum. Taken together, the case for SMID exposure depends not only on the opportunity set, but on the ability to be selective within it.
Owning the infrastructure beneath AI: Scalable compute
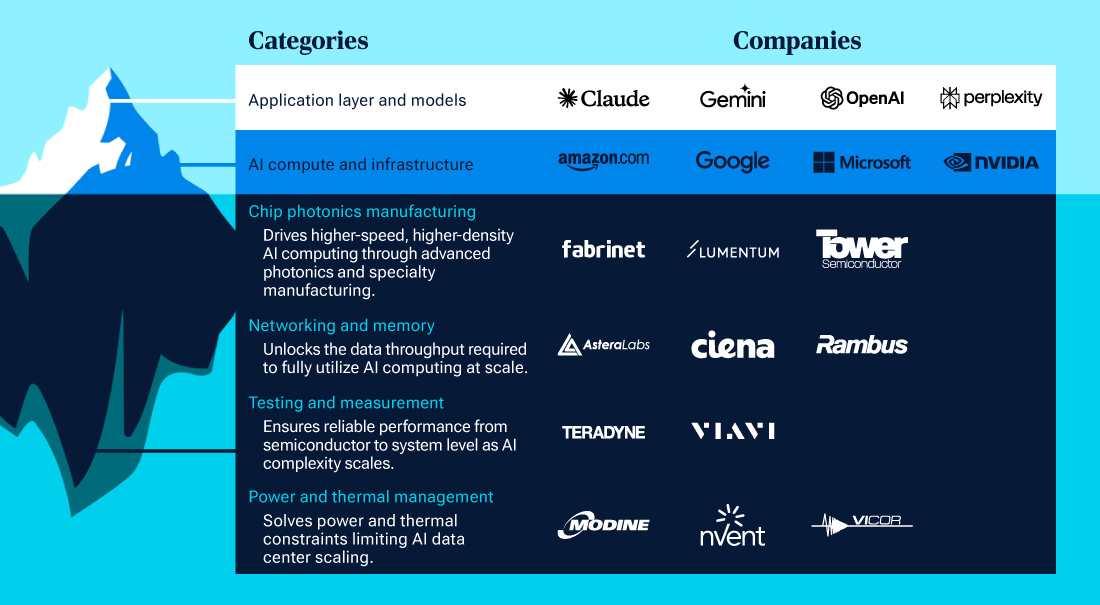
Note: Company logos and securities are shown for illustrative purposes only and do not necessarily represent current or future holdings.
Source: T. Rowe Price.
close
The bottom line: A research‑driven way to access SMID opportunities
After a prolonged period of mega‑cap leadership, investors may want to reassess whether their portfolios have enough exposure to the broader opportunity set in small‑ and mid‑cap stocks. Valuations remain attractive relative to large‑caps, earnings expectations are improving, and market leadership has the potential to broaden. These are the kinds of environments—broadening leadership, improving earnings revisions, and wide quality dispersion—where a research‑driven SMID ETF like TMSL may be well positioned to add value. For investors seeking a disciplined, research‑backed way to access this segment, the T. Rowe Price Small‑Mid Cap ETF may offer active exposure to businesses with durable earnings power, strong fundamentals, and the potential to become future market leaders.
 Jodi Love
Lead Portfolio Manager
Jodi Love
Lead Portfolio Manager
 R. Scott Livingston, CFA
Associate Portfolio Manager
R. Scott Livingston, CFA
Associate Portfolio Manager
 Will Rogers
Associate Portfolio Specialist
Will Rogers
Associate Portfolio Specialist
What's ahead?
Gain valuable perspective on the markets and what’s ahead.
Additional Disclosure
For U.S. investors, visit troweprice.com/glossary for definitions of financial terms.
Please see vendor indices for more information, including definitions and source data: troweprice.com/marketdata.
Important Information
Consider the investment objectives, risks, and charges and expenses carefully before investing. For a prospectus or, if available, a summary prospectus containing this and other information, call 1-800-638-7890 or visit troweprice.com. Read it carefully.
The specific securities identified and described are shown for illustrative purposes only and do not necessarily represent securities purchased or sold by T. Rowe Price. This information is not intended to be a recommendation to take any particular investment action and is subject to change. No assumptions should be made that the securities identified and discussed were or will be profitable.
This material is provided for informational purposes only and is not intended to be investment advice or a recommendation to take any particular investment action.
ETFs are bought and sold at market prices, not NAV. Investors generally incur the cost of the spread between the prices at which shares are bought and sold. Buying and selling shares may result in brokerage commissions, which will reduce returns.
The views contained herein are those of the authors as of June 2026 and are subject to change without notice; these views may differ from those of other T. Rowe Price associates.
All investments are subject to market risk, including the possible loss of principal.
This information is not intended to reflect a current or past recommendation concerning investments, investment strategies, or account types, advice of any kind, or a solicitation of an offer to buy or sell any securities or investment services. The opinions and commentary provided do not take into account the investment objectives or financial situation of any particular investor or class of investor. Please consider your own circumstances before making an investment decision. Active investing may have higher costs than passive investing and may underperform the broad market or passive peers with similar objectives.
Information contained herein is based upon sources we consider to be reliable; we do not, however, guarantee its accuracy.
Small and medium-sized companies often have less experienced management, narrower product lines, more limited financial resources, and less publicly available information than larger companies and may be subject to greater volatility from changes in overall economic conditions, which may cause their securities to be difficult to trade. Past performance is not a guarantee or a reliable indicator of future results. All charts and tables are shown for illustrative purposes only.
T. Rowe Price Investment Services, Inc.
© 2026 T. Rowe Price. All Rights Reserved. T. ROWE PRICE, INVEST WITH CONFIDENCE, the Bighorn Sheep design, and related indicators (see troweprice.com/ip) are trademarks of T. Rowe Price Group, Inc. All other trademarks are the property of their respective owners. Use does not imply endorsement, sponsorship, or affiliation of T. Rowe Price with any of the trademark owners.
- 202606‑5593500