
Resetting expectations for diversification | 2027 Global Market Outlook
November 2026, Multi-Asset
Investors have become accustomed to bonds—and specifically long duration nominal government bonds—typically cushioning the blow when equities fall. For much of the past two decades, that expectation was well founded: Equities generated strong returns, while government bonds also performed well as interest rates declined—and bond prices frequently rallied when equity markets came under pressure.
It was a rewarding combination. It may also have conditioned investors to expect too much diversification from a portfolio composed of stocks and bonds.
Stock‑bond correlations have risen markedly in recent years. That does not necessarily mean diversification is unachievable or undesirable—it may, however, mean investors need to reconsider what they expect each part of a portfolio to deliver.
Take a longer view
Viewed with a long enough lens, today’s environment looks less unusual. For much of the period before the early 2000s, stock‑bond correlations were also positive. Negative correlations subsequently became a defining feature of the post‑global financial crisis (GFC) investment environment, before the relationship reversed again more recently (Figure 1).
Stocks and bonds are moving in tandem
(Fig. 1) The post‑GFC era of negative correlations appears over
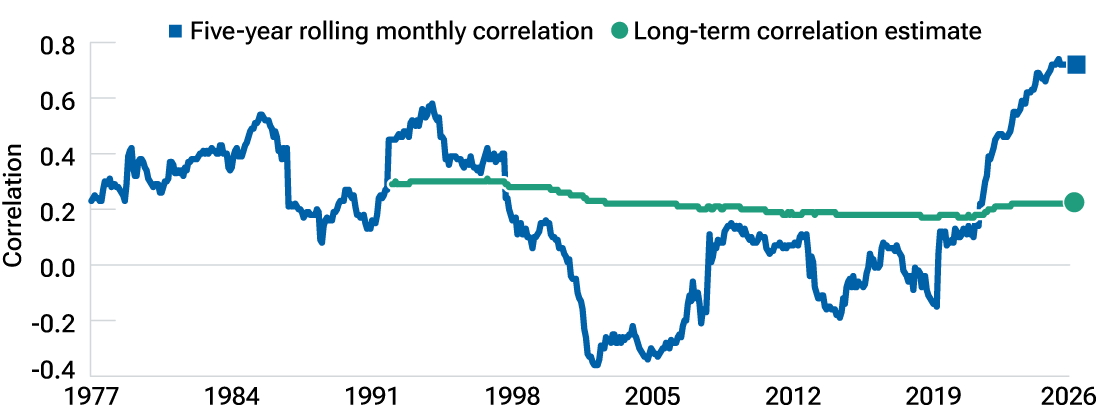
January 1, 1973, through September 30, 2026. Source: 5-year monthly rolling correlation: Bloomberg, MSCI. Analysis by T. Rowe Price. Long-term correlation estimate: Provided by T. Rowe Price.
Long-term correlation estimate: Estimates are subject to numerous assumptions and uncertainties, which change time, and are not actual, historical results. Actual outcomes may differ materially from estimates. For illustrative and comparative purposes only. The estimated correlation is our estimate of the extent to which stock returns and bond returns could move together over the long-term, as informed by historical data. The estimate line shows what our method would have produced as a forward-looking estimate, given the data available up until that time historically. The estimated correlation starts once 20 years of data is available (January 1, 1993). We are recalibrating our forward-looking estimates based on new data monthly, but incorporating using an expanding window, which is why the estimate line is not nearly as volatile as actual historical 5-year rolling correlation shown. Our estimates are slower to change than other more reactive forecasting methods. See Appendix for definitions of financial terms and additional information on the analysis.
5-year monthly rolling correlation: Rolling correlation are historical, based on historical returns and are calculated in excess of a cash proxy. Past performance is not a reliable indicator of future performance. It is not possible to invest directly in an index. See Appendix for indices used to represent global stock and bonds in the analysis.
That longer perspective matters for strategic asset allocation. Our long‑term assumptions incorporate multiple economic and inflation regimes rather than extrapolating the experience of any single period.
For investors with shorter horizons, however, the prevailing regime matters. Stock‑bond correlations partly reflect whether markets are responding primarily to changes in growth or inflation expectations. When growth disappoints, equities can fall while declining interest rates—usually caused by central bank reactions to economic slowdowns—support bond prices. But when rising inflation is the dominant concern, bond yields and equity discount rates can increase together, putting pressure on both asset classes simultaneously.
With U.S. core inflation at 2.6% in September, inflation is near a range that has historically been associated with shifts in the relationship between stock and bond returns. This suggests that relatively modest changes in inflation could influence whether the two asset classes move together or in opposite directions. Investors should therefore be wary both of assuming today’s positive relationship will persist indefinitely and of expecting the strongly negative correlations of the post‑GFC period to return automatically.
Look beyond correlation
There is another danger in focusing simply on correlation: It tells us nothing about the level of returns or the direction of returns investors are experiencing.
Correlations do not change in isolation. The inflation, growth, and interest rate conditions driving them also influence yields, valuations, and prospective returns. Stress‑testing a portfolio by changing the assumed stock‑bond correlation without adjusting expected returns can therefore provide a misleading picture.
This distinction is particularly important today. Nominal bond yields are notably higher than for much of the post‑financial crisis period, improving forward‑looking return potential even as stock‑bond correlations have risen. A reduced diversification benefit does not, by itself, make the investment case for bonds less compelling.
The response should not be to reduce bond allocations automatically when correlations rise. Instead, investors should consider how different fixed income exposures can contribute to portfolio resilience.
Nominal government bonds remain sensitive to growth and interest rates, while inflation‑linked bonds provide explicit inflation compensation (based on a predetermined inflation index). Cash and short duration securities can reprice relatively quickly as conditions change, while credit combines interest rate exposure with sensitivity to economic growth through spreads. Diversifying across these exposures can provide different sources of resilience as the economic regime changes.
Return to diversification’s purpose
The lesson for 2027 is not to abandon traditional diversification, but to reassess what each investment is expected to deliver. Bonds do not necessarily need to rise whenever equities fall to earn their place in a portfolio. The more important task is to combine assets that tend to respond differently to changing economic conditions, reducing dependence on any single economic regime.
Key takeaway
Higher stock‑bond correlations do not mean diversification is unachievable. Investors should focus less on whether stocks and bonds move in opposite directions and more on combining assets with different sources of risk and return.
1 Closed to new investors except for a direct rollover from a retirement plan into a T. Rowe Price IRA invested in this fund.
Market value of holdings shown are illustrative and may differ from the values used to calculate the fund’s net asset value (“NAV”). For information on valuation of portfolio assets used to calculate NAV, please see the prospectus.
ETFs/ETPs are bought and sold at market prices, not NAV. Investors generally incur the cost of the spread between the prices at which shares are bought and sold. Buying and selling shares may result in brokerage commissions which will reduce returns.
202611- 6051971
 Thomas Poullaouec
Head, Global Investment Solutions, International
 Justin Harvey, CFA, ASA
Associate Director of Research, Strategic Asset Allocation
Strategies to Consider

- Nov 2026
Why the price of capital is rising | 2027 Global Market Outlook

- Nov 2026
2027 Global Market Outlook

Contact us
Appendix
Figure 1 Additional Information:
Correlation measures the degree to which two variables move in relation to each other and in this case, applies to global stock and bond returns. A value of 1.0 implies movement in parallel, -1.0 implies movement in opposite directions, and 0.0 implies no relationship. An expanding window is an analysis method in which the observation sample grows over time by adding each new observation while retaining all prior observations.
Long-term correlation estimate: As our methodology prioritizes scalability and numerical stability, our estimates are slower to change than other more reactive forecasting methods. Not representative of an actual investment.
5-year monthly rolling correlation: Indices used: Cash is represented by Bloomberg U.S. Treasury Bills: 1–3 Month Index. Global equity is represented by the MSCI World Net Total Return Index USD Index from January 1973 through December 1987 and the MSCI All-Country World Index USD from January 1988 through September 2026. Global fixed income is represented by the Bloomberg U.S. Treasury Index from January 1973 through December 1975, the Bloomberg U.S. Aggregate Index from January 1976 through December 1989, and the Bloomberg Global Aggregate Index (USD Hedged) from January 1990 through September 2026.
T. Rowe Price cautions that economic estimates and forward-looking statements are subject to numerous assumptions, risks, and uncertainties, which change over time. Actual outcomes could differ materially from those anticipated in estimates and forward-looking statements, and future results could differ materially from any historical performance. The information presented herein is shown for illustrative, informational purposes only. Any historical data used as a basis for this analysis are based on information gathered by T. Rowe Price and from third-party sources and have not been independently verified. Forward-looking statements speak only as of the date they are made, and T. Rowe Price assumes no duty to and does not undertake to update forward-looking statements.
Financial terms: Investors in the U.S. and Canada, for a glossary of financial terms, please go to troweprice.com/glossary.
Investment risks:
Active investing may have higher costs than passive investing and may underperform the broad market or passive peers with similar objectives. Each person’s investing situation and circumstances differ. Investors should take all considerations into account before investing.
International investments can be riskier than U.S. investments due to the adverse effects of currency exchange rates, differences in market structure and liquidity, as well as specific country, regional, and economic developments. The risks of international investing are heightened for investments in emerging market and frontier market countries. Emerging and frontier market countries tend to have economic structures that are less diverse and mature, and political systems that are less stable, than those of developed market countries.
Commodities are subject to increased risks such as higher price volatility and geopolitical and other risks. Commodity prices can be subject to extreme volatility and significant price swings.
Inflation‑linked bonds (Treasury inflation protected securities in the U.S.): In periods of no or low inflation, other types of bonds, such as U.S. Treasury bonds, may perform better than Treasury inflation protected securities (TIPS).
Investing in technology stocks entails specific risks, including the potential for wide variations in performance and usually wide price swings, up and down. Technology companies can be affected by, among other things, intense competition, government regulation, earnings disappointments, dependency on patent protection, and rapid obsolescence of products and services due to technological innovations or changing consumer preferences.
Because of the cyclical nature of natural resource companies, their stock prices and rates of earnings growth may follow an irregular path.
Financial services companies may be hurt when interest rates rise sharply and may be vulnerable to rapidly rising inflation. Health sciences firms are often dependent on government funding and regulation and are vulnerable to product liability lawsuits and competition from low‑cost generic products.
The value approach to investing carries the risk that the market will not recognize a security’s intrinsic value for a long time or that a stock judged to be undervalued may actually be appropriately priced. Growth stocks are subject to the volatility inherent in common stock investing, and their share price may fluctuate more than that of income‑oriented stocks.
Small‑cap stocks have generally been more volatile in price than the large‑cap stocks. Investing in private companies involves greater risk than investing in stocks of established publicly traded companies. Risks include potential loss of capital, illiquidity, less available information, and difficulty in valuating private companies. They are not suitable, nor available, for all investors.
All investments involve risk, including possible loss of principal. Diversification cannot assure a profit or protect against loss in a declining market. Index performance is for illustrative purposes only and is not indicative of any specific investment. Investors cannot invest directly in an index.
Fixed income securities are subject to credit risk, liquidity risk, call risk, and interest rate risk. As interest rates rise, bond prices generally fall. Investments in high yield bonds involve greater risk of price volatility, illiquidity, and default than higher‑rated debt securities. Investments in bank loans may at times become difficult to value and highly illiquid; they are subject to credit risk, such as nonpayment of principal or interest, and risks of bankruptcy and insolvency. Some or all alternative investments, such as private credit, may not be suitable for certain investors.
Investments in private markets are speculative and involve a substantial degree of risk, including the possible loss of all or a substantial portion of an investment. Private market investments may be illiquid, difficult to value and subject to restrictions on transfer, and there may be no readily available secondary market. They may also employ leverage or other investment techniques that can increase the risk of loss. Fees and expenses associated with private market investments may be higher than those of traditional investments and will reduce investment returns. Private market investments may not be suitable for all investors and generally require a long‑term investment horizon and the ability to tolerate limited liquidity and substantial fluctuations in value. Investors should carefully consider their investment objectives, financial circumstances, risk tolerance and the specific risks of an investment before investing.
Important Information
This material is being furnished for informational and/or marketing purposes only and does not constitute an offer, recommendation, advice, or solicitation to sell or buy any security.
Prospective investors should seek independent legal, financial and tax advice before making any investment decision. T. Rowe Price group of companies including T. Rowe Price Associates, Inc. and/or its affiliates receive revenue from T. Rowe Price investment products and services.
Past performance is not a guarantee or a reliable indicator of future results. All investments involve risk, including possible loss of principal.
Information presented has been obtained from sources believed to be reliable, however, we cannot guarantee the accuracy or completeness. The views contained herein are those of the author(s), are as of November 2026, are subject to change, and may differ from the views of other T. Rowe Price Group companies and/or associates. Under no circumstances should the material, in whole or in part, be copied or redistributed without consent from T. Rowe Price.
All charts and tables are shown for illustrative purposes only. Actual future outcomes may differ materially from any estimates or forward‑looking statements provided.
The material is not intended for use by persons in jurisdictions which prohibit or restrict the distribution of the material and in certain countries the material is provided upon specific request.
Issued in the USA by T. Rowe Price Investment Services, Inc., distributor and T. Rowe Price Associates, Inc., investment adviser, 1307 Point Street, Baltimore, MD 21231, which are regulated by the Financial Industry Regulatory Authority and the U.S. Securities and Exchange Commission, respectively.
© 2026 T. Rowe Price. All Rights Reserved. T. Rowe Price, INVEST WITH CONFIDENCE, the Bighorn Sheep design, and related indicators (see troweprice.com/ip) are trademarks of T. Rowe Price Group, Inc. All other trademarks are the property of their respective owners. Use does not imply endorsement, sponsorship, or affiliation of T. Rowe Price with any of the trademark owners.
- 202610‑6005119