
Portfolio Construction Pulse
Pivot Point: Advisors broaden their investment playbooks
Our biannual survey of investment advisor data and insights shows renewed interest in flexible and active mandates in portfolio construction decisions.
As of December 31, 2025
Investors diversified allocations and enhanced flexibility in their portfolio construction decisions in 2025.
Exposure to allocation funds and alternative investments rose while core fixed income and U.S. large-cap blend equity fell. Stock allocations became more diversified, with increases to international value and small- and mid‑caps. Within fixed income, advisors moved toward flexible mandates over core intermediate bonds.
- Highlights
- Portfolio Statistics
- Equities
- Fixed Income
- Alternatives
- ETFs
- Active/Passive
- Model Averages
Advisors broaden their opportunity set

Markets recorded solid results across most asset classes in 2025, rewarding diversification in areas such as international developed and emerging markets equities, as well as fixed income. Small‑ and mid‑cap stocks were the only notable laggards.
T. Rowe Price’s Global Market Outlook highlights opportunities and challenges in 2026 that could inform asset allocation decisions. The artificial intelligence (AI) build‑out continues and is balanced by broadening equity markets that should react positively to fiscal policy catalysts in the U.S. and international markets. On the fixed income side, T. Rowe Price is positioned with lower duration and a favorable view on credit. Capital market concerns include rich valuations for large‑cap stocks, policy and geopolitical uncertainty, and continued deficit spending. Increased corporate bond issuance is also weighing on yields.
The disruptive backdrop favors increased portfolio flexibility and more thoughtful asset allocation. Our latest Pulse data show advisors reducing core portfolio building blocks such as core intermediate bonds and U.S. large‑cap blend equities and increasing the use of flexible mandates. This benefits allocation strategies, alternatives, multi‑sector bonds, and nontraditional bonds. Advisors are diversifying their equity portfolios by moving into international value, as well as small‑ and mid‑caps.
- Key Takeaway
Flexible mandates are in demand, and advisors are gravitating toward differentiated sources of excess return. Increased allocations to alternatives, multi-sector bonds, nontraditional bonds, and allocation funds were funded from core bonds and U.S. large-cap stocks.
Strategies to Consider

Contact us
ETFs grab share, alternatives gain traction
Advisors sought flexibility, greater diversification, and manager alpha in model placements. As a result, allocations to traditional 60/40 portfolio building blocks decreased in moderate-risk models, with large-cap blend equities and core bonds falling 1.5% and 1.3%, respectively. Exposure to moderate allocation funds, multi-sector bonds, and nontraditional bonds increased, as did alternatives such as defined outcome and equity hedged. On the stock side, investors searched abroad in pursuit of return opportunities, with international value increasing 0.6%.
Average allocation: 12-month change
- Key Takeaway
Active, flexible strategies gained share as advisors moved to allocation funds and alternatives while reducing core fixed income.
- Insights
Overcoming market volatility
Our active management approach helped clients power through market volatility—and come out ahead.
Value and breadth make a comeback
Another year of strong equity returns and solid earnings growth for AI beneficiaries compelled investors to broaden their style exposure. The pursuit of AI beneficiaries outside large-cap growth stocks drove overweights to some traditional value sectors, including utilities and industrials. The increased allocations to value came largely at the expense of U.S. large-cap blend, international blend, and international growth.
Financial professional model portfolios: U.S. stocks by market capitalization*
Source: T. Rowe Price Client Investment Platform (CIP) database as of December 31, 2025.
- Key Takeaway
Value stocks gained share, driven by concerns over market concentration risk.
Strategies to Consider
Your investment process. Our expertise.
Refine holdings, build models, adjust portfolios, and inform investment decisions. Put our proven multi-asset expertise to work for your clients.

Fixed income gets flexible
Fixed income has become a difficult area to navigate for many advisors. While the Bloomberg U.S. Aggregate Bond Index enjoyed a solid 7.3% gain through December 31, 2025, concerns around decreasing short-term interest rates, inflation, and growing correlation to equities have led investors to reconsider the composition of their fixed income allocation.
Financial professional model portfolios: Fixed income allocations
Sources: Bloomberg, Morningstar, T. Rowe Price Client Investment Platform (CIP) database as of December 31, 2025.
- Key Takeaway
Advisors leaned into nontraditional sources of excess return in fixed income and significantly reduced their exposure to core funds.
Strategies to Consider
Increased exposure to alternatives pursues a range of benefits
The average advisor allocation to alternatives grew 20% over the past year, increasing from 5.6% to 6.6%. Advisors are using alts in several ways: (1) dampening equity risk, (2) diversifying fixed income, (3) sourcing yield, and (4) overall portfolio diversification. Defined outcome, derivative income, and equity hedged were the top categories for alts usage.
Financial professional model allocations: Alternative allocations
- Key Takeaway
Advisors increased the use of alternatives, either as fixed income replacements or as portfolio risk dampeners.
Strategies to Consider
ETF adoption gets active
Exchange-traded funds continued to gain traction and accounted for 36% of average moderate-risk models. While they are used more frequently within large-cap equity allocations, their use continues to broaden. Active ETF usage grew 44.5% over 2025 and accounted for 34.4% of total ETF allocations. The use of outcome-oriented ETFs within advisor models also increased.
Financial professional model portfolios: Active ETFs
As of December 31, 2025
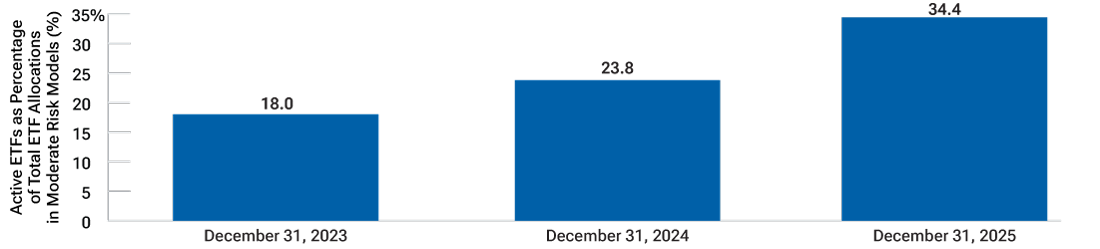
Source: T. Rowe Price Client Investment Platform (CIP) database.
- Key Takeaway
ETF adoption grew in 2025, with active continuing to gain share.
Strategies to Consider
Active allocations increased amid unprecedented disruption
Many portfolio sleeves are dominated by active strategies,* with allocation funds, alternatives, and fixed income showing 84% or greater active share. On the equity side, passive use is highest in U.S. large-cap blend and mid- cap blend. Strategic beta is heavily represented in U.S. value allocations across the market cap spectrum. Active mandates carry high share in international allocations, small-cap, and mid-cap value and growth.
* According to Morningstar. actively managed strategies rely on analytical research, judgment, and experi('flce for investm('flt decisions; passively managed strategies trackan inde,o:: and strateg,C beta strategies track an index with modifications to allow for varying position sizes, the exclusion of securities, or the use of leverage.
Allocation Mix: Active, passive, and strategic beta
- Key Takeaway
Active allocations increased to 73% of advisor strategy allocations. Active usage was particularly high in international, small-cap, and mid-cap growth equities, and it was strong across the board within fixed income.
Strategies to Consider
Number of positions ticks up to 17.4
Advisor models appear broadly diversified both in terms of the number of holdings as well as the inclusion of a wide range of asset classes. The average equity allocation contains 9.7 holdings, while the average fixed income sleeve has 4.7 positions. Alternatives continue to gain traction with 64.2% of models holding an alternative allocation with an average 6.6% allocation.
Advisor allocation distribution
As of December 31, 2025
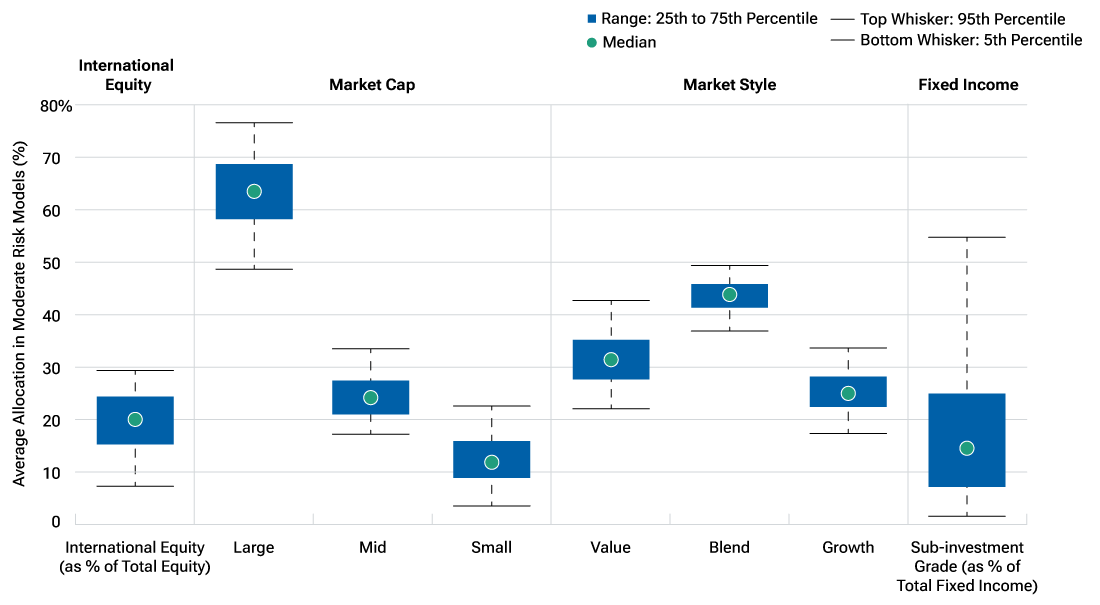
Source: T. Rowe Price Client Investment Platform (CIP) database as of December 31, 2025. Advisor allocation distribution shows look‑through data sourced from Morningstar and calculated by T. Rowe Price.
- Key Takeaway
While the average model is broadly diversified with over 17 holdings, there are several areas that may be overlooked. U.S. small-cap growth, international value, and foreign small- and mid-cap equities see low usage, while global bond U.S. dollar hedged saw relatively low usage in fixed income.
Strategies to Consider
Contact us


Capital Appreciation Fund is closed to new investors except for a direct rollover from a retirement plan into a T. Rowe Price IRA invested in this fund.
Additional Disclosures
Bloomberg Index Services Limited. BLOOMBERG® is a trademark and service mark of Bloomberg Finance L.P. and its affiliates (collectively “Bloomberg”). BARCLAYS® is a trademark and service mark of Barclays Bank Plc (collectively with its affiliates, “Barclays”), used under license. Bloomberg or Bloomberg’s licensors, including Barclays, own all proprietary rights in the Bloomberg Barclays Indices. Neither Bloomberg nor Barclays approves or endorses this material or guarantees the accuracy or completeness of any information herein, or makes any warranty, express or implied, as to the results to be obtained therefrom and, to the maximum extent allowed by law, neither shall have any liability or responsibility for injury or damages arising in connection therewith.
© 2026 Morningstar, Inc. All rights reserved. The information contained herein: (1) is proprietary to Morningstar and/or its content providers; (2) may not be copied or distributed; and (3) is not warranted to be accurate, complete, or timely. Neither Morningstar nor its content providers are responsible for any damages or losses arising from any use of this information. Past performance is no guarantee of future results.
The S&P 500 Index is a product of S&P Dow Jones Indices LLC, a division of S&P Global, or its affiliates (“SPDJI”) and has been licensed for use by T. Rowe Price. Standard & Poor’s® and S&P® are registered trademarks of Standard & Poor’s Financial Services LLC, a division of S&P Global (“S&P”); Dow Jones® is a registered trademark of Dow Jones Trademark Holdings LLC (“Dow Jones”). T. Rowe Price’s products are not sponsored, endorsed, sold or promoted by SPDJI, Dow Jones, S&P, their respective affiliates and none of such parties make any representation regarding the advisability of investing in such product(s) nor do they have any liability for any errors, omissions, or interruptions of the S&P 500 Index.
Important Information
Risk Considerations
All investments are subject to market risk, including the possible loss of principal. Active investing may have higher costs than passive investing and may underperform the broad market or passive peers with similar objectives. Diversification cannot assure a profit or protect against loss in a declining market. Alternative investments are speculative investments that typically involve aggressive investment strategies. In addition, alternative investments may be illiquid, difficult to value, and not subject to the same regulatory requirements as mutual funds. These factors may increase the fund’s liquidity risks and risk of loss.
Mid-caps generally have been more volatile than stocks of large, well-established companies.
Small-cap stocks generally have been more volatile in price than large-cap stocks.
International investments can be riskier than U.S. investments due to the adverse effects of currency exchange rates, differences in market structure and liquidity, as well as specific country, regional, and economic developments. These risks are generally greater for investments in emerging markets.
ETFs are bought and sold at market prices, not net asset value (NAV). Investors generally incur the cost of the spread between the prices at which shares are bought and sold. Buying and selling shares may result in brokerage commissions, which will reduce returns.
Past performance cannot guarantee future results. All investments involve risk. The charts and tables are shown for illustrative purposes only.
This material has been prepared by T. Rowe Price Investment Services, Inc., for informational purposes only. Information and opinions are derived from proprietary and nonproprietary sources deemed to be reliable; the accuracy of those sources is not guaranteed.
Under no circumstances should this material, in whole or in part, be copied, redistributed, or shown to any person without prior consent from T. Rowe Price. This material is not intended to be investment advice or a recommendation to take any particular investment action. This information is not intended to reflect a current or past recommendation concerning investments, investment strategies, or account types; advice of any kind; or a solicitation of an offer to buy or sell any securities or investment services. The opinions and commentary provided do not take into account the investment objectives or financial situation of any particular investor or class of investor. Please consider your own circumstances before making an investment decision.
CFA® and Chartered Financial Analyst® are registered trademarks owned by CFA Institute.
Consider the investment objectives, risks, and charges and expenses carefully before investing. For a prospectus or, if available, a summary prospectus containing this and other information, visit the fund’s website. Read it carefully.
T. Rowe Price Investment Services, Inc., distributor.
© 2026 T. Rowe Price. All Rights Reserved. T. ROWE PRICE, INVEST WITH CONFIDENCE, the Bighorn Sheep design, and related indicators (see troweprice.com/ip) are trademarks of T. Rowe Price Group, Inc. All other trademarks are the property of their respective owners. Use does not imply endorsement, sponsorship, or affiliation of T. Rowe Price with any of the trademark owners.
ID0008727
202602-5246946