


- Asset Allocation Insights
- Tech Stock Valuations Have Become Reasonable
- 2022-07-07 13:39
- Key Insights
-
- Although technology stocks have sold off steeply year‑to‑date, they are still not cheap when compared to the broader market.
- Our Asset Allocation Committee recently added to growth stocks but remains underweight relative to value.
Since the beginning of 2022, stock markets have sold off sharply, with many major indexes recently reaching bear market territory. Notably, technology stocks, in particular, have borne the brunt of the sell-off (Figure 1, left chart).
With many investors wondering if tech stocks have become attractive again, taking a longer‑term perspective could be instructive. An analysis of stock performance during the pandemic era shows that, despite the steep year‑to‑date sell-off, tech stocks have still returned more than twice as much as the broader market (Figure 1, right chart).
Tech Rout Has Been at the Core of the Sell-Off
(Fig. 1) Pandemic-era returns for the tech sector still exceed the broader market
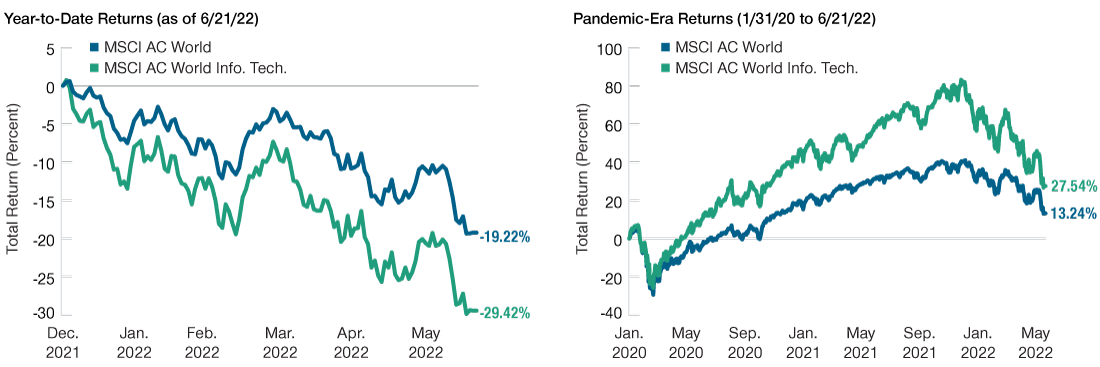
December 31, 2021, to June 21, 2022 (left chart) and January 31, 2020, to June 21, 2022 (right chart).
Past performance is not a reliable indicator of future performance.
Source: MSCI. T. Rowe Price analysis using data from FactSet Research Systems Inc. All rights reserved. See Additional Disclosure.
Have Technology Stocks Become Attractive Again?
(Fig. 2) Sector premium has largely reversed to pre‑pandemic levels but remains elevated
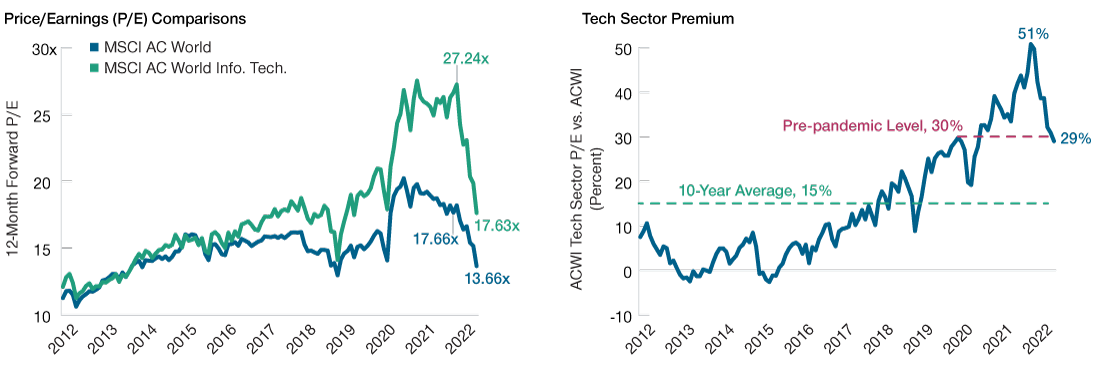
January 2012 to June 2022.
Past performance is not a reliable indicator of future performance.
Source: MSCI. T. Rowe Price analysis using data from FactSet Research Systems Inc. All rights reserved. See Additional Disclosure.
The earnings for many technology companies surged during the pandemic due to the accelerated adoption of many important technology trends—such as cloud computing, online shopping, and streaming video. While tech stocks gained significantly during this period, their outperformance was partially driven by higher earnings rather than entirely by increases in valuations.
This premise can be tested by comparing the price/earnings (P/E) ratio of the tech sector versus the broader market. As shown in Figure 2, valuations for tech stocks and their valuation premium relative to broader equities became extreme during the pandemic—a “pandemic premium” that has mostly been reversed. Still, it is important to note that the valuation premium for the tech sector remains almost double the 10‑year average premium (Figure 2, right chart).
Overall, the rout in technology stocks has helped to remove much of the froth, and valuations have become more reasonable since their peak in November 2021. However, these stocks are still not cheap relative to the broader market. Given our continued caution toward this heavily growth‑oriented sector, our Asset Allocation Committee recently added to growth stocks but remains underweight relative to value.
-
Additional Disclosure
MSCI and its affiliates and third party sources and providers (collectively, “MSCI”) makes no express or implied warranties or representations and shall have no liability whatsoever with respect to any MSCI data contained herein. The MSCI data may not be further redistributed or used as a basis for other indices or any securities or financial products. This report is not approved, reviewed, or produced by MSCI. Historical MSCI data and analysis should not be taken as an indication or guarantee of any future performance analysis, forecast or prediction. None of the MSCI data is intended to constitute investment advice or a recommendation to make (or refrain from making) any kind of investment decision and may not be relied on as such.
Financial data and analytics provider FactSet. Copyright 2022 FactSet. All Rights Reserved.
Important Information
This material is provided for informational purposes only and is not intended to be investment advice or a recommendation to take any particular investment action.
The views contained herein are those of the authors as of July 2022 and are subject to change without notice; these views may differ from those of other T. Rowe Price associates.
This information is not intended to reflect a current or past recommendation concerning investments, investment strategies, or account types, advice of any kind, or a solicitation of an offer to buy or sell any securities or investment services. The opinions and commentary provided do not take into account the investment objectives or financial situation of any particular investor or class of investor. Please consider your own circumstances before making an investment decision.
Information contained herein is based upon sources we consider to be reliable; we do not, however, guarantee its accuracy.
Past performance is not a reliable indicator of future performance. All investments are subject to market risk, including the possible loss of principal. All charts and tables are shown for illustrative purposes only.
T. Rowe Price Investment Services, Inc.
© 2022 T. Rowe Price. All Rights Reserved. T. ROWE PRICE, INVEST WITH CONFIDENCE, and the Bighorn Sheep design are, collectively and/or apart, trademarks of T. Rowe Price Group, Inc.