


- On Central Banks
- Putting the Fed’s Planned Rate Hikes into Context
- History shows that Fed hikes alone tend not to derail markets.
- 2022-02-02 12:08
- Key Insights
-
- The U.S. Federal Reserve has signaled it will begin an interest rate‑hiking cycle in March, prompting concerns about how this will impact financial markets.
- In the past five decades, the U.S. stock and Treasury markets have tended to perform strongly in the 6‑ and 12‑month periods after the start of interest rate‑hike cycles.
- Investors should consider the context of hikes and many other factors, such as the impact of policy on sentiment, when making investment decisions.
The U.S. Federal Reserve (Fed) is the world’s most influential central bank—when it makes major policy decisions, the impact is felt across the globe. It was no surprise, then, that the Fed’s recent announcement that it will begin raising interest rates in March prompted such anxiety among investors about the impact on financial markets.
A History of Fed Rate‑Hiking Cycles
(Fig. 1) There have been 21 cycles since 1974
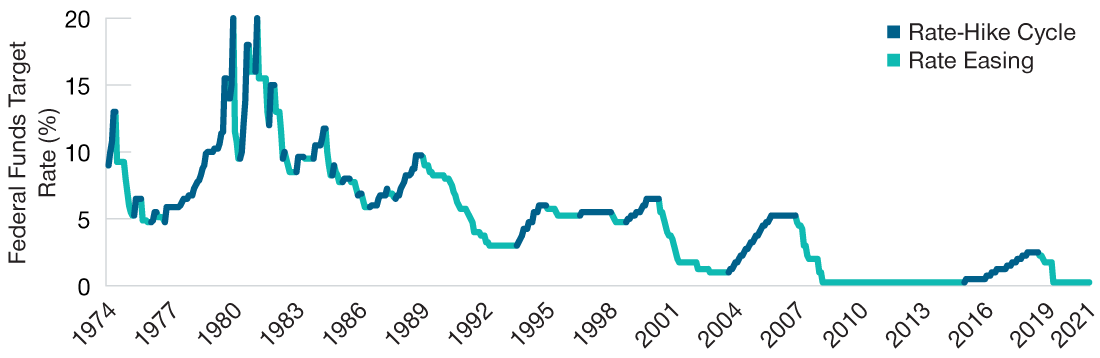
As of December 31, 2021.
Source: Federal Funds Target Rate—Upper Bound (U.S. Federal Reserve), analysis by T. Rowe Price. January 1974 through December 2021.
To assess whether this anxiety is justified, we examined the performance of the U.S. stock market, Treasury market, and the U.S. dollar in the 6‑ and 12‑month periods after the beginning of each Fed hiking cycle since 1974. We chose these time periods because we believe they represent the minimum investment horizons investors—rather than speculators or traders—should consider when making tactical investment decisions. The blue line in Figure 1 shows the 21 rate‑hike cycles over the period.
Our findings were as follows:
1. U.S. Stocks
It turns out that for nearly five decades, the U.S. stock market has tended to perform strongly after the Fed has begun a new hiking cycle. Out of the 21 rate‑hike cycles during the period we examined, the U.S. equity market delivered a positive total return 17 times—an 81% hit rate—in the 12 months after the first hike and 16 times—a 76% hit rate—in the six months after the first hike. Since 1984, the hit rate is 100%, with positive total return during all 11 rate‑hike cycles in the six and 12 months after the first increase in policy rates.1
"...the U.S. stock market has tended to perform strongly after the Fed has begun a new hiking cycle."
— Yoram Lustig, Head of EMEA Multi‑Asset Solutions
This is somewhat counterintuitive. When rates are raised, financial conditions become tighter, the cost of capital and of borrowing increase, and the discount factor used to calculate the present value of future cash flows rises, leading to lower stock prices (all else being equal). However, interest rate cuts tend to occur during periods when the economy is weak and rate hikes are typically made when business activity enjoys an upward trend and inflation is elevated or rising. The beginning of rate‑hike cycles, then, usually coincides with a relatively strong economy, which in turn is supportive of a buoyant equity market—hence the usual strong performance of stocks in the period immediately following the rate hike.
If rate rises continue, however, tighter financial conditions could eventually adversely impact stocks. A visual inspection of Figure 2 shows that rate‑hike cycles tend to start with a strong performance of the stock market over at least the first 12 months—but that performance may turn negative if the cycle is prolonged.
Stocks Have Performed Well Immediately Following First Hikes1
(Fig. 2) Performance may turn negative if the cycle is prolonged, however
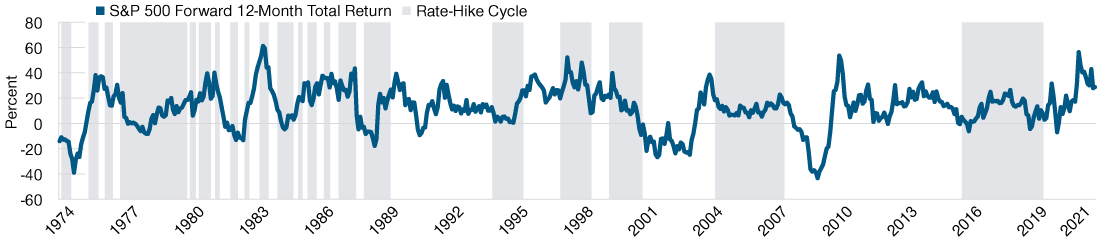
1 Past performance is not a reliable indicator of future performance. Please refer to Appendix: Methodology and Data for additional important information on our study.
As of December 31, 2021.
Sources: Federal Funds Target Rate—Upper Bound (U.S. Federal Reserve), S&P 500, analysis by T. Rowe Price. January 1974 through December 2021.
The gray‑shaded areas represent interest rate‑hike cycles. The blue line is the forward (subsequent)12‑month total return of the S&P 500 Index. Returns are through December 31, 2021. (see Additional Disclosures).
Does this mean we can expect positive stock market performance in the year following the beginning of the next hiking cycle? Here, we must be cautious—context is important. For example, one consideration our analysis does not take account of is the unconventional monetary policy that the Fed has been widely using since the 2008 global financial crisis. Monetary policy levers such as quantitative easing (QE), tapering asset purchase programs and quantitative tightening (QT), forward guidance, and other monetary measures may have taken away some of the impact interest rate changes have on markets or, at a minimum, improved the Fed’s ability to signal forthcoming rate rises to investors.
Another important factor that our analysis does not include is the impact of Fed policy on investor sentiment. Over the past two decades, central banks have provided a sort of backstop to financial markets, known as the “central bank put.” This was encapsulated in 2012 by then‑European Central Bank President Mario Draghi when he said that the bank would do “whatever it takes” to protect the euro. Those three words became a widely used catchphrase that describes the power of central banks to turn around the fortunes of economies and markets.
"...long‑term rates may ease when the Fed hikes, supporting the performance of the Treasury market."
— Michael Walsh, Solutions Strategist
Many investors may have been investing in financial markets with reduced fears over the last 20 years because they believed that asset price downturns would be alleviated by central banks. However, if investors believe that the hands of central banks are now tied because of elevated inflation and that the central bank put has effectively been suspended, sentiment could sour.
The point being: Although the beginning of a Fed rate‑hike cycle does not seem to trigger stock market declines based on past experience, investors need to be mindful of the current context. Other factors, such as the state of the economy, stock market valuations, and investor sentiment, could still cause the stock market to take a turn for the worse.
2. U.S. Treasuries
The U.S. Treasury market tended to deliver positive total returns after the first interest rate hikes in a cycle. Out of the 21 rate‑hike cycles since 1974, the U.S. Treasury market delivered a positive total return 21 times—a 100% hit rate—in the 12 months after the first hike and 18 times— an 86% hit rate—in the six months after the first hike.
This result may be unexpected given the inverse relationship between rate rises and bond prices, but it does make sense. Although short‑term interest rates indeed tended to rise when the Fed is raising its policy rates, longer‑term interest rates mainly reflect three factors: market expectations of future short‑term interest rates, inflation, and economic growth. Because rising policy rates may mean lower inflation levels and slower economic growth in the future, long‑term rates may ease when the Fed hikes, supporting the performance of the Treasury market. Relatively high levels of coupons and yields prevailing for much of the analyzed period also acted as a cushion for Treasury investors.
"Out of the 21 rate‑hike cycles since 1974, the U.S. dollar has appreciated 12 times...."
— Niklas Jeschke, Solutions Analyst
When comparing the relative performance of the U.S. stock markets with the U.S. Treasury markets in the aftermath of a change in Fed policy, the results are more nuanced. Out of the 21 rate‑hike cycles in our study, the U.S. stock market outperformed the Treasury market 15 times—a 71% hit rate—in the 12 months after the first hike and 11 times—a 51% hit rate—in the six months after the first hike. This further highlights the need to consider all factors and the context of the change in policy and to consider using dynamic asset allocation that can adapt to market conditions as the rate‑hike cycle develops.
3. The U.S. Dollar
The U.S. dollar has tended to appreciate against major world currencies over 12‑month periods but depreciate over six‑month periods after a first hike. Out of the 21 rate‑hike cycles since 1974, the U.S. dollar appreciated 12 times—a 57% hit rate—in the 12 months after the first hike and eight times—a 38% hit rate—in the six months after the first hike.
"...investors should consider other ways the Fed influences the economy and investment markets beyond its policy rate...."
— Eva Wu, Solutions Analyst
While rising rates may attract foreign investors, boosting the demand for the currency and its value, a number of interrelated factors affect currency movements. Notably, political and economic stability, and the demand for a country’s goods and services, often have a bigger impact on exchange rates than interest rates. Once again, historical currency fluctuations demonstrate that investors should not make decisions solely based on Fed policy but rather consider other potential drivers of the performance of asset classes and currencies.
A (Cautious) Lesson From History
History tells us that the beginning of a policy rate‑hiking cycle by the Fed does not tend to derail the U.S. stock or bond markets, nor the U.S. dollar. However, while this is good news for investors, it does not amount to a guarantee that those markets will perform well at the beginning of the next Fed hiking cycle. Although Fed rate decisions are very important, investors should consider other ways the Fed influences the economy and investment markets beyond its policy rate, as well as the impact of policy on sentiment and other factors that set the scene for the expected performance of markets.
Appendix: Methodology and Data
In our study, we have examined the end‑of‑month federal funds target rate from January 1974 through December 2021. We define a rate‑hike cycle as the time period between the month of the first hike until the month before the first cut. We calculated the total returns of the U.S. equity market (S&P 500 Index), the U.S. Treasury market (Bloomberg U.S. Treasury Index) and the U.S. dollar index (USDX) during the six and 12 months after the month of the first hike in each rate‑hike cycle. Table 1 includes the results.
Table 1: Data
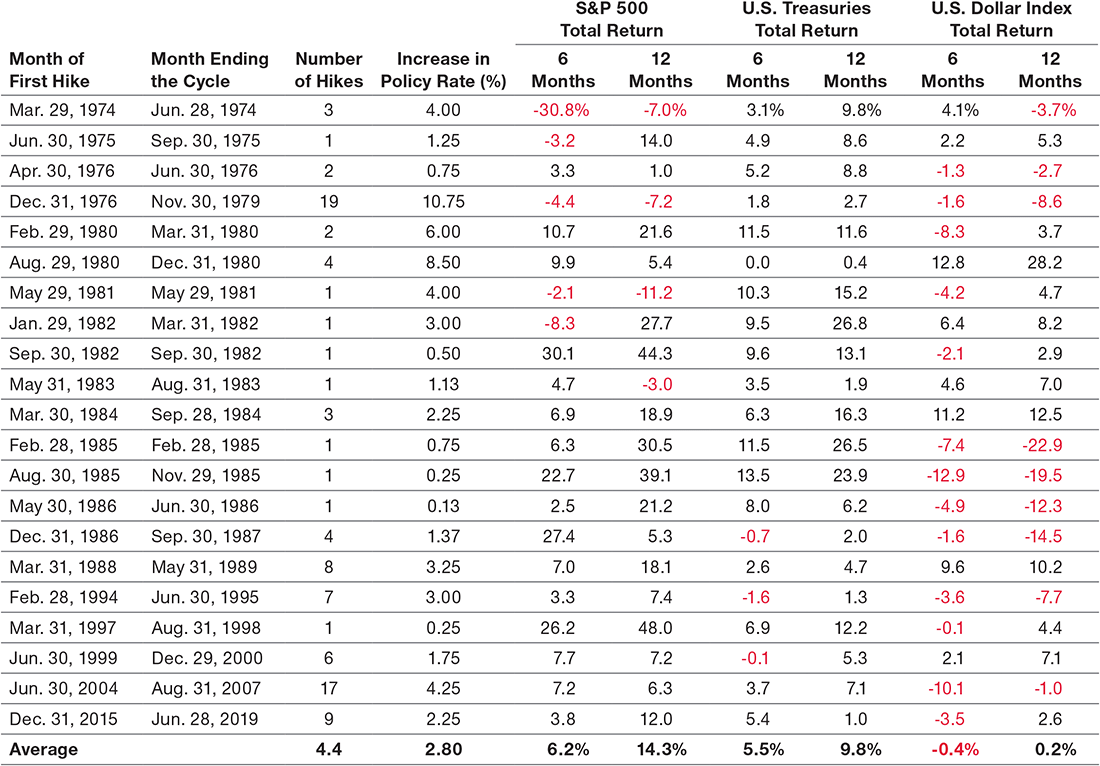
Past performance is not a reliable indicator of future performance.
Sources: Federal Funds Target Rate—Upper Bound (U.S. Federal Reserve), S&P 500 Index, Bloomberg U.S. Treasury Index, U.S. Dollar Index, analysis by T. Rowe Price (see Additional Disclosures). January 1974 through December 2021. Performance is measured in U.S. dollars.
-
Past performance is not a reliable indicator of future performance. Please refer to Appendix: Methodology and Data for additional important information on our study.
-
Additional Disclosures
The S&P 500 is a product of S&P Dow Jones Indices LLC, a division of S&P Global, or its affiliates (“SPDJI”) and has been licensed for use by T. Rowe Price. Standard & Poor’s® and S&P® are registered trademarks of Standard & Poor’s Financial Services LLC, a division of S&P Global (“S&P”); Dow Jones® is a registered trademark of Dow Jones Trademark Holdings LLC (“Dow Jones”). T. Rowe Price is not sponsored, endorsed, sold, or promoted by SPDJI, Dow Jones, S&P, their respective affiliates, and none of such parties make any representation regarding the advisability of investing in such product(s) nor do they have any liability for any errors, omissions, or interruptions of the S&P 500.
“Bloomberg®” and Bloomberg Indices are service marks of Bloomberg Finance L.P. and its affiliates, including Bloomberg Index Services Limited (“BISL”), the administrator of the index (collectively, “Bloomberg”) and have been licensed for use for certain purposes by T. Rowe Price. Bloomberg is not affiliated with T. Rowe Price, and Bloomberg does not approve, endorse, review, or recommend T. Rowe Price products. Bloomberg does not guarantee the timeliness, accurateness, or completeness of any data or information relating to T. Rowe Price products.
ICE Data Indices, LLC (“ICE DATA”), is used with permission. ICE DATA, ITS AFFILIATES AND THEIR RESPECTIVE THIRD-PARTY SUPPLIERS DISCLAIM ANY AND ALL WARRANTIES AND REPRESENTATIONS, EXPRESS AND/OR IMPLIED, INCLUDING ANY WARRANTIES OF MERCHANTABILITY OR FITNESS FOR A PARTICULAR PURPOSE OR USE, INCLUDING THE INDICES, INDEX DATA AND ANY DATA INCLUDED IN, RELATED TO, OR DERIVED THEREFROM. NEITHER ICE DATA, ITS AFFILIATES NOR THEIR RESPECTIVE THIRD-PARTY SUPPLIERS SHALL BE SUBJECT TO ANY DAMAGES OR LIABILITY WITH RESPECT TO THE ADEQUACY, ACCURACY, TIMELINESS OR COMPLETENESS OF THE INDICES OR THE INDEX DATA OR ANY COMPONENT THEREOF, AND THE INDICES AND INDEX DATA AND ALL COMPONENTS THEREOF ARE PROVIDED ON AN “AS IS” BASIS AND YOUR USE IS AT YOUR OWN RISK. ICE DATA, ITS AFFILIATES AND THEIR RESPECTIVE THIRD-PARTY SUPPLIERS DO NOT SPONSOR, ENDORSE, OR RECOMMEND T. ROWE PRICE OR ANY OF ITS PRODUCTS OR SERVICES.
Important Information
This material is provided for informational purposes only and is not intended to be investment advice or a recommendation to take any particular investment action.
The views contained herein are those of the authors as of February 2022 and are subject to change without notice; these views may differ from those of other T. Rowe Price associates.
This information is not intended to reflect a current or past recommendation concerning investments, investment strategies, or account types, advice of any kind, or a solicitation of an offer to buy or sell any securities or investment services. The opinions and commentary provided do not take into account the investment objectives or financial situation of any particular investor or class of investor. Please consider your own circumstances before making an investment decision.
Information contained herein is based upon sources we consider to be reliable; we do not, however, guarantee its accuracy.
Past performance is not a reliable indicator of future performance. All investments are subject to market risk, including the possible loss of principal. All charts and tables are shown for illustrative purposes only.
T. Rowe Price Investment Services, Inc.
© 2022 T. Rowe Price. All Rights Reserved. T. ROWE PRICE, INVEST WITH CONFIDENCE, and the Bighorn Sheep design are, collectively and/or apart, trademarks of T. Rowe Price Group, Inc.