


- On Fixed Income
- EM Currencies Can Boost Bond Portfolios Amid Rising Inflation
- Currencies of commodity‑exporting countries are particularly attractive.
- 2022-01-10 17:36
This year’s inflation surge has had multiple causes: easy monetary policy from central banks, coronavirus‑related supply chain disruptions, tensions with Russia over the Nord Stream 2 gas pipeline, and the ensuing rise in energy prices. Annual consumer price index inflation in the U.S. reached 6.2% in November, which was the highest recorded value in more than 30 years (the previous high was 6.3% in 1990). Similarly, eurozone inflation has been trending up and hit a multi‑decade high of 4.9% in December.
"Struggling growth coupled with persistent inflation demands a creative approach to bond portfolio management."
— Kenneth Orchard, Portfolio Manager
These trends have increased the pressure on central banks to tighten monetary policy, which spells trouble for bond investors. At the same time, coronavirus‑related disruptions and uncertainty caused by inflationary trends spell trouble for economic growth. Struggling growth coupled with persistent inflation demands a creative approach to bond portfolio management.
We have previously identified a few tools that bond investors can consider in this environment, including holding inflation‑linked bonds, positioning farther out the sovereign yield curve (curve flatteners),1 allocating credit across regions, and actively managing duration (or total interest rate risk exposure). Now, we would like to add another: allocating to emerging market (EM) currencies. EM currencies, especially of those countries that export lots of commodities (such as Russia and South Africa), tend to outperform during inflationary periods as they may benefit from rising commodity prices and higher growth potential in emerging markets.
"...resource‑exporting EM currencies can improve bond portfolio returns during inflationary periods..."
— Onur Uncu, Quantitative Analyst
Figure 1 shows historical returns of EM currencies during months with rising/falling U.S. inflation expectations and rising/falling U.S. real rates (a key barometer of U.S. economic growth expectations). EM currencies, particularly those of resource‑exporting countries, provided the highest returns during periods with rising inflation expectations and falling real rates (falling U.S. growth expectations). However, they also performed well during periods with rising inflation expectations and rising real rates. This suggests that resource‑exporting EM currencies can improve bond portfolio returns during inflationary periods irrespective of whether real rates are falling or rising.
EM Currencies Have Typically Performed Well in Inflationary Periods
(Fig. 1) How EM currencies performed between January 1, 2000, and November 30, 2021
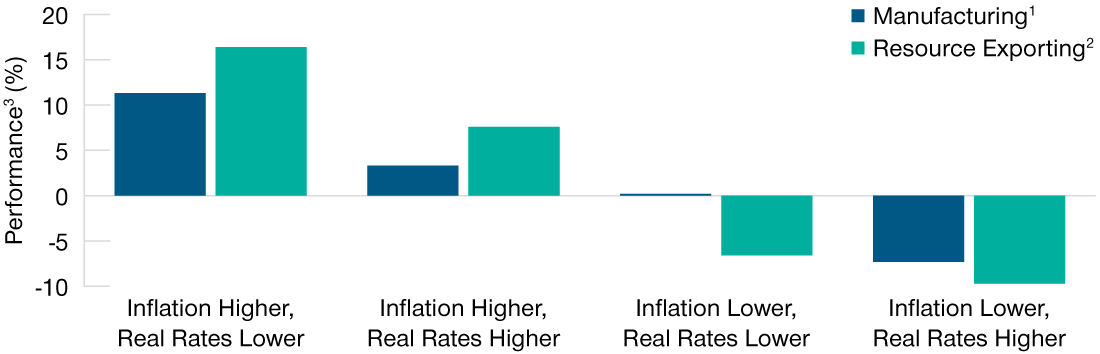
As of November 30, 2021.
Past performance is not a reliable indicator of future performance.
1 Manufacturing represents a basket of six EM countries whose economies include a large contribution from manufacturing activity: China, Poland, Hungary, Indonesia, Malaysia and Thailand.
2 Resource Exporting represents a basket of countries whose economies include a large contribution from resource exports: China, Poland, Hungary, Indonesia, Malaysia and Thailand. Real rates are the rates of U.S. 10-year inflation protected bonds (TIPS). Inflation expectations are the U.S. 10-year break-even rate, which is defined as the difference between U.S. 10-year nominal bond yield and U.S. 10-year TIPS yield. The results for each scenario were calculated by examining monthly changes in real rates and break-even rates in all countries covered over the period. We then bucketed the results into the four scenarios shown.
3 To illustrate how returns were annualized, let’s assume we have three months of monthly returns: 5%, 10%, -8%. We first compound these returns as: 1.05 * 1.1 * 0.92 = 1.0626. This figure represents the compound return of those three months. We then annualize this as: 1.0626 ^(12/3) = 1.2749, which represents an annualized return of 27.49%.
Source: Bloomberg Finance L.P. Analysis by T. Rowe Price.
Figure 2 shows the returns of EM currencies during the period since the onset of Coronavirus—a much smaller, but more recent, sample. It reveals that EM currencies performed their role well during periods with rising inflation expectations and falling growth, which spanned about half the post‑coronavirus period.
Crucially, however, it also shows that EMs did not perform as well during inflationary periods with rising real rates. This was likely a reflection of the market’s recent fears around the U.S. Federal Reserve ending the quantitative easing program and starting to hike interest rates, which, if overdone, could cause market‑wide disruptions. However, history suggests that these fears were probably overblown and do not reflect the fundamental advantage of resource‑exporting emerging markets in an inflationary environment.
One final point: Never lose sight of thoughtful portfolio construction. EM currencies tend to behave like “risk on” assets and suffer in a sharp risk‑off environment along with credit. As such, we believe they should be treated as a substitute for credit risk in portfolios—not an enhancement.
Post‑COVID Onset, Rising Real Rates Hampered EM Currency Performance
(Fig. 2) How EM currencies performed between May 1, 2020, and November 30, 2021
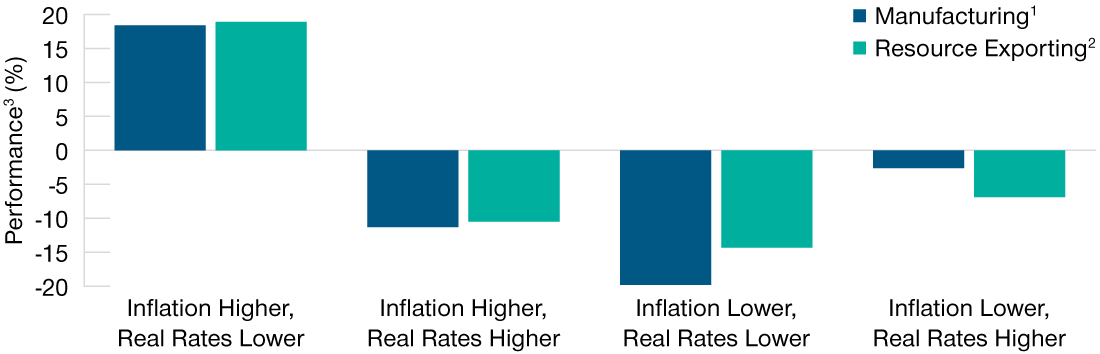
As of November 30, 2021.
Past performance is not a reliable indicator of future performance.
1 See footnote 1 in Fig. 1.
2 See footnote 2 in Fig. 1.
3 See footnote 3 in Fig. 1.
Source: Bloomberg Finance L.P. Analysis by T. Rowe Price.
-
1 A strategy that uses derivatives with the aim of benefiting from shifts in the yield curve.
-
Important Information
This material is provided for informational purposes only and is not intended to be investment advice or a recommendation to take any particular investment action.
The views contained herein are those of the authors as of January 2022 and are subject to change without notice; these views may differ from those of other T. Rowe Price associates.
This information is not intended to reflect a current or past recommendation concerning investments, investment strategies, or account types, advice of any kind, or a solicitation of an offer to buy or sell any securities or investment services. The opinions and commentary provided do not take into account the investment objectives or financial situation of any particular investor or class of investor. Please consider your own circumstances before making an investment decision.
Information contained herein is based upon sources we consider to be reliable; we do not, however, guarantee its accuracy. Actual future outcomes may differ materially from any forward‑looking statements made.
Past performance is not a reliable indicator of future performance. All investments are subject to market risk, including the possible loss of principal. International investments can be riskier than U.S. investments due to the adverse effects of currency exchange rates, differences in market structure and liquidity, as well as specific country, regional, and economic developments. The risks of international investing are heightened for investments in emerging market and frontier market countries. Emerging and frontier market countries tend to have economic structures that are less diverse and mature, and political systems that are less stable, than those of developed market countries. Fixed‑income securities are subject to credit risk, liquidity risk, call risk, and interest‑rate risk. As interest rates rise, bond prices generally fall. Derivatives may be riskier or more volatile than other types of investments because they are generally more sensitive to changes in market or economic conditions; risks include currency risk, leverage risk, liquidity risk, index risk, pricing risk, and counterparty risk. All charts and tables are shown for illustrative purposes only.
T. Rowe Price Investment Services, Inc.
© 2022 T. Rowe Price. All Rights Reserved. T. ROWE PRICE, INVEST WITH CONFIDENCE, and the Bighorn Sheep design are, collectively and/or apart, trademarks of T. Rowe Price Group, Inc.