

European High Yield
Recent performance in high yield – it’s not all about oil this time.
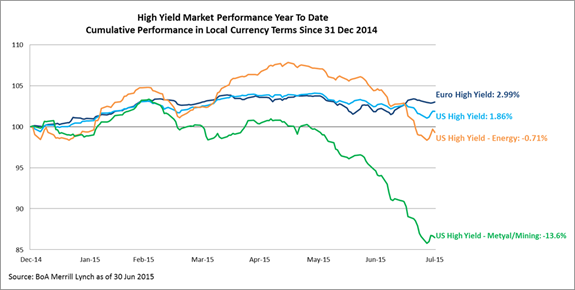
The thawing of Greek concerns helped the European high yield bond market generate positive returns in July. Spreads tightened, inflows returned, and an abundance of new bonds were issued in the primary market. What’s more, for the first time since March, European high yield bonds outperformed their U.S. counterpart, which generated negative returns over the period. Why the divergence?
The sell-off in oil prices during July certainly didn’t help. In U.S. high yield, energy is the index’s largest sector weighting, making up almost 14%1. This exposure makes it more vulnerable to moves in oil prices than European high yield, because energy issuers constitute just 5%2 of the benchmark here. In another divergence, the U.S. share is made up of lots of smaller energy companies which tend to have lower ratings, while Europe comprises of large ‘fallen angels’ names such as Gazprom and Petrobras, which have dropped down from the investment-grade universe into the junk bracket.
Cast your mind back to the second half of 2014 and you will remember that the precipitous drop in oil prices during that period lead to significant underperformance of U.S. high yield relative to Europe. This time though, it’s about more than just the downturn in oil. The metal and mining segment of the U.S. index generated an absolute return of -8.6%3 in July. This was driven by the sharp decline in metal prices, such as copper, which plunged to a six-year low during the month on concerns about China’s demand slowing. Once again, the U.S. high yield market has a bigger weighting of metal and mining companies (excluding steel), which take up around 3%1 of the index compared with Europe’s 0.44%2.
These weighting disparities resulted in less volatility in Europe during July, which helped outperformance versus the U.S. Can this trend continue? That depends on how long this downturn in commodities and oil prices lasts.
On our side, we continue to focus on bottom-up credit research where we can find the best opportunities to add value for our clients but also where we get some protection against external shocks. With the consequences of a weaker China unknown however, investors should prepare for more turbulent markets and given the composition of European high yield, it may not be a bad place to invest.
Figure 1
1 BofA Merrill Lynch US High Yield Index
2 BofA Merrill Lynch Euro High Yield Index
3 BofA Merrill Lynch US High Yield Metals & Mining Index
2015-GL-2376
重要情報
当資料は、ティー・ロウ・プライス・アソシエイツ・インクおよびその関係会社が情報提供等の目的で作成したものを、ティー・ロウ・プライス・ジャパン株式会社が翻訳したものであり、特定の運用商品を勧誘するものではありません。また、金融商品取引法に基づく開示書類ではありません。当資料における見解等は資料作成時点のものであり、将来事前の連絡なしに変更されることがあります。当資料はティー・ロウ・プライスの書面による同意のない限り他に転載することはできません。
資料内に記載されている個別銘柄につき、売買を推奨するものでも、将来の価格の上昇または下落を示唆するものでもありません。また、当社ファンド等における保有・非保有および将来の組入れまたは売却を示唆・保証するものでもありません。投資一任契約は、値動きのある有価証券等(外貨建て資産には為替変動リスクもあります)を投資対象としているため、お客様の資産が当初の投資元本を割り込み損失が生じることがあります。
当社の運用戦略では時価資産残高に対し、一定の金額までを区切りとして最高1.265%(消費税10%込み)の逓減的報酬料率を適用いたします。また、運用報酬の他に、組入有価証券の売買委託手数料等の費用も発生しますが、運用内容等によって変動しますので、事前に上限額または合計額を表示できません。詳しくは契約締結前交付書面をご覧ください。
「T. ROWE PRICE, INVEST WITH CONFIDENCE」および大角羊のデザインは、ティー・ロウ・プライス・グループ、インクの商標または登録商標です。
ティー・ロウ・プライス・ジャパン株式会社
金融商品取引業者関東財務局長(金商)第3043号
加入協会:一般社団法人日本投資顧問業協会/一般社団法人投資信託協会
