

Asian Diary – July 2015
No sign yet of the quiet summer months in Asian markets. The MSCI AC Asia ex Japan index fell -6.3% in USD terms, lagging the AC World Index1, which finished up 0.9%, by 7.2% in a single month. Broader EM fell even more sharply (-6.9%2). China and the spectre of US Fed hikes weighed on sentiment, and currencies across the region declined on average -1.5% vs the USD3.
Within the region, only India produced a positive return (1.8%4) supported by sharply falling oil prices and strong performance from IT companies. North Asia was the source of most weakness with Korea (-8.0%5) and Taiwan (-7.0%6) falling on declining share prices in the tech sector. And of course China was the source of most pain with the MSCI China Index down -10.8% and the onshore A-share market down -14.4%7.
The weakness seen in Chinese equities through June turned into a rout in July with several days of rapid decline being interspersed by periods of stability as the government sought to intervene and provide support. The People’s Bank of China (PBoC) is actively providing the ‘national team’ of banks and brokerages with liquidity to support the market. Just how long this can be maintained is yet to be seen. In the meantime, global investors remain wary of the levels of intervention in the A-share market, which has led to reduced transparency and price discovery. China’ fear’ has spilled over into the offshore market with Hong Kong listed China shares also falling.
China continues to dominate discussion amongst the team and has been a major source of questions from clients. Clients seem concerned about a couple of key issues. One is how much exposure to mainland shares we have in our portfolios, as this is where the greatest volatility, suspensions and government intervention has been. The second is what knock-on impact the stock market decline might have on economic growth in China.
In response to the first question, clearly this varies by strategy/PM. But essentially the answer is very little. We have accessed mainland shares in a very limited way through QFII quota since 2009, but the restrictions on capital repatriation that come along with QFII have always prevented us from asking for more quota. We can also invest in mainland listed B-shares, which are only available to foreign investors and tend to be thinly traded. Additionally, in recent months we have gained access via Stock Connect. Our range of pooled funds can now use this channel, but with all of the volatility in the A-share market few funds have made much use of it so far. The vast majority of our China holdings are therefore in HK-listed China companies (H-shares, P-chips, Red Chips) and in US-listed ADRs. Undoubtedly correlations between onshore and offshore Chinese equities have risen in recent years, but offshore is subject to greater transparency, less retail trading behaviour and therefore tends to be less volatile. MSCI China is now trading back close to its average P/E of recent years.
Fig 1: MSCI China Valuations
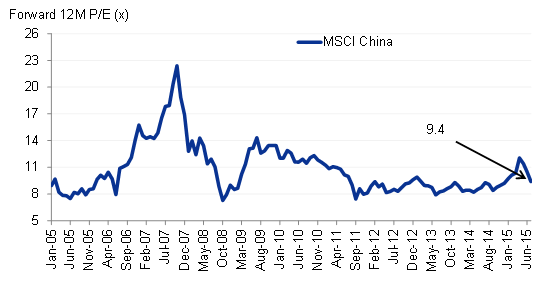
Source: Factset, as at 31 July 2015.
On the second point, the answer is that it is probably too early to tell. However, we anticipate the knock-on impacts to be relatively modest. There will likely be a short-term, direct hit to headline GDP growth when the Q3 data is released in October. The financial sector contributed around 0.5% to GDP growth of 7% in Q1 and Q28, and this is likely to be missing in Q3. It is possible that other GDP drivers somehow make up this shortfall.
And what about consumption? Again, we expect modest flow through. Data suggests that Chinese households have somewhat limited equity holdings (see Figure 2, below) and that this wealth is heavily concentrated into larger trading accounts/wealthier individuals (see Figure 3). Broadly speaking, Chinese households are very ‘liquid’ with a lot of cash on deposit. The direction of house prices, which is picking up in tier 1 cities, and wage growth are likely to remain bigger drivers of consumer patterns than the stock market. That being said, when you’re looking at your trading account on your smartphone and the screen is showing a lot of red, it’s unlikely to inspire you to rush out and buy a new car or book a holiday. Some major purchases may be pushed back a little. Overall however, our base case scenario of a gradually slowing economy in China over the next several years, as policymakers focus on rebalancing away from fixed asset investment as a means to improve the quality of growth, remains unchanged.
Fig 2: China household financial and property wealth - 2014
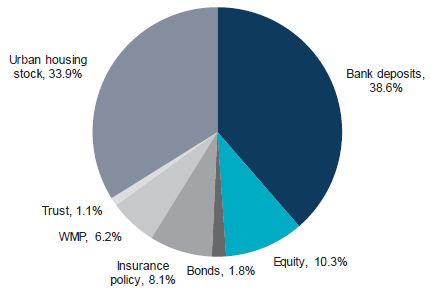
Source: CEIC, WIND, UBS
Fig 3: Cumulative share of the value of equity holdings (%)
As at 30 June 2015
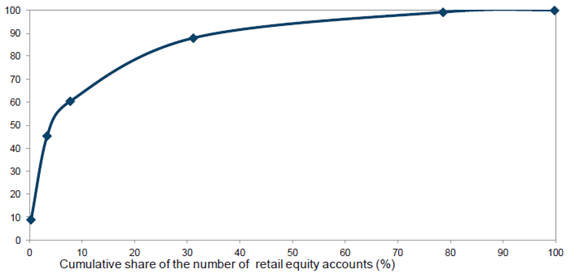
Source: WIND, Goldman Sachs
Industry data shows that Asian and Emerging Markets equities funds continue to see outflows YTD, with ‘China Fear’ one of the key drivers behind this. This is adding to downward pressure on some of our preferred names. In China, for example, we are starting to find attractive value again in some of our favourite names. We remain much more constructive about the outlook for the region than these flows would suggest.
As usual, plenty of travel from team members this month. There were trips to Taiwan to look at automation and tech components, India to visit auto manufacturers and small/mid cap stocks, and to Malaysia. Malaysia has been the second worst performing market in Asia YTD. Having been hit hard by falling commodity prices (which made up 22% of exports in 20149) the country has been further damaged by a major political corruption scandal, with Prime Minister Najib accused of receiving money from 1MDB, the government-owned development company, into his personal bank accounts. Our visit suggests he is likely to survive the current scandal, but there is now huge pressure on Najib to rein in corruption, which is rife throughout public life in Malaysia. Malaysia has many things going for it with a current account surplus, potential for reform, and a young population. As always when we visit however, we found the stock opportunity set to be short of high quality growth companies, and unfortunately did not come back with any new ideas this time.
1 MSCI AC World Index in USD
2 MSCI Emerging Markets Index in USD
3 Source: FactSet
4 MSCI India Index in USD
5 MSCI Korea Index in USD
6 MSCI Taiwan Index in USD
7 Shanghai Stock Exchange Composite Index. Source: FactSet
8 Source: CEIC
9 Source: Malaysian Institute of Economic Research
2015-GL-2375
重要情報
当資料は、ティー・ロウ・プライス・アソシエイツ・インクおよびその関係会社が情報提供等の目的で作成したものを、ティー・ロウ・プライス・ジャパン株式会社が翻訳したものであり、特定の運用商品を勧誘するものではありません。また、金融商品取引法に基づく開示書類ではありません。当資料における見解等は資料作成時点のものであり、将来事前の連絡なしに変更されることがあります。当資料はティー・ロウ・プライスの書面による同意のない限り他に転載することはできません。
資料内に記載されている個別銘柄につき、売買を推奨するものでも、将来の価格の上昇または下落を示唆するものでもありません。また、当社ファンド等における保有・非保有および将来の組入れまたは売却を示唆・保証するものでもありません。投資一任契約は、値動きのある有価証券等(外貨建て資産には為替変動リスクもあります)を投資対象としているため、お客様の資産が当初の投資元本を割り込み損失が生じることがあります。
当社の運用戦略では時価資産残高に対し、一定の金額までを区切りとして最高1.265%(消費税10%込み)の逓減的報酬料率を適用いたします。また、運用報酬の他に、組入有価証券の売買委託手数料等の費用も発生しますが、運用内容等によって変動しますので、事前に上限額または合計額を表示できません。詳しくは契約締結前交付書面をご覧ください。
「T. ROWE PRICE, INVEST WITH CONFIDENCE」および大角羊のデザインは、ティー・ロウ・プライス・グループ、インクの商標または登録商標です。
ティー・ロウ・プライス・ジャパン株式会社
金融商品取引業者関東財務局長(金商)第3043号
加入協会:一般社団法人日本投資顧問業協会/一般社団法人投資信託協会
