- From the Field
- An anatomy of tariffs: History, theory, and prognosis
- Lessons for navigating an era with higher trade barriers.
- 2025-06-12 08:55
- Key Insights
-
- The contest between free trade and protectionism has persisted for the past two centuries. The post‑World War II era of low tariffs now appears to be ending.
- Tariffs create winners and losers. For small economies, they are a deadweight loss; for larger countries, “optimal” tariffs may produce economic benefits.
- Although tariffs have not historically had a major impact on asset class returns, they may create both shorter‑term risks and opportunities for investors to consider.
Donald Trump’s tariff war is the latest stage in a longstanding battle between two rival economic philosophies: protectionism and free trade. Over three centuries of documented trade, the pendulum has swung between the two, driven by economic theory, political persuasion, and a nation’s stage of development.
While trade barriers can also come in the form of quotas, embargoes, and regulations, tariffs have historically been the go‑to instruments for modulating trade flows. Over time, tariffs have come in and out of vogue and have varied in level, duration, mode of implementation, and specificity. Below, we discuss the history and theory of tariffs before considering their implications in the current environment.
The history
The early days of U.S. tariffs
The history of tariffs colors the economic history of 19th and early 20th century America. It erupted with the Tariff Act of 1828, which was intended to protect the infant manufacturing industries of New England and the Northeastern states, particularly textiles and steel, from cheap British imports. The bill was denounced as the “Tariff of Abominations” by its Southern opponents because they believed it raised input costs and stunted export markets for agricultural businesses in the South. Several states threatened secession from the Union, and these conflicting economic agendas became a contributory factor in the U.S. Civil War.
The post‑World War II era saw a trade boom
(Fig. 1) World trade volumes over time
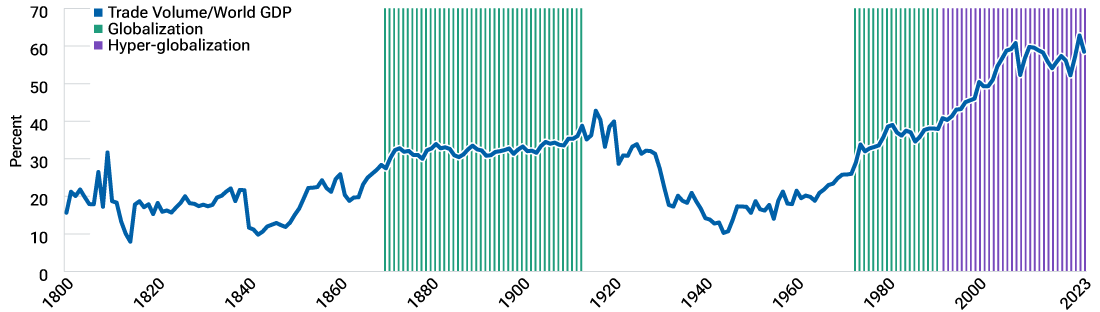
As of December 2023.
Sources: Federico and Tena‑Junguito (Centre for Economic and Policy Research, 2016); Jorda, Schularick, and Taylor (National Bureau of Economic Research, 2017); World Bank; and T. Rowe Price.
In the decades following the Civil War, the pendulum swung toward an orthodoxy of high tariffs. Industrialists and politicians closed ranks in support of protectionism, convinced that sheltering American factories was the path to prosperity. This post‑war consensus was repeatedly cemented into law: The McKinley Tariff of 1890 pushed tariff rates close to 50%; the Dingley Tariff of 1897 pushed duties even further, to more than 50%. Tariffs were cast as patriotic. The logic was simple: By keeping out cheap foreign imports, American capital and labor could prosper. It echoed Abraham Lincoln’s economic maxim: “Give us a protective tariff, and we will have the greatest nation on Earth.”
Indeed, this period of high tariffs was a gilded age for the U.S. economy. Output boomed, the economy expanded west, and the nation was crisscrossed by railways built with American‑manufactured steel. Innovations such as electric lights and agricultural equipment drove productivity increases, and the U.S. eclipsed Britain as the world’s largest industrial economy.
Context is important here, however. As an emerging power, the U.S. lacked the scale to compete with the incumbent European industrial powers, which needed to be handicapped for the U.S. to grow. In other words, tariffs were a useful tool at a very particular stage of the U.S.’s development. It was also an era in which much of the U.S.’s economic growth was fueled by its westward geographic expansion. Crucially, in a pre‑income tax world in which the government share of gross domestic product (GDP) could be measured in single digits, tariffs provided more than half of U.S. Treasury revenues.
“By the early 1900s, there was growing recognition that extremely high tariffs had serious downsides.”
Justin Thomson, Head of the T. Rowe Price Investment Institute
By the early 1900s, there was growing recognition that extremely high tariffs had serious downsides. In 1913, the Underwood Tariff, which reduced average duties from 40% to 26%, was paired with the Revenue Act, which introduced a permanent income tax of between 1% to 7% for individuals and a flat 1% for corporations. With a permanent income tax as a source of revenue, tariffs became less politicized.
Tariffs and the Great Depression
History seldom moves in straight lines, however. World War I, the Roaring Twenties, and the Great Depression would alter the trade policy landscape once again. Calls for protection would resurface, culminating in the most infamous tariff act of all—The Smoot‑Hawley Tariff of 1930, which raised U.S. tariffs to previously unseen levels and sparked retaliation from the country’s trading partners. While the causes of the Great Depression are multiple and complicated, Smoot‑Hawley was a significant contributing factor.
The reaction of other nations was equally important. The retaliatory tariffs that followed created what is often referred to as “Kindleberger’s death spiral”—a prolonged and persistent period of deglobalization. This offers a cautionary tale of economic nationalism gone awry, the key lesson of which is that in an escalatory trade war, everyone ultimately loses.
In the years that followed, successive U.S. administrations reduced tariffs and promoted free trade. This trend began with President Franklin Roosevelt’s Reciprocal Trade Agreement of 1934, which allowed the president to negotiate bilateral tariff reductions with other countries on a reciprocal basis and began the process of reducing global protectionism (Figure 1). The deal originally was set to expire after three years but was extended under several U.S. administrations until 1962, at which point President Kennedy’s Trade Expansion Act gave the president the authority to cut tariffs by up to 50% as a result of reciprocal trade negotiations.
Over time, these dynamics led to a gradual reduction of tariffs and the eventual establishment of the World Trade Organization (WTO), which serves as the current trade dispute resolution mechanism for its member countries. Throughout this era, the global policy mantra was that international trade not only helped to spread wealth to developing economies, but it also promoted geopolitical stability because free‑trading democracies typically do not go to war with each other. The U.S. commitment to that fueled a large rise in free trade agreements, both at the global level through the WTO and at the local level through the establishment first of the European Common Market and then the European Union.
The theory
Free trade creates both winners and losers
That free trade leads to global welfare improvement is a lesson from Economics 101. The reality is more complicated, however. Although free trade does lead to global welfare improvement, the gains are not always distributed evenly, as economists Eli Heckscher and Bertil Ohlin demonstrated in their Nobel prize‑winning work in the 1930s.
“Although free trade does lead to global welfare improvement, the gains are not always distributed evenly....”
Tomasz Wieladek, Chief European Economist
In Heckscher’s and Ohlin’s two‑country model, the advanced economy has abundant capital‑intensive production, but labor‑intensive production is scarce. In the developing country, it is the other way around: Labor‑intensive production is abundant, while capital‑intensive production is scarce. As a result of free trade, labor‑intensive production in the advanced economy becomes less scarce, so the wages of workers in this sector decline. Meanwhile, the wages of workers in the capital‑intensive sector rise as this form of production becomes relatively more scarce.
Even this simple theory predicts a rise in income inequality in the advanced economy as a result of free trade. In the developing country, on the other hand, income inequality should decline. This simple framework can explain several important facts of international trade of the last couple of decades:
- The lifting of billions of people in the emerging markets out of poverty,
- the erosion of labor‑intensive manufacturing in the developed economies, and
- the rise in income inequality in advanced economies.
Globalization increases the size of the economic pie, but these gains need to be redistributed for everyone to be better off individually. However, implementing a redistribution scheme aimed only at the losers from globalization is challenging. National differences in the scale and generosity of the social safety net mean that U.S. workers have been relatively more affected by free trade than their counterparts in European countries. U.S. workers in sectors adversely affected by trade globalization therefore have tended to support policies that would hold globalization back.
Indeed, whenever U.S. trade partners have significantly outperformed certain U.S. sectors, there has been a political backlash. This trend started with President Nixon, who decoupled the U.S. dollar (USD) from gold and raised tariffs by 10% to keep U.S. products competitive. It continued with President Reagan, who negotiated voluntary export restrictions with Japan, which eventually resulted in the relocation of some Japanese car plants to the U.S.
President Trump’s policies are just the latest iteration of this political backlash. China’s admission to the WTO, and its rapid integration into the world economy, probably caused the largest adverse shocks of all to the U.S. manufacturing sector, accelerating deindustrialization in many U.S. states. As a result, the political backlash has been much greater than in previous decades. Trump’s trade policies are a reflection of the politics of rage in response to the impact of hyper‑globalization on U.S. manufacturing.
Globalization cycles and their impact
The long‑term effects of globalization are clear: By allowing countries to specialize in what they do well, the size of the economic pie grows. Globalization also helps to smooth out the sharper edges of the business cycle by enabling countries to use exports to offset weak domestic demand and imports to offset excess domestic demand. This enables longer economic expansions and can help to tame inflation. Indeed, globalization has been an important contributor to persistently low and stable inflation rates seen in most developed economies over the past couple of decades (Figure 2).
Free trade helped tame global inflation
(Fig. 2) Global CPI1 inflation dispersion over time
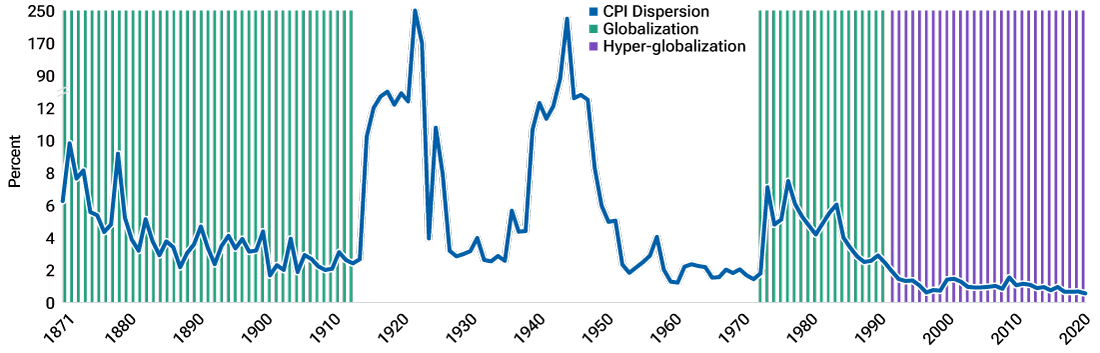
As of December 2020.
1 CPI = Consumer price index.
Sources: Jorda, Schularick, and Taylor (National Bureau of Economic Research, 2017); World Bank; and T. Rowe Price.
The more recent surge in U.S. inflation was likely the result of fiscal and monetary demand stimulus overheating the economy at a time when the coronavirus pandemic had created significant supply chain disruptions. In other words, the one time that globalization was effectively turned off was when significant U.S. domestic demand stimulus led to inflation. This is not to say that there were not other important contributors, nor that inflation would have remained stable without the supply chain disruptions—but inflation probably would have peaked at a lower level and come down more quickly had supply chains remained unimpeded.
Globalization’s role in offsetting country‑specific macroeconomic shocks means that domestic business cycles tend to be shaped by large global shocks. Furthermore, the U.S. economy’s role of the consumer of last resort means that business cycles in many other economies increasingly have converged with those of the U.S. (Figure 3). As bonds and equities in different countries have begun to show greater co‑movement, it has become increasingly important to invest in the right global company rather than the right country.
Globalization has promoted business cycle convergence
(Fig. 3) Standard deviation of world GDP over time
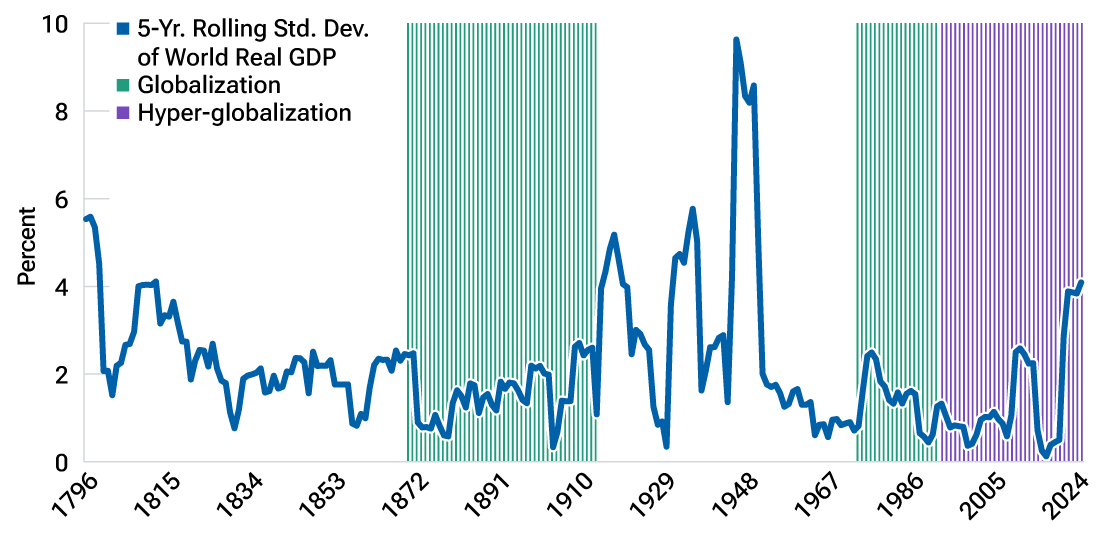
As of December 2024.
Sources: Jorda, Schularick, and Taylor (National Bureau of Economic Research, 2017); World Bank; and T. Rowe Price.
Optimal tariff theory and its lessons
For small economies that take prices on world markets as given, tariffs generate deadweight losses because it is easy for producers to pass on higher costs to consumers. This also occurs in larger economies when tariffs are imposed on goods that are not produced domestically; for example, socks from China. However, if a tariff is imposed on nonessential goods that also can be produced by the large economy that sets the tariff, foreign producers may end up absorbing the cost of the tariff, leaving prices for consumers unchanged.
“For small economies that take prices on world markets as given, tariffs generate deadweight losses....”
Justin Thomson, Head of the T. Rowe Price Investment Institute
U.S. tariffs are poised to rise by at least several multiples
(Fig. 4) U.S. tariffs since 1821
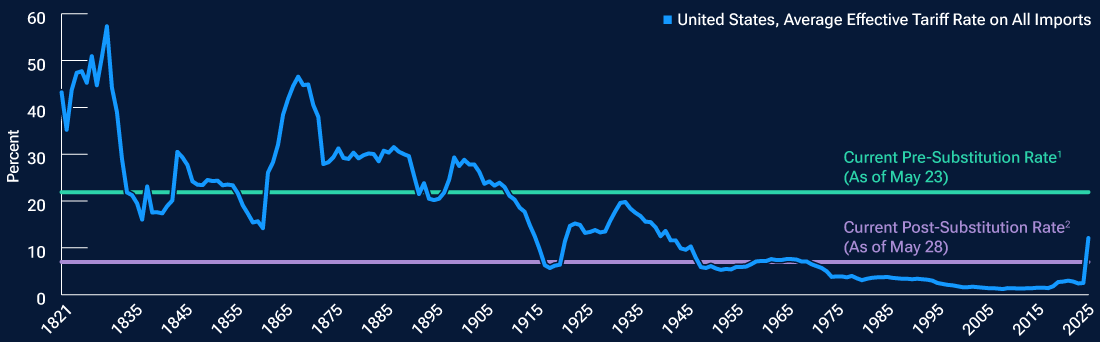
As of January 1, 2025.
1 The pre-substitution rate refers to the rate before behavioral changes and assumes a 50% EU “reciprocal” tariff rate.
2 The post-substitution rate refers to the rate after market adjustments and assumes the removal of all 2025 IEEPA tariffs.
Sources: Jorda, Schularick, and Taylor (National Bureau of Economic Research, 2017); World Bank; and T. Rowe Price.
Among economists, the tariff rate that extracts the most revenue from foreign producers while keeping consumer prices unchanged is known as the “optimal tariff.” For the U.S., the optimal tariff is likely not zero but is product specific. Some essential goods—like socks from China—cannot be made in the U.S. at competitive prices. The demand for socks is relatively inelastic, so the entire tariff can be passed onto consumers. On the other hand, luxury cars can be made competitively in the U.S. The demand for cars also is more price elastic, which means producers are more likely to absorb higher tariffs in their profit margins.
The concept of the optimal tariff has important consequences for U.S. trade policy. Sooner or later, a U.S. administration will have a better understanding of what level is optimal for a given tariff. After all, a stated aim of the new trade policy is to extract revenue from foreign producers to pay for fiscal spending in the U.S. Given the size of the U.S. market, it is likely that the optimal tariff is significantly above zero. This likely means that even future U.S. administrations will probably retain some tariffs. The era in which the U.S. lowered tariffs to encourage lower tariffs globally is likely over.
This takes us to the present. Given the complexity of the issues being addressed and the tendency of the Trump administration to make abrupt policy changes, it is likely that tariff‑related uncertainty will persist for a while yet. However, our base case is that tariffs on imported goods entering the U.S. will average out at more than 10%—considerably higher than what they were during the era we have termed hyper‑globalization (Figure 4). Put another way, we are now going through a period of deglobalization.
The risk is that the world reenters a Kindleberger’s trap. It is always easier to raise tariffs than to reach trade agreements. This is because the former offers short‑term gain but long‑term pain; with the latter, it is the opposite. Furthermore, trade agreements are notoriously difficult to enforce, and the demands of domestic politics always lead to some cheating. The incentives are therefore in favor of protectionism rather than free trade. However, if there is a leading global country dedicated to free trade no matter what, and if there are credible enforcement institutions like the WTO, these natural barriers to globalization disappear. Without these two ingredients, the world can easily fall back into a Kindleberger’s trap in which trade frictions continue and globalization is unwound.
To prevent this scenario from happening, another leading global trading power has to step up and lead the case for free trade. The obvious two candidates are China and the European Union (EU). However, many countries remain wary of China for geopolitical reasons, and European leadership has been very slow in enacting free trade policies because of the challenges associated with agreeing to decisions among 27 members. U.S. policies may, of course, change again in four years time, but in the meantime, the risk of a persistent period of deglobalization—akin to that seen in the 1930s—are the highest they have been in a century.
The prognosis
The tactical and strategic implications of tariffs in the present
Trade wars are peculiar in that they simultaneously create both demand and supply shocks, producing both inflationary and recessionary impulses. A defensive posture seems appropriate in this situation, but what does “defensive” look like today? We have observed some changing performance patterns, so it is important to frame why and how defensive asset classes are changing.
While U.S. Treasuries have been the traditional hedge against equity and credit risks in a recession, the asset class historically has not worked well as a diversifier in inflation‑driven sell‑offs. Similarly, the USD historically has been the go‑to haven asset during periods of market stress but has been atypically weak amid the recent tariff‑related market declines. It is not clear whether the weaker USD reflects short‑term mistrust of U.S. policymaking or is part of a longer‑term reversal of global capital flows. While gold and the Swiss franc apparently are still regarded as genuine haven assets, there are limits on how much money can be funneled into those assets.
History suggests that tariff issues are likely to have only limited implications for strategic asset allocation. The recently published Global Investment Returns Yearbook 2025, which incorporates 125 years of market data, found that equity returns have been very good over that period, bond returns have been average, and cash (Treasury bills) has done worse than that. There has historically been no major deviation of these return patterns during decades of elevated tariffs. In other words, there is no indication that tariffs per se have been damaging to real equity returns.
However, that summary may oversimplify the case. Every new economic paradigm presents both opportunities and challenges, and there is no guarantee that the current era of elevated tariffs will mirror those of the past. With that in mind, here are 10 ideas that we think investors should keep in mind:
- Asynchronous cycles. As national business cycles became smoother and longer, and converged more with those of the U.S., equity market returns became less dispersed. Managing money became more about picking the right global company rather than picking the right country. But in a deglobalizing world, the diversification benefits of country allocations should become more apparent. Economic cycles may become shorter and sharper as the “great moderation” itself moderates.
- Disharmonious inflation rates. In the globalization era, persistently lower and stable inflation allowed monetary policymakers to gradually bring down interest rates. Globalization therefore likely contributed to the long bull market in government bonds. Trade globalization allowed countries with significant surplus capacity to fill demand in countries that persistently consumed more than they produced. With less trade, the former countries may experience stronger deflationary pressures while the latter group experiences more inflation. That being the case, bond yields should rise in latter countries but fall in the former.
- Balance of payments. The stated purpose of the Trump tariffs is in part transformational, with the goal of reducing the U.S. current account deficit (predominantly the trade deficit). But reducing the balance of payments deficit will require a corresponding reduction in the capital account surplus (which is predominantly driven by portfolio flows into stocks and bonds, by foreign direct investment, and by loans and bank capital flows). Two less‑than‑optimistic outcomes from this process could be reduced USD liquidity and reduced capital flows into U.S. assets.
- Rerouting trade flows. This is not the end of global trade as we know it, but trade patterns will change—and there will be winners and losers in this process. If higher tariffs reduce gross trade volumes, history suggests that emerging market assets—debt, equity, and FX—will be unambiguous losers. Small open economies will do worse; countries with relatively large internal markets, where domestic sources account for 70% or more of total demand, should do better. India is one example of the latter; Brazil may be another. Over the longer term, investors should expect that China will accelerate its pivot to domestic consumption as the primary source of growth.
- Europe needs to stand up and be counted. The shift in the U.S. attitude toward longstanding security alliances has necessitated a rethink. The release of Germany’s debt brake was a seminal moment. With a lag, a new attitude should translate into increased defense spending, larger infrastructure investment, and increased regional funding.
- Intermediation. Europe’s large but idle pool of cash savings needs to be mobilized. Whether it is through a “market union,” a consolidation in European banking sectors, or re‑equitization, this process could increase interest and returns from Europe’s public equity markets.
- Disintermediation. Value in fiat currencies exists only because of trust in government policy and in the inflation credibility of central banks. As trade deficits turn into trust deficits, debasement of the USD (the world’s reserve currency) could lead the private sector to disintermediate away from official central bank and government channels. If lack of trust is the motive, cryptocurrencies provide the means. Such a move would be a shot in the arm for cryptocurrencies and blockchains.
- The biggest winners have the most to lose. U.S. multinationals, particularly the major technology giants that have gained the most from globalization, also have the most to lose. U.S. profit margins, which had held steady for decades, began increasing in the 1990s as globalization increased and then accelerated from 2000 after China entered the WTO. This is more than just a coincidence. Designing an iPhone is a high‑value, high‑margin, low‑capital undertaking; manufacturing it is a low‑margin, capital‑intensive undertaking. For U.S. multinationals, outsourcing supply chains and manufacturing to low‑cost foreign entities was a smart thing to do. As capital intensity rises, the return on capital is likely to decline. The era of “super normal” U.S. profitability may be coming to an end.
- Sell hubris, buy humiliation. The terms “U.S. exceptionalism” and the subsequent “end of U.S. exceptionalism” are both hyperbole. However, the risk premium for U.S. assets is rising and some further reweighting away from U.S. assets is likely.
- Key tail risks. Despite the agreement struck in early May, there is still a risk that the tariff standoff between the U.S. and China could escalate into a capital war in which China abandons its managed exchange rate regime and the world splits into two different monetary regimes. Everybody loses.
-
For definitions of financial terms, go to our glossary at https://www.troweprice.com/en/us/glossary
Digital assets such as cryptocurrency are relatively new, and remain largely unregulated, which create exposure to more fraud and cyber‑security breaches than established, regulated exchanges for other financial assets. Investing in digital assets carries a substantial level of risk, and is not suitable for all investors. International investments can be riskier than U.S. investments due to the adverse effects of currency exchange rates, differences in market structure and liquidity, as well as specific country, regional, and economic developments. The risks of international investing are heightened for investments in emerging market and frontier market countries.
-
Important Information
This material is provided for informational purposes only and is not intended to be investment advice or a recommendation to take any particular investment action.
The views contained herein are those of the authors as of June 2025 and are subject to change without notice; these views may differ from those of other T. Rowe Price associates.
This information is not intended to reflect a current or past recommendation concerning investments, investment strategies, or account types, advice of any kind, or a solicitation of an offer to buy or sell any securities or investment services. The opinions and commentary provided do not take into account the investment objectives or financial situation of any particular investor or class of investor. Please consider your own circumstances before making an investment decision.
Information contained herein is based upon sources we consider to be reliable; we do not, however, guarantee its accuracy. Actual future outcomes may differ materially from any estimates or forward-looking statements provided.
Past performance is not a guarantee or a reliable indicator of future results. All investments are subject to market risk, including the possible loss of principal. All charts and tables are shown for illustrative purposes only.
T. Rowe Price Investment Services, Inc., distributor. T. Rowe Price Associates, Inc., investment adviser. T. Rowe Price Investment Services, Inc., and T. Rowe Price Associates, Inc., are affiliated companies.
© 2025 T. Rowe Price. All Rights Reserved. T. ROWE PRICE, INVEST WITH CONFIDENCE, the Bighorn Sheep design, and related indicators (see troweprice.com/ip) are trademarks of T. Rowe Price Group, Inc. All other trademarks are the property of their respective owners.
202506‑4557613