Overcoming market volatility
Investment success is as much about protecting against losses as it is about pursuing gains. That’s how our active, independent approach has helped clients be better positioned for the future. While indexes rise and fall with the market, our clients have benefited from a track record of better returns through market ups and downs.
Higher returns during historic downturns
During two of the most prolonged market crises in the past 25 years, T. Rowe Price U.S. equity funds generated higher returns than their respective indexes through the largest decline.1 This resulted in more money saved—followed by more money gained—for our clients.

A history of better returns in up and down markets
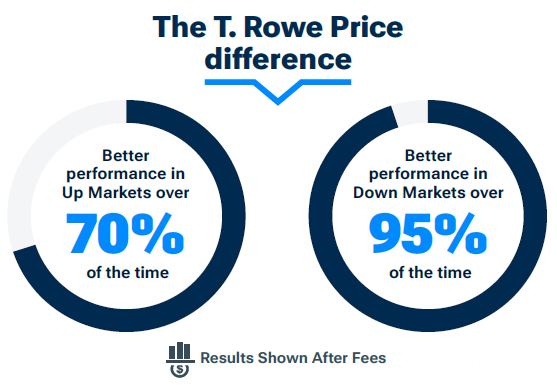
Limiting investors' losses is just as important as—and goes hand in hand with—delivering growth. For the last 20 years, our U.S. equity funds analyzed beat their benchmarks over 70% of the time in trailing five-year monthly rolling periods when their designated benchmarks were positive.2 Perhaps more importantly, our funds helped investors limit losses better than the benchmark during that same period, outperforming over 90% of the time when benchmarks were down.

Trailing five-year monthly rolling periods from 12/31/2004 to 12/31/2024.
Past performance cannot guarantee future results.
Active, independent insights that drive results
Trump’s tariffs: More bite than bark?
A view that tariffs would have little long-term impact on asset prices is likely to be mistaken.
U.S. policy under Trump: What investors need to know
Tim Murray analyzes key policy priorities for the Trump administration and the potential implications for investors.

Subscribe to stay ahead of ever-changing markets
Receive timely, dynamic perspectives on the issues that matter most to you.
Resources to help your clients make the most of volatile markets

Keep a Long-Term Perspective
Market volatility is a constant. Help your clients understand the market's history of long-term growth and the advantages of staying invested.

The High Cost of Cashing Out
Use this tale of two investors to demonstrate the benefit of sticking with your long-term strategy through market ups and downs.

It’s Possible to Profit from Patience
Quickly show your clients how short-term market drops have historically been followed by longer-term rallies.
Tap into expert portfolio ideas, analysis, and support

Global Asset Allocation Viewpoints
Discover how our Asset Allocation Committee is positioning portfolios in the current market.

Portfolio Construction Solutions
Build, inform, and adjust your portfolios with our suite of customized solutions.
Contact us
Important Information
Past performance is no guarantee of future results.
1 Results based on an analysis of T. Rowe Price’s current active, diversified U.S. equity mutual funds (oldest share class). Index, sector, specialized, and institutional clones of our retail funds were excluded. Of T. Rowe Price’s 25 current diversified U.S. equity funds, 18 met the criteria for the analysis and are represented within. One of the 18 funds, the Capital Appreciation Fund, also has the ability to invest in fixed income assets but is primarily an equity portfolio and benchmarked to the S&P 500 Index. The funds included in the analysis represented over 75% of total U.S. equity assets in the domestic and global equity mutual funds advised by the firm as of 12/31/2024. The analysis spans two five year periods surrounding significant market corrections and recovery (2001 through 2005, and 2008 through 2012) and measures performance net of fees and trading costs. Fund performance was measured against a custom blended index allocated according to the designated benchmarks of each fund included in the analysis. Compares an initial $100,000 investment in this custom blended index to a similar investment equally-weighted across the T. Rowe Price funds available at the beginning of the analysis, and expanding to include new diversified U.S. equity funds as they incepted (14 of 17 have track records allowing inclusion at the beginning of the first 5-year period and all 17 are included throughout the second). Both the funds and indices are rebalanced monthly to reinstitute an equal-weighting of each fund and index at each interval throughout the analysis period. Assumes dividends and capital gains are reinvested and no additional contributions.
2 Results based on an analysis of T. Rowe Price’s active, diversified U.S. equity mutual funds (oldest share class). Index, sector, specialized, and institutional clones of our retail funds were excluded. Funds with less than a 15-year track record were also excluded due to limited performance data availability. Of T. Rowe Price’s 25 diversified U.S. equity funds, 17 met the criteria for the analysis and are represented within. One of the 17 funds, the Capital Appreciation Fund, also has the ability to invest in fixed income assets but is primarily an equity portfolio and benchmarked to the S&P 500 Index. The funds included in the analysis represented over 75% of total U.S. equity assets in the domestic and global equity mutual funds advised by the firm as of 12/31/2024. Results for other time periods will differ.
All investments are subject to risk, including the possible loss of principal. All charts and tables are shown for illustrative purposes only. T. Rowe Price Investment Services, Inc., distributor, T. Rowe Price mutual funds.
202405-3599562