
Why AI’s next phase could favor investors with a global view
October 2026, Equity
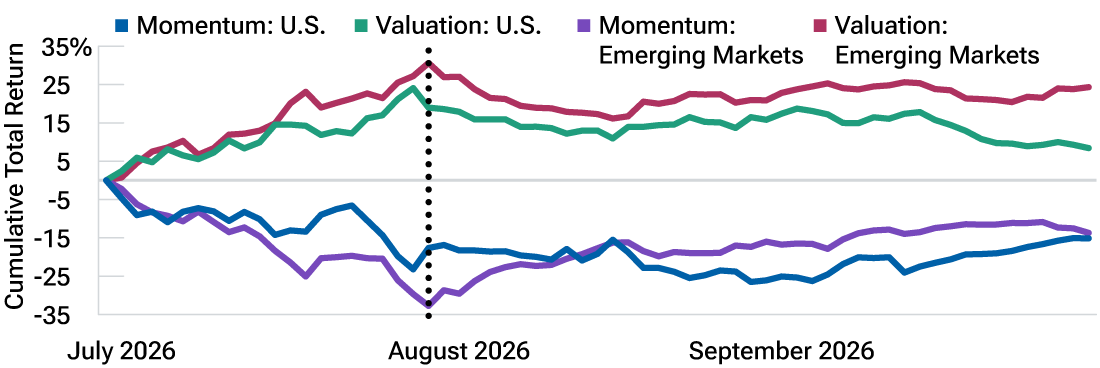
The third quarter represented an abrupt shift from preceding quarters, as concerns about the embedded expectations in stocks associated with the AI trade led to a significant drawdown in momentum and risk, alongside the strong outperformance of valuation (Figure 1).
Quarterly factor returns
(Fig. 1) July 1, 2026 –September 30, 2026
| Index | Total Return | Valuation | Growth | Momentum | Quality | Profitability | Risk | Size |
|---|---|---|---|---|---|---|---|---|
| MSCI Japan | 6.09% | 23.58% | -8.12% | -22.04% | 2.65% | -7.48% | -17.66% | -7.80% |
| MSCI Pacific ex-Japan | 4.50 | 10.47 | -5.08 | 9.53 | 0.73 | 0.51 | 0.28 | 3.82 |
| Russell 1000 Value | 2.61 | 4.31 | 5.28 | -9.62 | 3.45 | -1.15 | 1.56 | 4.05 |
| Russell 1000 | 1.80 | 8.41 | 1.33 | -15.14 | 4.21 | -3.53 | -1.48 | 3.34 |
| Russell 1000 Growth | 0.92 | 15.36 | 4.19 | -27.42 | 6.89 | -0.31 | -11.29 | -6.63 |
| MSCI Emerging Markets | -0.24 | 24.32 | -15.24 | -13.71 | 7.28 | 2.58 | -15.98 | -7.83 |
| MSCI Europe | -1.6% | 7.76 | -2.30 | -3.57 | 0.68 | -1.07 | -4.94 | -5.69 |
| Russell 2500 | -6.37 | 13.00 | 1.78 | -10.51 | 9.52 | 8.53 | -9.28 | 0.09 |
Past performance is not a guarantee or a reliable indicator of future results.
Sources: Refinitiv/IDC data, Compustat, Worldscope, Russell, and MSCI. Analysis by T. Rowe Price. See Additional Disclosures for more detail on thesources used throughout this material. Total return data are in U.S. dollars. Factor returns are calculated as equal‑weighted quintile spreads. Quintilesare rebalanced daily.
Factors or factor analysis involves targeting quantifiable firm characteristics, or “factors,” that can explain differences in stock returns. Over the last50 years, academic research has identified hundreds of factors that impact stock returns. See Appendix for calculation methodology, definitions offinancial terms, and more details on the factors referenced throughout the article. The data presented in this material are for illustrative purposesonly and do not represent an actual investment nor any T. Rowe Price product.
It’s notable that most of this drawdown happened rapidly in July (Figure 2), before stabilizing and partially reversing over the rest of the quarter despite a soaring U.S. Treasury 10‑year yield.
To us, this pattern suggests the correction was more technical than fundamental. Selling pressure was amplified by the sharp fall in popular exchange-traded funds offering leveraged exposure to Korean memory stocks and margin calls on the Situational Awareness hedge fund.
Momentum lagged and valuation outperformed in July, before stabilizing and partially reversing
(Fig.2) July 1, 2026, to September 30, 2026
Past performance is not a guarantee or a reliable indicator of future results.Sources: Refinitiv/IDC data, Compustat, Worldscope, Russell, and MSCI. Analysis by T. Rowe Price Integrated Equity team. See Additional Disclosures. U.S. = Russell 1000 Index. Emerging markets = MSCI Emerging Markets Index. Total return data are in U.S. dollars. Factor returns are calculated as equal weighted quintile spreads.
One possible catalyst for this move was the June 26 reconstitution of FTSE/Russell’s capitalization‑weighted indexes, which was one of the most significant in recent memory.1
This historic rebalancing dramatically changed the risk profile of key indexes, adding more AI, momentum, and beta exposure to the large‑cap growth benchmark while shifting potential “AI losers” and stocks that had exhibited negative momentum into the large‑cap value and small‑cap indexes.
Figure 3 shows how active managers’ exposures would have changed if they had not repositioned their portfolios around the reconstitution of various FTSE/Russell indexes.
How the Russell rebalancing this summer dramatically rearranged factor exposures
(Fig. 3) Status quo portfolio exposure changes vs. reconstituted indexes
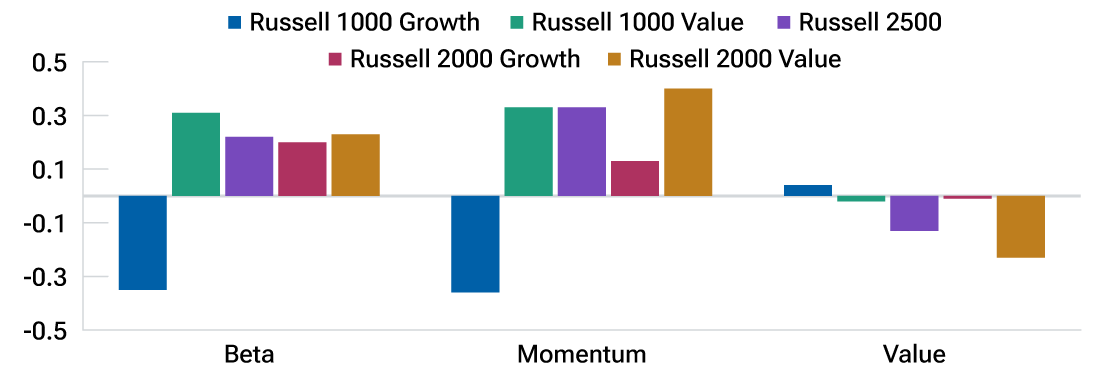
The chart represents Barra factor exposure differences between select post- and pre-reconstitution FTSE Russell indexes. (See Appendix for details.) Positive values indicate that the pre-reconstitution weighting for that factor was higher than its post-reconstitution exposure and that a static portfolio would gain the given exposure. Negative values indicate that a factor’s pre-reconstitution weighting was lower than its post-reconstitution exposure and that a static portfolio would have lost the given exposure. Barra exposures are standardized Z‑scores, so the units here reflect standardized movements. Z‑score shows how a value compares to the rest of the data in a distribution.
For example, the Russell 1000 Growth Index inherited stocks with high beta and momentum. As a result, a static portfolio benchmarked to the index would have become more negatively exposed to beta and momentum. As shown in Figure 1, this positioning would have been a tailwind for static portfolios in the third quarter. Conversely, the same dynamic implies that the reconstitution would have been a meaningful headwind for static U.S. large‑cap value and U.S. small‑cap portfolios.
Therefore, the Russell index rebalancing appears highly consequential for third‑quarter factor returns. Not only has the nature of the indexes changed, but the impact on active manager performance could also be meaningful depending on whether they adjusted their portfolios in response to the reconstitution.
For example, one question we have been asked multiple times is whether defensively positioned small‑cap managers who lagged significantly over the past year should outperform significantly when the AI trade reverses. Without the Russell index reconstitution, that probably would have been true; however, the profound changes to the benchmarks this year suggest the magnitude of the reversal could be smaller than expected.
How we are mapping the global AI opportunity
One of the most important questions facing investors right now is how opportunities in artificial intelligence (AI) could broaden beyond the infrastructure buildout to include companies enabling and applying AI.
Developments in the third quarter signaled that the market is grappling with how the AI cycle might evolve:
- Concerns about the financing of and potential returns on AI infrastructure prompted the market to question the elevated valuations of semiconductor stocks and other companies that have benefited from this massive wave of capital spending.
- Investors appeared to reconsider whether some software companies, such as cybersecurity providers, might emerge as potential winners rather than losers in the AI era.
- The release of Meta Platforms’ Muse AI agent in early September could be a watershed moment in consumer‑facing AI and could catalyze the transition to agentic commerce.
Our efforts to frame the potential evolution of the AI trade and areas of emerging opportunity surfaced two key findings:
- Mapping possible AI beneficiaries reveals a global opportunity set, with non‑U.S. companies particularly well represented in the applications layer, including robotics, industrial AI, drug discovery, and bioprocessing.
- Our analysis suggests that non‑U.S. companies enabling AI adoption and building new AI applications generally offer cheaper valuations than their U.S. counterparts.
In sum, we think equity strategies that can invest globally have an opportunity to gain exposure to the next wave of AI growth at reasonable valuations.
How we defined three groups of AI beneficiaries
We started our analysis of the global equity universe by creating three classifications of AI beneficiaries that reflect different phases of the AI cycle:
- AI Buildout: This category supplies the infrastructure that AI runs on. Examples include providers of semiconductors and memory, power and grid equipment, datacenter infrastructure, networking, and optical connectivity.
- AI Adoption: Companies in this category make AI usable across the economy. They provide platforms, data, software, and services that let businesses and consumers access, integrate, and securely deploy AI. Examples include cloud providers, mega‑cap technology companies, enterprise software, cybersecurity, data providers, and select fintech networks.
- AI Applications: These companies are applying AI to build new capabilities for specific end markets. Examples include biotech and drug discovery, robotics and manufacturing, mobility and logistics, aerospace and defense, and edge AI, which operates on a device instead of in the cloud.
Within each classification, we grouped stocks into thematic subcategories that reflect their underlying businesses. This iterative process incorporated alternative data techniques, such as returns‑based clustering, a quantitative technique used to identify stocks that historically have tended to move together. We also used large language models2 to analyze unstructured textual information from company filings, earnings call transcripts, and investment research from Wall Street and T. Rowe Price’s global platform of fundamental analysts.
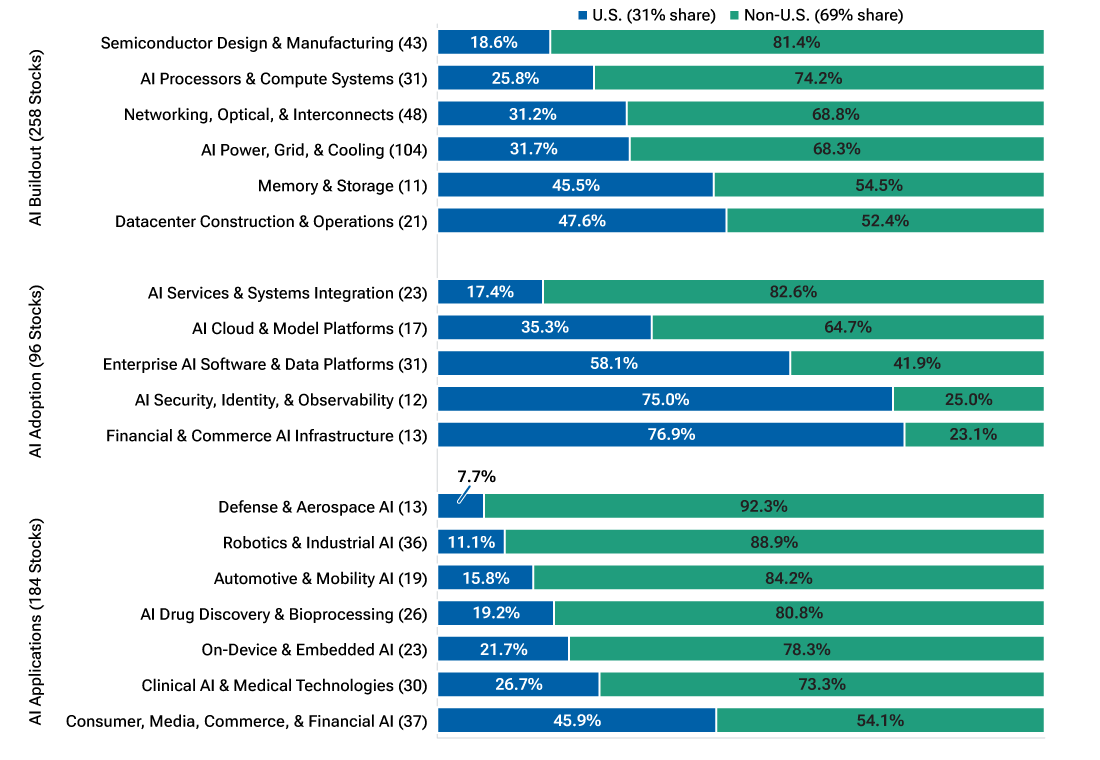
Thematic breakdown of potential AI beneficiaries in MSCI AC World Index
(Fig. 4) Share of company count per theme, U.S. and non‑U.S.
As of September 30, 2026.
Sources: MSCI, Datastream. (See additional disclosure.) Analysis by T. Rowe Price Integrated Equity team.Companies were identified as U.S. or non‑U.S. based on MSCI’s country classification. Claude and ChatGPT were used to classify potential AI beneficiaries based on the T. Rowe Price Integrated Equity team’s criteria, internal fundamental research, company disclosures from FactSet Research Systems, and sell‑side reports. The classification process is subjective. AI is subject to potential limitations, including potential for inaccuracies, biases, and hallucinations.
Our multifaceted analysis identified 528 potential AI beneficiaries among the more than 2,400 companies in the MSCI AC World Index. These AI‑linked companies were arrayed across 18 thematic subcategories (Figure 4).
Based on company count (not market capitalization), about 31% of the names that our analysis flagged as possible AI beneficiaries were from the U.S., while non‑U.S. companies made up the remaining 69%. The AI opportunity is global in nature.
A global view: Areas of AI potential opportunity inside and outside the U.S.
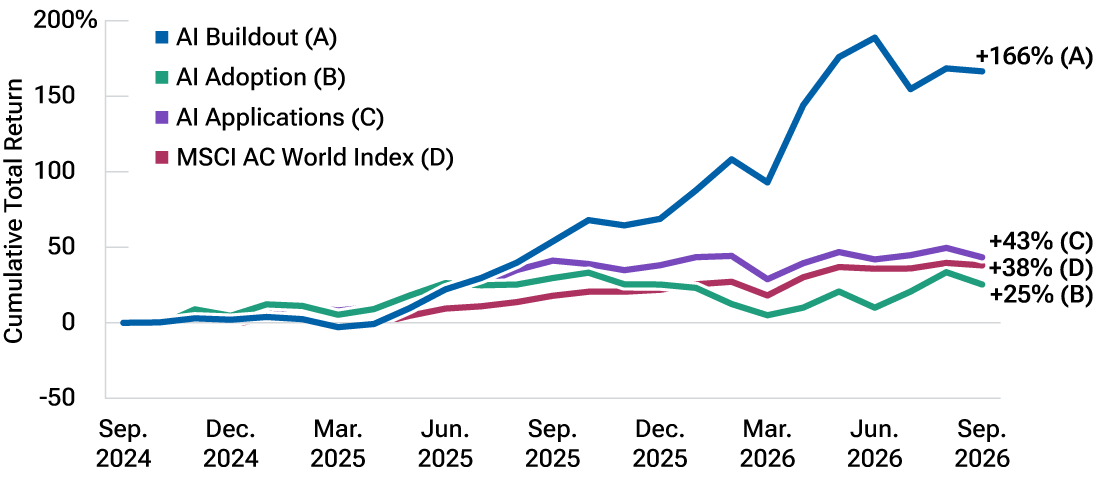
Much of the value generated thus far by AI has occurred in the Buildout phase, as the industry rushed to secure chips, networking, and other hardware to ramp up
datacenter capacity.
Share price performance for the AI beneficiaries in our Adoption and Applications categories, in contrast, has not been as robust to date (Figure 5)—in part because it is less clear to the market which companies will capture the bulk of the value at this juncture.
AI beneficiaries aligned with the buildout phase have outperformed significantly
(Fig. 5) Cumulative total returns
Past performance is not a guarantee or a reliable indicator of future results.
September 30, 2024, to September 30, 2026.
Sources: MSCI, Datastream. (See additional disclosure.) Analysis by T. Rowe Price Integrated Equity team.Cumulative total returns are in U.S. dollars and include dividends. AI Buildout, AI Adoption, and AI Applications returns are equally weighted averages, calculated monthly. See Figure 4 for details on how these thematic groups were determined.
This relative lack of clarity could be a source of opportunity as the market seeks the next AI winners. In past technology waves, significant value has tended to accrue at the Adoption and Applications layers over the longer run.
Several thematic groups in the AI Applications category that show promise have significant non‑U.S. representation:
- Robotics and industrial AI (89% non‑U.S.): AI is coming to the physical world in the form of industrial automation and robotics.
- AI drug discovery and bioprocessing (81% non‑U.S.): Spending to test whether AI can improve drug discovery appears to be gaining steam, with an emphasis on collecting biological data for training and using models to optimize the preclinical process. AI could also make drug manufacturing processes more efficient.
- Clinical AI and medical technologies (73% non‑U.S.): AI shows potential to add value in connected medical devices and in the interpretation of imaging and diagnostics.
In contrast, our analysis suggests that the U.S. equity market has strong representation in AI Adoption and Applications themes in the digital realm, including enterprise AI software and data platforms, cybersecurity, and financial and commerce infrastructure.
Comparing valuations across the global AI opportunity set
Given differences across geographies and business models, we modeled forward earnings multiples while controlling for industry, country, and selected company characteristics, including size, growth, profitability, earnings quality, and beta.
That analysis suggests modestly more expensive modeled valuations for non-U.S. AI Buildout stocks. In the AI Adoption and Applications categories, our analysis estimates non-U.S. valuation discounts of approximately 35% and 23%, respectively, relative to U.S. stocks after the stated controls (Figure 6).
Non-U.S. AI Adoption and Applications stocks trade at a discount to U.S. peers
(Fig. 6) Valuation differentials between U.S. and non‑U.S. AI beneficiaries
| Phase | Valuation Differential (non-U.S. vs. U.S.) |
|---|---|
| Al Buildout | +2% Premium |
| Al Adoption | -35% Discount |
| Al Applications | -23% Discount |
| All Three | -12% Discount |
As of September 30, 2026.
Source: MSCI, IBES. Analysis by T. Rowe Price Integrated Equity team.
Negative valuation differentials indicate a discount for potential non-U.S. AI beneficiaries relative to their U.S. counterparts. We used a cross‑sectional least-squares regression of companies’ 12‑month forward price‑to‑earnings ratios, expressed on a logarithmic basis. There can be no assurance that the estimates will be achieved. Actual results may vary. See Additional Disclosures for more details on analysis methodology.
These results help to identify potential candidates for further research, particularly where lower modeled valuations are supported by credible earnings opportunities. Inclusion in an AI theme is a starting point for a deep dive into a company’s business, not an investment thesis.
Conclusion
The AI opportunity set for investors is global and extends beyond the infrastructure phase. We combined our fundamental research platform with advanced quantitative techniques to create a global map of stocks across the AI Buildout, Adoption, and Applications categories as well as thematic subcategories.
Non‑U.S. companies are particularly well represented in select AI Applications, including health care themes and robotics and industrial AI. Our valuation analysis, meanwhile, suggests cheaper modeled valuations for non‑U.S. AI Adoption and Applications stocks.
We believe there could be attractive international opportunities in the next wave of AI adoption, and this map provides a starting point for combining fundamental research and quantitative stock selection to identify potential future winners at attractive prices.
Appendix
Factors are our internally constructed metrics, defined as follows:
Valuation: Proprietary composite of valuation metrics based on earnings, sales, book value, and dividends. Specific value factor weighting may vary by region and sector.
Growth: Proprietary composite of growth metrics based on historical and forward‑looking earnings and sales growth. Factor selection and weighting vary by region and industry.
Momentum: Proprietary measure of medium‑term price momentum.
Quality: Proprietary measure of quality based on fundamental and stock price stability; balance sheet strength; and measures of profitability, capital usage, and earnings quality.
Profitability: Return on equity.
Risk: In this paper, risk is the standard deviation of trailing 12‑month returns. High‑risk stocks exhibit higher standard deviations, indicating a wider degree of variation or dispersion in their historical return.
Size: Market capitalization (positive return means larger stocks outperform smaller stocks).
Quintile spread: Also referred to as long‑short returns, a quintile spread is calculated by sorting securities based on a specific characteristic or factor criterion, dividing them into five groups (or quintiles), equal‑weighting the securities within each quintile, and then subtracting the bottom‑quintile returns (lowest 20%) from the top‑quintile returns (highest 20%).
Factors and indices cannot be invested in directly and are shown for illustrative purposes only. They do not reflect performance of actual investments nor do they reflect the reduction of fees associated with an actual investment, such as trading costs and management fees.
All investments are subject to market risk, including the possible loss of principal. Past favorable company characteristics may not persist into the future.
Investment Risks: Equities can lose value rapidly for a variety of reasons and can remain at low prices indefinitely. International investments can be riskier than U.S. investments due to the adverse effects of currency exchange rates, differences in market structure and liquidity, as well as specific country, regional, and economic developments. Growth stocks are subject to the volatility inherent in common stock investing, and their share price may fluctuate more than that of income‑oriented stocks. Small‑cap stocks have generally been more volatile in price than large‑cap stocks. Mid‑caps generally have been more volatile than stocks of large, well‑established companies. Investing in technology stocks entails specific risks, including the potential for wide variations in performance and usually wide price swings, up and down. Technology companies can be affected by, among other things, intense competition, government regulation, earnings disappointments, dependency on patent protection, and rapid obsolescence of products and services due to technological innovations or changing consumer preferences.
Other definitions:
Barra beta measures a stock’s potential sensitivity to broad market movements. It is calculated using excess returns regression coefficient to capitalization-weighted universe returns over the trailing 252 trading days.
Barra momentum explains common variation in stock returns related to relative strength as reflected in recent (12 months) stock price behavior.
Barra value reflects common valuation characteristics, including book to price and cash flow yield.
 Tedd Alexander
Head, Global Integrated Equity
Tedd Alexander
Head, Global Integrated Equity
 David Corris, CFA
Co-Portfolio Manager
David Corris, CFA
Co-Portfolio Manager
 Brian Dausch, CFA
Portfolio Specialist
Brian Dausch, CFA
Portfolio Specialist

- Jul 2026
- Equity
How AI can open new avenues for systematic investment research
