
Beyond AI: A broader opportunity in Emerging Markets
November 2026, Equity
- Key Insights
-
- EM earnings growth has broadened beyond AI, with materials, industrials, and energy benefiting from a new cycle of investment in the physical economy.
- The next phase of EM performance may reward selectivity and require investors to look beyond yesterday’s AI winners.
- A small shift away from U.S. equities could drive sizable EM flows into an asset class offering faster expected earnings growth at lower valuations.
Emerging markets (EMs) have already enjoyed a strong run. Since the start of 2025, the MSCI Emerging Markets Index has gained 66.2%, ahead of European (45.3%) and Japanese equities (53.9%), and about double the return of the S&P 500 Index (32.9%) (Figure 1).
EM equities have delivered strong gains since January 2025
Indexed to 100 at December 31, 2024. Data through to September 30, 2026. Index performance is for illustrative purposes only and is not indicative of any specific investment. Investors cannot invest directly in an index.
Source: FactSet.
Because of this, some may question the durability of the rally, while others may ask whether they have missed the opportunity to participate. In our view, the fundamentals remain strong, but investors may need to look in different areas for the next leg of the EM rally.
…investors may need to look in different areas for the next leg of the EM rally.
EM is becoming more than an AI trade
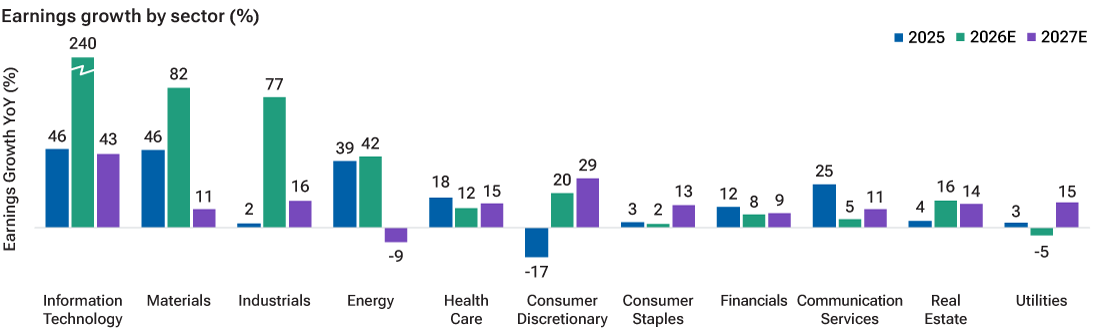
AI has been a powerful driver of EM returns, and estimates point to earnings growth jumping more than 200% for the EM information technology sector in 2026 (Figure 2). However, beneath the headline AI trade, something broader is happening. Earnings growth has been spreading across sectors, while rising investment in defense, energy security, infrastructure, and supply chains are creating opportunities in parts of EMs that have received far less attention.
Robust Earnings Growth Across EM
(Fig. 2) Earnings growth is broadening well beyond information technology
As of September 30, 2026.
Actual outcomes may differ materially from estimates. Estimates are subject to change. 2026 and 2027 figures are estimates. 2026 bars for information technology are truncated; values shown.
Source: FactSet.
Materials and industrials earnings are both expected to rise by around 80% in 2026. Energy earnings growth is forecast to accelerate to around 40%, and consumer discretionary earnings are expected to rebound by around 20% after falling 17% in 2025. Looking ahead to 2027, estimates point to double‑digit earnings growth in nine of the 11 EM sectors.
This matters because many of today’s largest investment themes depend on the physical economy. AI needs data centers, power, and cables. Electrification needs new generation capacity. Supply chain diversification needs factories and logistics networks, while energy security and higher defense spending need new infrastructure and industrial capacity.
This is where Heavy Assets, Low Obsolescence (HALO) comes in. These are physical assets that are difficult to replicate and difficult for technology to disrupt: A copper mine, a power grid, a shipyard. These can take years and significant capital to build, and they are far less likely to be made obsolete by a new line of code. Whether investors wish exposure to power generation, grids, commodities, manufacturing, or infrastructure, many of those paths lead back to emerging markets.
Where EMs could benefit from the capex boom
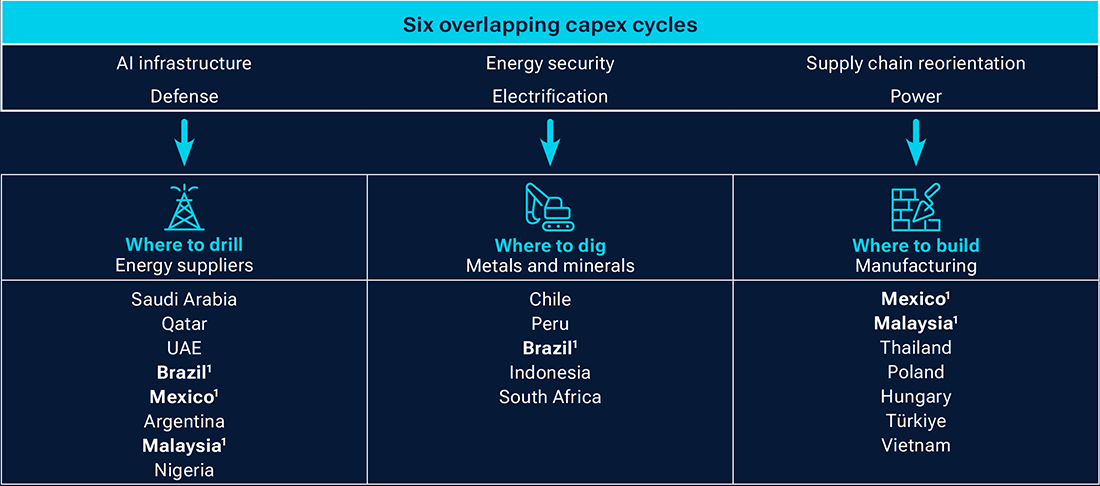
(Fig. 3) Energy, resources, and manufacturing may offer three routes to new investment
As of September 30, 2026.
1 Appears in more than one group.
For illustrative purposes only. There is no assurance that the countries identified will benefit from these trends.
Source: T. Rowe Price analysis.
Figure 3 traces these overlapping capital expenditure (capex) cycles, of which AI infrastructure is just one, through to the EM countries positioned to benefit. They fall into three broad groups: Where to drill for energy, where to dig for the metals and minerals that infrastructure and electrification demand, and where to build as manufacturing capacity is diversified and relocated. Several countries, including Brazil, Mexico, and Malaysia, appear in more than one group, a sign of how widely the benefits of this investment cycle could spread.
Looking beyond yesterday’s winners
This broadening creates a very different opportunity set for investors. Taiwan and South Korea remain home to exceptional companies, but after the surge of interest in AI and semiconductors they are hardly undiscovered. Their largest companies also now dominate the benchmark. The MSCI Emerging Markets Index has become increasingly concentrated in technology, with TSMC, Samsung Electronics, and SK Hynix alone accounting for around a third of the index.1
As with the S&P 500 Index, this concentration is not without reason: These companies have been particularly good at capturing the economic profit from the AI capex boom, and their earnings have grown rapidly as a result. The real question is what happens when that growth slows. Given their weight within the index, the effect could be significant.
Brazil offers a useful contrast. Its investment story is driven much more by domestic economic and political factors. Elections and changing economic conditions can create periods of uncertainty and market dislocation—precisely the conditions in which a contrarian investor can potentially find opportunities. The same applies across other emerging markets. Mexico, Thailand, and parts of Central and Eastern Europe have their own economic, political, and corporate cycles.
Finding companies before the market does
In our view, investors who assume the next phase of EM performance will simply repeat the last one risk overlooking some of the most interesting opportunities. The best investment candidates are often companies that have slipped off the market’s radar: Stocks with limited institutional ownership and sell‑side coverage, where balance sheets are being repaired and earnings are stabilizing before the market takes notice.
The catalyst for change can be internal, such as cost cutting, new management, asset sales, or improved dividends and buybacks. It can also be external, such as a turn in the economic cycle or a change of government. Rather than paying up for the quality growth stocks that everyone already owns, we believe it is important to look for companies that can improve their economic returns, without overpaying for them.
A small shift could go a long way
There could also be another tailwind. After years of exceptional U.S. equity performance, global portfolios remain heavily tilted toward U.S. assets. The U.S. makes up around 64% of the MSCI All Country World Index, compared with around 10% for EMs. This means investors needn’t abandon the U.S. for EM flows to become significant. Given the relative size of the two markets, trimming U.S. equity holdings by just 1% and redirecting the proceeds to EMs would lift EM equity holdings by around 6%.2 Even a relatively modest diversification away from concentrated U.S. exposure could have a disproportionate impact on the asset class.
EM Offers a compelling growth‑valuation combination
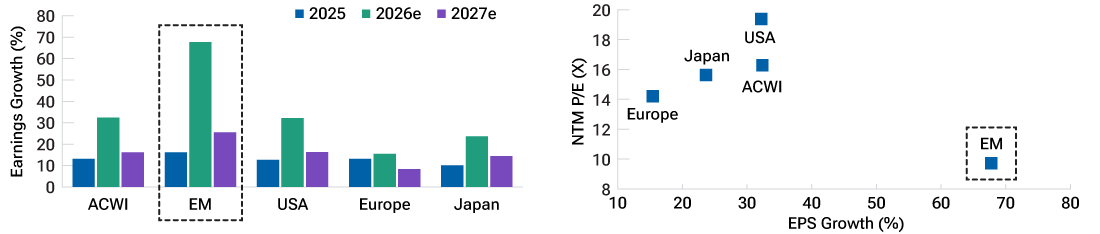
(Fig. 4) Faster expected earnings growth at a lower valuation multiple
As of September 30, 2026.
Actual outcomes may differ materially from estimates. Estimates are subject to change.
EPS growth in local currency, except MSCI Emerging Markets and MSCI All Country World (USD). NTM P/E = price to next 12 months’ estimated earnings.
Source: MSCI indices (see Additional Disclosure).
These potential new flows would meet a supportive fundamental backdrop, with robust earnings expectations and relatively attractive valuations. EM earnings are expected to grow by close to 68% in 2026, roughly double the rate expected for U.S. and global equities. Yet EMs trade on less than 10 times forward earnings, compared with around 16‑times for global equities and 19‑times for the U.S. (Figure 4). Estimates for 2027 also point to EM earnings growth ahead of each of the major developed markets.
No longer a single trade
The rally so far has been led by the most visible beneficiaries of AI. The next phase may reward something different: A willingness to look where others aren’t. If earnings growth broadens and country cycles diverge, EMs may behave less like a single trade and more like a collection of distinct opportunities. That may make broad exposure a blunter tool and put a greater premium on selectivity: Knowing which markets are at a turning point, which companies are improving, and where that change is not yet reflected in prices.
For investors who already own the AI winners, the case for emerging markets in 2027 may rest not on adding more of the same, but on owning what the rally has so far passed by.
 Ernest C. Yeung, CFA, IMC
Portfolio Manager

- Oct 2026
- From the Field
The ChatGPT moment in transportation? Autonomous driving nears commercial inflection
1 As of September 30, 2026. Source: FactSet.
2 Source: US Stock: Weight of US in MSCI All Country World Index, EM Stock: Weight of EM in MSCI All Country World Index. Weights as of March 31, 2026: U.S. 64%, EM 10%. A 1% cut in U.S. holdings (0.64 percentage points) redirected to EM equals an increase of about 6% in EM holdings. Actual outcomes may differ materially from estimates. Estimates are subject to change.
Risks
Investment Risks: International investments can be riskier than U.S. investments due to the adverse effects of currency exchange rates, differences in market structure and liquidity, as well as specific country, regional, and economic developments.
The risks of international investing are heightened for investments in emerging market and frontier market countries. Emerging and frontier market countries tend to have economic structures that are less diverse and mature, and political systems that are less stable, than those of developed market countries.
Commodities are subject to increased risks, such as higher price volatility and geopolitical and other risks. Commodity prices can be subject to extreme volatility and significant price swings. Because of the cyclical nature of natural resource companies, their stock prices and rates of earnings growth may follow an irregular path.
Past performance is not a guarantee or a reliable indicator of future results. All investments involve risk, including possible loss of principal.
Additional Disclosures
The specific securities identified and described are for informational purposes only and do not represent recommendations.
For U.S. investors, visit troweprice.com/glossary for definitions of financial terms.
Please see vendor indices for more information, including definitions and source data: troweprice.com/marketdata.
Important Information
This material is being furnished for informational and/or marketing purposes only and does not constitute an offer, recommendation, advice, or solicitation to sell or buy any security.
Prospective investors should seek independent legal, financial and tax advice before making any investment decision. T. Rowe Price group of companies including T. Rowe Price Associates, Inc. and/or its affiliates receive revenue from T. Rowe Price investment products and services.
Information presented has been obtained from sources believed to be reliable, however, we cannot guarantee the accuracy or completeness. The views contained herein are those of the author(s), are as of October 2026, are subject to change, and may differ from the views of other T. Rowe Price Group companies and/or associates. Under no circumstances should the material, in whole or in part, be copied or redistributed without consent from T. Rowe Price.
All charts and tables are shown for illustrative purposes only. Actual future outcomes may differ materially from any estimates or forward‑looking statements provided.
The material is not intended for use by persons in jurisdictions which prohibit or restrict the distribution of the material and in certain countries the material is provided upon specific request.
Issued in the USA by T. Rowe Price Investment Services, Inc., distributor and T. Rowe Price Associates, Inc., investment adviser, 1307 Point Street, Baltimore, MD 21231, which are regulated by the Financial Industry Regulatory Authority and the U.S. Securities and Exchange Commission, respectively.
© 2026 T. Rowe Price. All Rights Reserved. T. Rowe Price, INVEST WITH CONFIDENCE, the Bighorn Sheep design, and related indicators (see troweprice.com/ip) are trademarks of T. Rowe Price Group, Inc. All other trademarks are the property of their respective owners. Use does not imply endorsement, sponsorship, or affiliation of T. Rowe Price with any of the trademark owners.
- 202610-6040221