
Are higher rates catching up with small caps?
November 2026, Multi-Asset
- Key Insights
-
- Small‑caps carry considerably more leverage than large‑caps, leaving them less room to absorb persistently high borrowing costs as existing debt reprices.
- Improving earnings helped offset higher rates, but growth expectations have declined since early July, and that tailwind may be fading.
- With the backdrop becoming less favorable, our Asset Allocation Committee has recently begun trimming its exposure to U.S. small‑cap stocks.
U.S. small-cap stocks had an exceptional run through the first half of 2026. But since the end of June, that momentum has reversed.
From June 30, 2025, through June 30, 2026, the S&P 600 returned roughly 38%, while the Russell 2000 gained more than 40%. Since then, both indexes have fallen around 6% to 8%.
So what changed?
The answer appears to be a combination of persistently high interest rates and signs that small-cap earnings growth may be approaching a peak.
Small caps are especially vulnerable to higher interest rates for two reasons.
First, smaller companies carry considerably more leverage than their large-cap counterparts. Second, the small-cap universe has greater exposure to rate-sensitive areas of the economy, including housing, financials, and other traditional cyclical industries.
The balance-sheet vulnerability has increased substantially over time.
In 2010, total debt represented roughly 25% of assets for the S&P 600, compared with about 28% for the S&P 500. Today, small-cap leverage has risen to approximately 39%, while large-cap leverage remains close to where it was 16 years ago.
That higher debt burden has made financing costs increasingly important.
Interest coverage for the S&P 600 has deteriorated to a little over four times earnings before interest expense. For the S&P 500, coverage is nearly 13 times.
That leaves smaller companies with considerably less room to absorb persistently high borrowing costs as existing debt gradually reprices.
The market has historically reflected this balance-sheet sensitivity through lower valuations when interest rates rise.
Since 2014, the correlation between the 10-year Treasury yield and the S&P 600's forward price-to-earnings ratio has been approximately negative 0.6.
Put simply, higher yields have generally been associated with lower small-cap valuation multiples.
That relationship makes sense. When financing costs rise, investors demand a lower price for companies that carry more debt and have less capacity to absorb the added expense.
So the valuation pressure we are seeing today is not a separate issue. It is one of the ways higher rates and greater leverage are being reflected in small-cap prices.
For much of 2025 and the first half of 2026, small caps were able to overcome that pressure because earnings were improving rapidly.
Earnings estimates had been climbing steadily since mid-2023, and actual earnings delivery also improved. In recent months, small-cap companies have even been beating the expectations that analysts had set a year earlier.
That fundamental strength helped offset the drag from higher interest rates and supported strong equity returns.
The concern now is that this earnings tailwind may be beginning to fade.
Forward 12-month earnings growth expectations for the S&P 600 reached roughly 19% in early July but have since declined to about 17%.
Actual earnings remain healthy, but the question is whether that can continue if higher rates increasingly slow activity in the parts of the economy where small caps are most exposed.
If earnings growth continues to moderate while rates remain elevated, small caps could face pressure from both sides: weaker earnings growth and lower valuation multiples.
We are not yet convinced that this more difficult scenario will fully materialize.
Small-cap earnings remain healthy, and valuations have already adjusted considerably from their mid-year highs.
But the backdrop has become less favorable. Small caps are carrying significantly more leverage than they have historically. Meanwhile, interest coverage has deteriorated, and the earnings acceleration that previously offset higher rates appears to be moderating.
If rates continue to move higher, those pressures could become increasingly difficult to overcome.
Reflecting that changing balance, our Asset Allocation Committee has recently begun trimming its exposure to U.S. small-cap stocks.
5947615-202610
Through the first half of 2026, U.S. small‑cap stocks had an exceptional run. But since the end of June, that momentum has reversed.
From June 30, 2025, through June 30, 2026, the S&P SmallCap 600 Index (S&P 600) returned roughly 38%, while the Russell 2000 gained more than 40%. Since then, both indexes have fallen around 6% to 8% through October 27, 2026.
So what changed?
The answer appears to be a combination of persistently high interest rates and signs that small‑cap earnings growth may be approaching a peak.
Small-caps are especially vulnerable to higher interest rates for two reasons.
Small‑caps are especially vulnerable to higher interest rates for two reasons. First, smaller companies carry considerably more leverage than their large‑cap counterparts. Second, the small‑cap universe has greater exposure to rate‑sensitive areas of the economy, including housing, financials, and other traditional cyclical industries.
The gap with large‑caps has widened
The balance‑sheet vulnerability has increased substantially over time. In 2010, total debt represented roughly 25% of assets for the S&P 600, compared with about 28% for the S&P 500. Today, small‑cap leverage has risen to approximately 39%, while large‑cap leverage remains close to where it was 16 years ago.
Turn of fortune for small‑cap stocks
(Fig. 1) U.S. small-cap equity performance
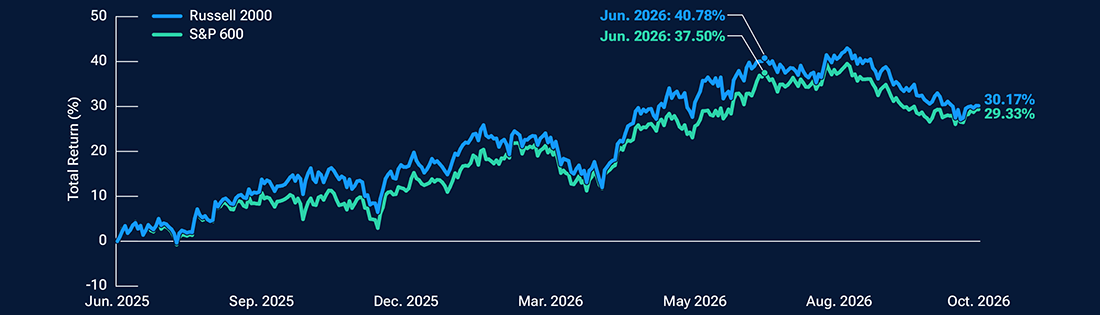
June 30, 2025 to October 27, 2026.
Past performance is not a guarantee or a reliable indicator of future results.
Source: T. Rowe Price analysis using data from FactSet Research Systems Inc. All rights reserved.
That higher debt burden has made financing costs increasingly important. Interest coverage for the S&P 600 has deteriorated to a little over four times interest expense. For the S&P 500, coverage is nearly 13 times. That leaves smaller companies with considerably less room to absorb persistently high borrowing costs as existing debt gradually reprices.
(Fig.2) Small‑cap stocks are highly levered
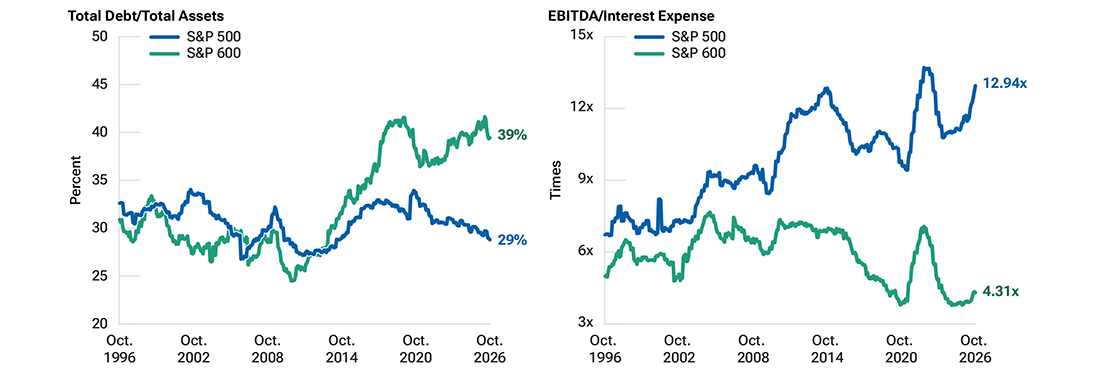
30 years ending October 27, 2026.
EBITDA = Earnings Before Interest, Taxes, Depreciation, and Amortization.
Source: T. Rowe Price analysis using data from FactSet Research Systems Inc. All rights reserved.
Valuations have moved inversely to yields
The market has historically reflected this balance‑sheet sensitivity through lower valuations when interest rates rise. Since 2014, the correlation between the 10‑year Treasury yield and the S&P 600’s forward price‑to‑earnings ratio has been approximately –0.6. Put simply, higher yields have generally been associated with lower small‑cap valuation multiples.
That relationship makes sense. When financing costs rise, investors demand a lower price for companies that carry more debt and have less capacity to absorb the added expense.
Rising rates drag valuations lower
(Fig. 3) 10‑Year Yield vs. S&P 600 Forward P/E (Inverted)
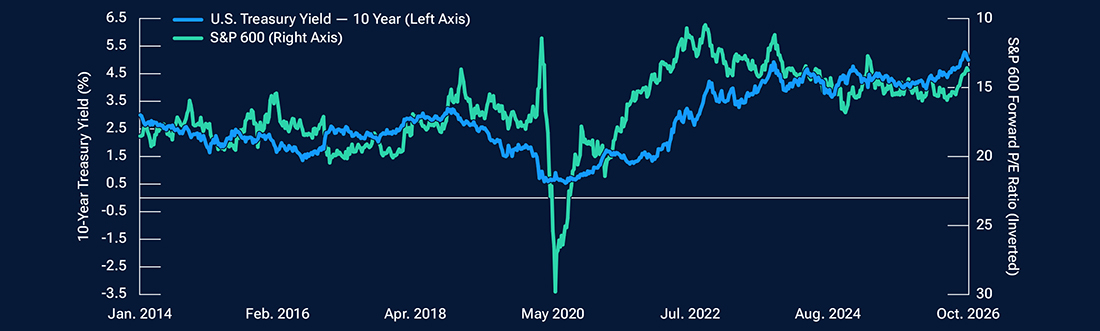
Weekly, January 3, 2014 to October 23, 2026.
Correlation since 2014: Approximately –0.6.
The 10‑year U.S. Treasury yield represents the yield to maturity. Forward price‑to‑earnings (P/E) ratio is calculated by dividing the current share price by estimated earnings per share over the next 12 months, using consensus earnings estimates. Future outcomes may differ, perhaps materially.
Source: T. Rowe Price analysis using data from FactSet Research Systems Inc. All rights reserved.
So the valuation pressure we are seeing today is not a separate issue. It is one of the ways higher rates and greater leverage are being reflected in small‑cap prices.
Earnings did the heavy lifting
For much of 2025 and the first half of 2026, small‑caps were able to overcome that pressure because earnings were improving rapidly.
Earnings estimates had been climbing steadily since mid‑2023, and actual earnings delivery also improved. In recent months, small‑cap companies have even been beating the expectations that analysts had set a year earlier. That fundamental strength helped offset the drag from higher interest rates and supported strong equity returns.
The concern now is that this earnings tailwind may be beginning to fade.
The concern now is that this earnings tailwind may be beginning to fade. Forward 12‑month earnings growth expectations for the S&P 600 reached roughly 19% in early July but have since declined to about 17%.
The risk: Pressure from both sides
Actual earnings remain healthy, but the question is whether that can continue if higher rates increasingly slow activity in the parts of the economy where small‑caps are most exposed.
If earnings growth continues to moderate while rates remain elevated, small‑caps could face pressure from both sides: Weaker earnings growth and lower valuation multiples.
Earnings growth may be peaking
(Fig. 4) EPS Growth—S&P 600
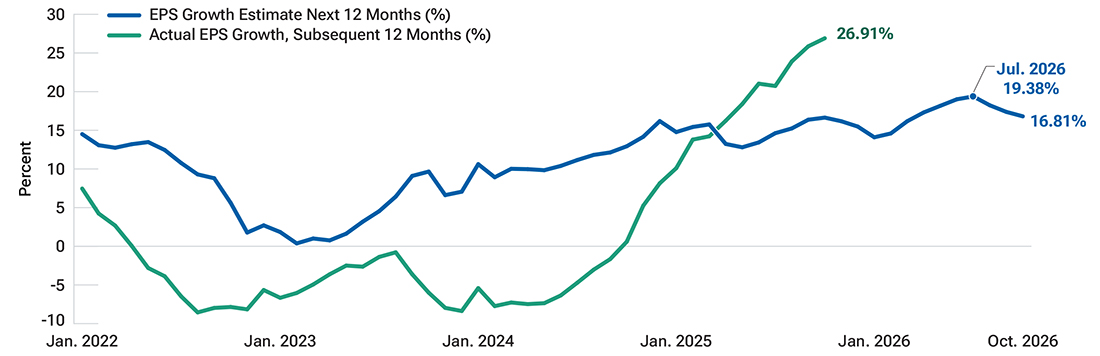
January 2022 to October 27, 2026.
Earnings Per Share (EPS) growth estimates are based on consensus estimates. The last plotted earnings estimates are as of October 2026 and represent estimates through October 2027. Actual outcomes may differ materially from estimates.
Actual EPS growth is historical growth but shown 12 months subsequent to the date plotted. For example, the last plot shown of 26.91% growth is plotted as of October 2025 but represents the growth for the 12‑month period ending October 27, 2026..
Source: T. Rowe Price analysis using data from FactSet Research Systems Inc. All rights reserved.
Conclusion
We are not yet convinced that this more difficult scenario will fully materialize. Small‑cap earnings remain healthy, and valuations have already adjusted considerably from their midyear highs.
However, the backdrop has become less favorable. Small‑caps are carrying significantly more leverage than they have historically. Meanwhile, interest coverage has deteriorated, and the earnings acceleration that previously offset higher rates appears to be moderating.
If rates continue to move higher, those pressures could become increasingly difficult to overcome. Reflecting that changing balance, our Asset Allocation Committee has recently begun trimming its exposure to U.S. small‑cap stocks.
 Timothy C. Murray, CFA
Capital Markets Strategist

- Oct 2026
- From the Field
How far will the Fed go?

Contact us
Additional Disclosures
For U.S. investors, visit troweprice.com/glossary for definitions of financial terms.
Please see vendor indices for more information, including definitions and source data: troweprice.com/marketdata.
Important Information
This material is being furnished for informational and/or marketing purposes only and does not constitute an offer, recommendation, advice, or solicitation to sell or buy any security.
Prospective investors should seek independent legal, financial and tax advice before making any investment decision. T. Rowe Price group of companies including T. Rowe Price Associates, Inc. and/or its affiliates receive revenue from T. Rowe Price investment products and services.
Past performance is not a guarantee or a reliable indicator of future results. All investments involve risk, including possible loss of principal.
Information presented has been obtained from sources believed to be reliable, however, we cannot guarantee the accuracy or completeness. The views contained herein are those of the author(s), are as of November 2026, are subject to change, and may differ from the views of other T. Rowe Price Group companies and/or associates. Under no circumstances should the material, in whole or in part, be copied or redistributed without consent from T. Rowe Price.
All charts and tables are shown for illustrative purposes only. Actual future outcomes may differ materially from any estimates or forward‑looking statements provided.
The material is not intended for use by persons in jurisdictions which prohibit or restrict the distribution of the material and in certain countries the material is provided upon specific request.
Issued in the USA by T. Rowe Price Investment Services, Inc., distributor and T. Rowe Price Associates, Inc., investment adviser, 1307 Point Street, Baltimore, MD 21231, which are regulated by the Financial Industry Regulatory Authority and the U.S. Securities and Exchange Commission, respectively.
© 2026 T. Rowe Price. All Rights Reserved. T. Rowe Price, INVEST WITH CONFIDENCE, the Bighorn Sheep design, and related indicators (see troweprice.com/ip) are trademarks of T. Rowe Price Group, Inc. All other trademarks are the property of their respective owners. Use does not imply endorsement, sponsorship, or affiliation of T. Rowe Price with any of the trademark owners.
- 202611‑6051264