
Outsmart conventional planning to extend retirement income by up to 7 years for your clients
April 2026, Practice Management
- Key Insights
-
- Coordinating Social Security strategies, variable spending, Medicare premiums, tax-loss harvesting, and tax-efficient withdrawals across accounts are among the most complex challenges advisors face—especially given the irregular cash flows of retirement. Delivering a solution sets advisors apart as trusted retirement experts, driving practice growth.
- Income Solver empowers advisors to stand out by replacing "set-it-and-forget-it" fixed methods with multidimensional withdrawal strategies that apply variable drawdown sequences during different phases of retirement, which can unlock greater value for many clients, especially for mass-affluent and high-net-worth clients.
- In this article, we (“we” will refer to the authors throughout this paper) will summarize two cases that illustrate the substantial value that an advisor can add to clients’ accounts by using a multidimensional withdrawal strategy identified by Income Solver. By recommending this strategy and addressing multiple phases of retirement, with a separate threshold for each phase, advisors could see better results than they would from conventional strategies recommended by leading financial services software—garnering an additional $1 million-plus of after-tax wealth for a retired household with a $4.5 million portfolio and nearly seven years of additional funded retirement.
Income Solver®—a multidimensional withdrawal strategy
Our innovative software uses advanced analysis to identify a strategy to help clients maximize the value of their financial accounts, while reducing taxes. Thus, it sets a new standard for retirement planning. The Income Solver engine integrates numerous components to determine how much a client should withdraw from each account each year to fund their spending goals:
- Social Security optimization
- Integration of other income sources (pensions, annuities, part-time work)
- Tax-efficient withdrawals
- Opportunistic Roth conversions during favorable tax years
- Household-level asset location for greater tax efficiency
- Smart rebalancing to reduce capital gains and maintain target asset allocation
Income Solver identifies a multiphase withdrawal strategy, where each phase may use a different withdrawal sequence to a different threshold level.
A threshold level represents the upper limit for withdrawals or Roth conversions in a given year. Frequently, a tax bracket serves as a threshold level, helping the client avoid crossing into a higher bracket and triggering a tax hike. In retirement, tax brackets are only one of several critical thresholds. Others include (1) the income range subject to additional Social Security taxation and (2) income levels where spikes in a Medicare premium kick in (i.e., Income Related Monthly Adjustment Amounts, or IRMAAs). Each of these threshold levels is based on a different measure of income, making it easy to unintentionally trigger higher Social Security taxes or Medicare surcharges two years later. Phases represent time segments within the plan, with each phase having a specific withdrawal order and threshold target. Later phases may vary both the withdrawal sequence and the threshold applied. This approach with variable phases and thresholds reduces taxes and gives the power to retirees to retain more of their own money compared with the other retirement tools that apply one withdrawal sequence for a household over the plan time horizon.
Comparing approaches with retirement income strategies
The strategies outlined below include both long-established methods and newer industry approaches designed to help retirees manage the complexities of generating income in retirement. Some are incorporated into general financial planning tools, while others are available only through specialized retirement software. Conventional wisdom. In this strategy, a household withdraws funds from one account at a time to meet their spending goal: taxable accounts first, then taxdeferred accounts (e.g., Traditional IRAs), and then tax-exempt accounts.
Conventional wisdom. In this strategy, a household withdraws funds from one account at a time to meet their spending goal: taxable accounts first, then taxdeferred accounts (e.g., Traditional IRAs), and then tax-exempt accounts.
Proportional. In this strategy, each year, we create ratios of the client’s taxable, tax-deferred, and tax-exempt accounts to the total value of all their financial accounts. Withdrawals are made each year based on these ratios.
Multiple accounts using average tax rates. Here, the household withdraws funds from both taxable accounts and taxdeferred accounts to cover spending up to an average tax rate every year. The system finds the optimal average tax rate and uses it each year to determine the amount to withdraw from each account.
Multiple accounts to a tax bracket. Here the household withdraws funds from taxdeferred accounts and then other accounts each year to cover spending, while hitting the top of a chosen tax bracket for all years of the strategy.
The Income Solver withdrawal strategy. This is where we apply a multidimensional withdrawal strategy, with each phase using a withdrawal strategy to a distinct, varied threshold. By having a separate threshold for each phase of retirement, the strategy adds value because it exploits the rising and falling pattern of marginal tax rates in retirement that comes from the taxation of Social Security benefits and incomebased Medicare premiums (i.e., IRMAAs). In addition, the early-year Roth conversions may reduce the household’s lifetime IRMAAs. By contrast, the “conventional wisdom” withdrawal strategy, which is recommended by leading financial services software, and the “proportional” withdrawal strategy, which is recommended by other software, ignore the rising and falling pattern of marginal tax rates. Lastly, incorporating asset location enhances withdrawal decisions by strategically rebalancing across all household accounts to maintain target asset allocation, rather than rebalancing each account individually.
Thus, with rare exception, the conventional wisdom and proportional withdrawal strategies fail to maximize the after-tax value of a household’s financial portfolio.
Two case studies applying the same retirement income approaches
Income Solver’s methodology—known as multidimensional withdrawal strategies— applies iterative, variable-phase analysis to optimize outcomes for clients approaching or in retirement. The Income Solver withdrawal strategies integrate and optimize a withdrawal sequence that incorporates Roth conversions, defined phases and thresholds (such as tax brackets, IRMAA tiers, and marginal tax rates), and asset-location logic that utilizes household level rebalancing— delivering added value through a uniquely orchestrated approach that surpasses the capabilities of standard solutions.
This article uses two case studies that demonstrate the potential after-tax value of the multidimensional withdrawal strategy used by Income Solver compared with conventional wisdom and other withdrawal strategies that are frequently recommended by other financial firms. Income Solver is a personalized planning tool that is available to financial advisors through the T. Rowe Price website.
The Income Solver strategy exploits the rising and falling pattern of marginal tax rates in retirement.
Key assumptions
For each of the industry-method strategies described above and applied to both case studies, we assume the household rebalances each account to the target asset allocation every year. Next, we calculate the total value of each strategy, where “total value” is the sum of lifetime spending, which requires after-tax dollars, plus the after-tax value of funds inherited by heirs, where the remaining tax-deferred account balances are reduced by 25% to reflect an estimate of their embedded tax liability. Both cases apply strategies.
We then calculate the extra value that is available by rebalancing at the household level using asset location. This assetlocation logic allocates stocks to taxable accounts and then to tax-exempt accounts to the degree possible, while attaining the portfolio’s target asset allocation. Note: All strategies maintain the same asset allocation.
To illustrate how the Income Solver withdrawal strategy could add value to a hypothetical household’s financial portfolio, we present two case studies:
- Case 1: High-net-worth household with a $4.5 million portfolio. This is based on the 90th percentile household starting portfolio from over 5,700 Income Solver cases generated by a retail advisory service offered by one of our affiliates.
- Case 2: Mass-affluent household with a $2.25 million portfolio. This is based on the average household starting portfolio from over 5,700 Income Solver cases generated by a retail advisory service offered by one of our affiliates.
- The average portfolio breakdown: 33% taxable, 60% tax-deferred, 7% tax-exempt (i.e., Roth).
- Married couples who are age 60, live to 95, claim Social Security at age 70, and affected by the Tax Cuts and Jobs Act expiring in 2026
Defining the client profiles for two cases
In both cases, we use two key levers to maximize the after-tax value of their portfolios:
- a multiphase withdrawal strategy, where each phase has a withdrawal sequence that may include Roth conversions and
- the asset-location logic, which includes rebalancing at the household level instead of at the account level.
In both cases, the Income Solver withdrawal strategy added more value than the other approaches reviewed.
| Client Profile | Portfolio Value |
Social Security (PIAs)* |
Real Spending |
|---|---|---|---|
| Case 1: High Net Worth | $4,500,000 | $3,500 and $3,000 | $19,000 per month |
| Case 2: Mass-affluent | $2,250,000 | $3,500 and $2,500 | $10,000 per month |
*Primary insurance amounts.
In both cases, the Income Solver withdrawal strategy added more value than the other approaches reviewed.
Case 1: High-net-worth couple with a $4.5 million portfolio
In this case, we compare the different approaches. When compared with the conventional wisdom withdrawal strategy with account-level rebalancing, the Income Solver withdrawal strategy added up to $1,036,323 in after-tax value. By adding the household rebalancing with asset location, Income Solver identified another $479,037, for a total after-tax value added of $1,515,360.
Figure 1/Case 1: High-net-worth couple summary
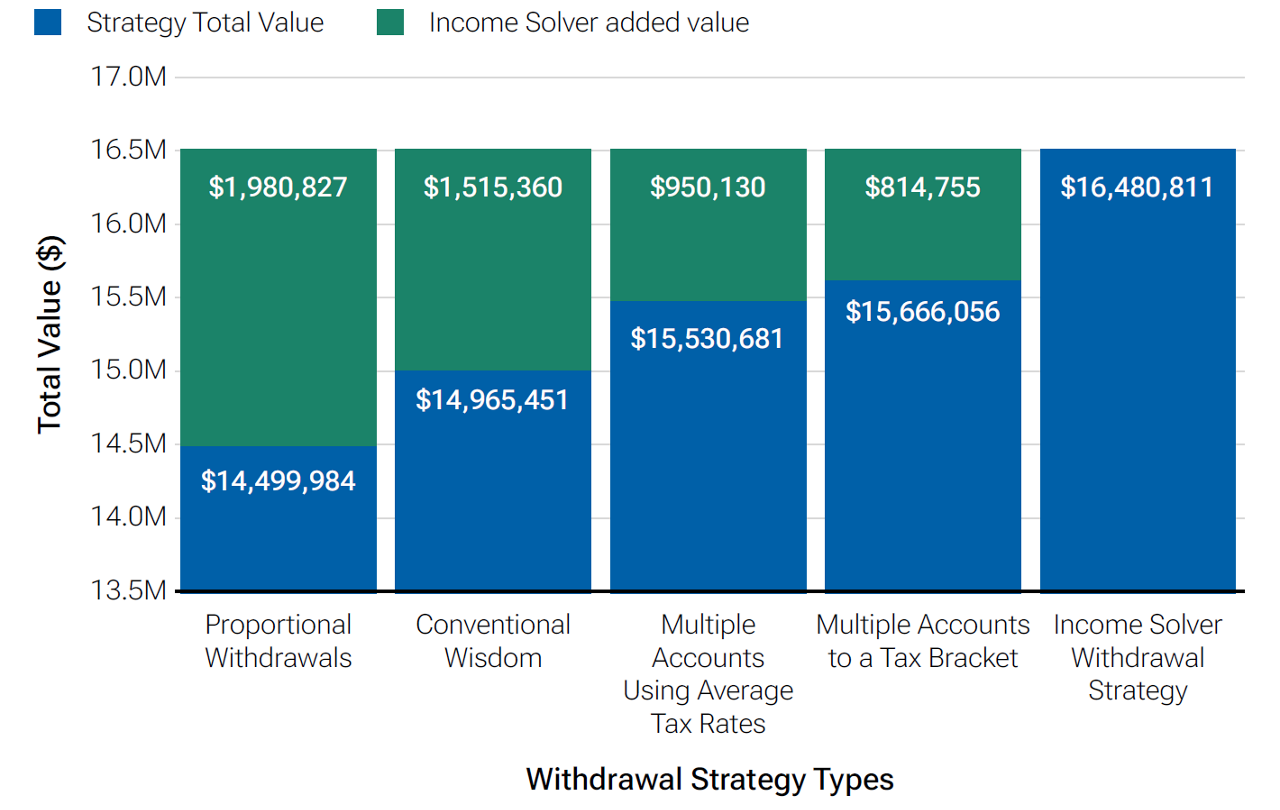
Figure 1 shows the value added using the Income Solver strategy compared with the other withdrawal strategies. For example, compared with the withdrawal strategy to a single tax bracket, the multidimensional withdrawal strategy can add up to $335,718 of after-tax value. By also doing the household-level rebalancing with asset location, Income Solver identified another $479,037 of value, for total after-tax value added of $814,755.
High-net-worth couple summary
— The multidimensional withdrawal strategy identified by Income Solver added $1,036,323 in after-tax value compared with the conventional wisdom strategy
- Resulting in 4.5 additional years of income over conventional wisdom (at $19,000/month in real spending)
— Household rebalancing with asset location added another $479,037 in total value
- Total after-tax value: $1,515,360
- Resulting in 6.6 additional years of income over conventional wisdom (at $19,000/month in real spending)
Why does the Income Solver approach project more portfolio value? Because single account withdrawals using the conventional wisdom strategy neglect the client’s opportunity to withdraw up to strategic thresholds and avoid spikes in marginal tax rates due to the taxation of Social Security benefits, Medicare IRMAAs, and required minimum distributions. Making withdrawals from both taxable and tax-deferred accounts with partial Roth conversions using the optimal average tax rate of 23% is better than the conventional wisdom strategy, but it is far from the optimal strategy. Making tax-deferred account withdrawals and Roth conversions to fill the 24% tax bracket each year performed slightly better. (Note: Using a single threshold, such as an average rate or a tax bracket over the entire planning horizon, added considerably less value than Income Solver's multidimensional strategy.)
There is an opportunity to change how the client withdraws over specific phases to different thresholds. In this case, in the early years, the client makes withdrawals from taxable accounts to meet his spending needs. Since taxable account withdrawals are usually largely tax-free withdrawals, if the client made no additional withdrawals, the client would be in a relatively low tax bracket. The client then makes Roth conversions to fill relatively low tax brackets in these early years. Then, in later retirement years, when the client’s required minimum distributions kick in, they may withdraw funds from their tax-deferred accounts to the top of the 15% tax bracket and then withdraw tax-free Roth funds to meet the rest of their spending needs. The strategy identified by Income Solver can also help the household minimize their lifetime Medicare IRMAAs. The takeaway is that by actively changing the withdrawal sequence, they can add after-tax value to the client’s accounts. Additional value can also be found when the household rebalances using asset-location logic to rebalance strategically across the household’s multiple accounts, while attaining the target asset allocation.
Case 2: A mass-affluent couple with a $2.25 million portfolio
In the second case, we again compare the different approaches. Compared with the conventional wisdom withdrawal strategy with account-level rebalancing, the Income Solver withdrawal strategy added up to $804,221 in after-tax value. By adding the household-level rebalancing with asset location, Income Solver identified another $256,886 of value, for a total after-tax value added of $1,061,107.
Figure 2/Case 2: Mass-affluent couple summary
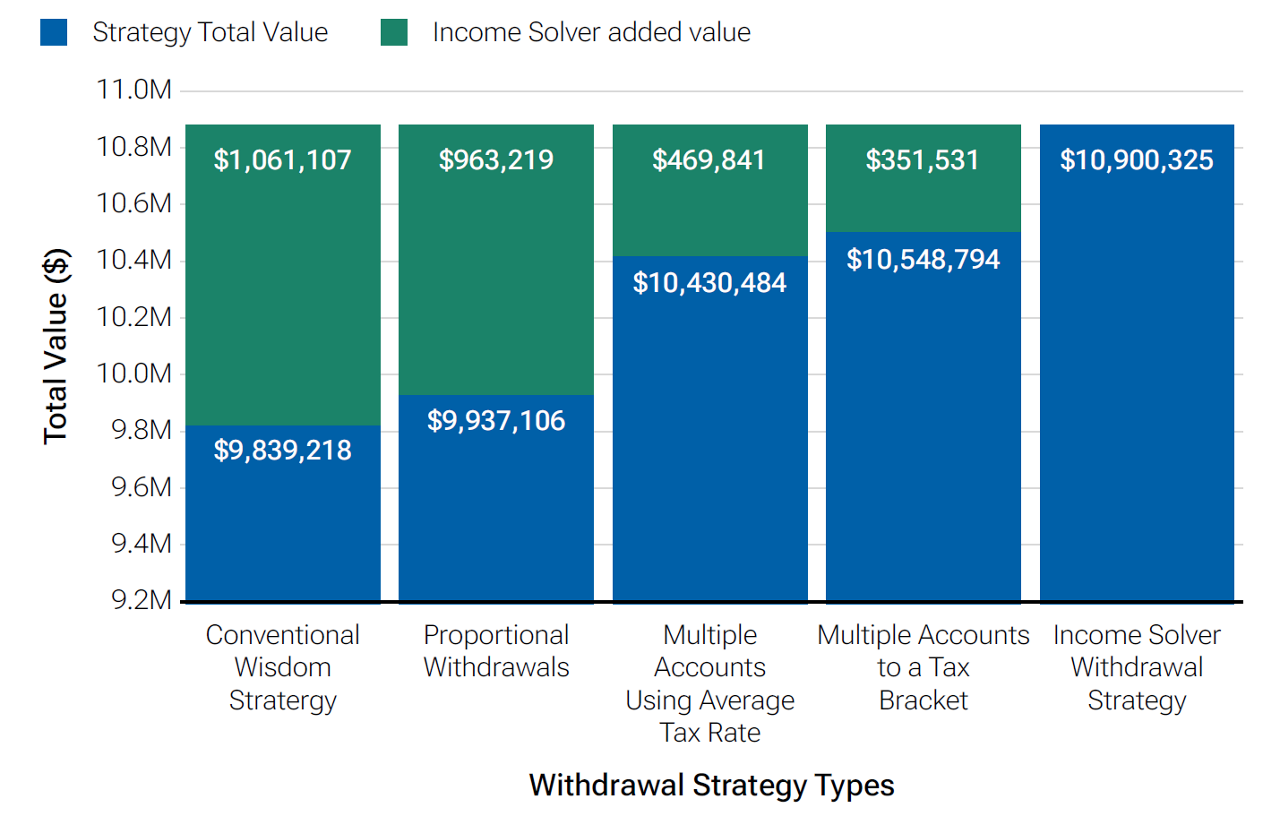
Figure 2 shows the values added compared with the other withdrawal strategies. For example, compared with the withdrawal strategy to a single tax bracket, the multidimensional withdrawal strategy added up to $94,645 of after-tax value. By adding the household-level rebalancing with an asset-location strategy, Income Solver identified another $256,886 of added value, for total after-tax value of $351,531.
Mass-affluent couple summary
— The Income Solver withdrawal strategy added $804,221 in after-tax value compared with the conventional wisdom withdrawal strategy
- Resulting in 6.7 additional years of income over conventional wisdom (at $10,000/month in real spending)
— Household-level rebalancing with asset location added an additional $256,886
- Total after-tax value: $1,061,107
- Resulting in 8.8 additional years of income over conventional wisdom (at $10,000/month in real spending)
As we did in the first case, we found more value by strategically changing the withdrawal sequence over time. Other strategies would underperform significantly if we apply a single threshold, like an average tax rate or tax bracket, to all retirement years. We consider this to be a “set-it-and-forget-it” approach for managing the decumulation years. In contrast, we consider a three-phase withdrawal strategy. In phase one, the household makes partial Roth conversions to below the second modified adjusted gross income (MAGI) threshold. In phase two, which begins in 2026, the clients withdraw funds from multiple accounts so that their average tax rate does not exceed 12%. In the third phase, which begins in 2035, they withdraw funds from their tax-deferred accounts to the top of the 10% bracket and then make tax-exempt account withdrawals to meet the rest of their spending needs. You can see that the optimal withdrawal level approach added hundreds of thousands more in after-tax value. This process is personalized and easy to explain as key changes in the withdrawal sequence align to key phases in the client’s life.
Income Solver: A powerful tool to generate multidimensional withdrawal strategies for clients
Income Solver is a powerful planning tool designed to help advisors deliver truly personalized, research-driven retirement strategies to their clients. The platform guides advisors through a streamlined planning process, evaluating tens of thousands of drawdown strategies to identify the most tax-efficient strategy for each household. Income Solver addresses uneven cashflows typical in retirement by iterating across variable time phases and recalibrating optimal thresholds for each phase through multidimensional analysis, cumulatively solving for the most favorable outcomes over the client’s lifetime. The tool employs an advanced, proprietary methodology to help clients optimize Social Security benefits and reduce tax drag, which typically allows the client’s financial portfolio to meet their spending needs for several years longer than it would last if they adopted a typical financial planning withdrawal approach.
The need for retirement income advice

1 T. Rowe Price, 2023 Retirement Savings and Spending Study. Based on workers age 50+ or retirees.
2 EBRI Retirement Confidence Survey, 2024.
3 T. Rowe Price Retirement Savings and Spending Study, 2023. Preretiree is defined as 5 years or more from retirement.
Conclusion and advisor implications based on case analysis
- Advisors can add between $1 million and $1.5 million in after-tax value for mass-affluent clients by adopting a multidimensional withdrawal and asset-location strategy, which may exceed the value added that is typically available from leading financial planning software.
- Tools like Income Solver can help advisors efficiently model and compare strategies, including Social Security claiming, account/household rebalancing, and withdrawal sequence optimization.
- Income Solver complements core planning software. It works alongside leading financial planning software like MoneyGuide and eMoney, leveraging existing client cash flow and investment data for a holistic planning experience.
The data used in this white paper
This paper focuses on two cases illustrating the differences between Income Solver and other planning software. It should be noted that many respected financial journals have published articles presenting similar retiree scenarios, producing comparable results based on the strategies and methods discussed in this paper. This analysis draws on data from over 5,700 households that have used Income Solver via a retail advisory service offered by one of our affiliates. For the purposes of this white paper, we focus on the $2.25 million mass-affluent and $4.5 million highnet- worth examples. Each household’s assets under management (AUM) were categorized into taxable, tax-deferred, and tax-exempt segments. For our evaluation, we selected two representative AUM profiles: the 50th percentile ($2.25 million, mass-affluent), the 90th percentile ($4.5 million, high net worth). In this study, the Income Solver strategy allowed a hypothetical household's portfolio to last up to 8.8 years longer than it would have lasted with a more conventional strategy. All households used for analysis assumed moderate market returns with a 60/40 stocks/bonds ratio across accounts and with spending levels and Social Security PIAs estimated as appropriate for each household asset band. Although these cases assume the TCJA tax law with its projected expiration, Income Solver can also model alternative tax environments, such as the One Big Beautiful Bill Act or scenarios with gradually rising tax rates over time. While individual results may vary depending on the assets held, spending needs, and life expectancy, the examples provided in this analysis are indicative of the households that have been analyzed with the tool by their financial professional. The retirement income projections or other information regarding the likelihood of various outcomes used in this study are hypothetical in nature, do not reflect actual results, and are not guarantees of future results. The study is based on certain assumptions, and there can be no assurance that the projected results will be achieved or sustained. Actual results will vary over time, depending on changes to inputs or updates to the underlying assumptions, and such results may be better or worse than the results shown. You should be aware that the potential for retirement income shortfalls may be greater than demonstrated in the study.
 William Reichenstein, Ph.D.
Thought Leadership Director
William Reichenstein, Ph.D.
Thought Leadership Director
 William Meyer
Head of Retiree, Inc.
William Meyer
Head of Retiree, Inc.
See the Income Solver advantage—and get trial access

Contact us
- 202601-5100325