

Volatility Can Create Outperformance Opportunities for Active Managers
Most people hate, and even fear, volatility, according to psychologists. We crave order, certainty, and the feeling of being in control. The uncertainty created by volatility can lead to poor decision making. Investment markets are a good example of this behavior. We often place big premiums on expectations of certainty and consistency, and large discounts on uncertainty and variability. Investors often go to great lengths to avoid volatility and possible downside risks, sometimes spending countless hours devising ways to remove or reduce it by seeking out investments or products that purportedly display lower volatility. However, this can sometimes lead to investment in very risky unlisted (or unregulated) assets or even to scams such as the US$65 billion size fraud of Bernie Madoff ’s Ponzi scheme.*
It’s important to keep in mind that there is an upside to volatility. If indeed we are in a structurally lower-growth world, where macro risks remain elevated, volatility will be higher than in the past. This will most likely also mean that the dispersion of investment returns will rise. This type of environment creates a fertile opportunity set for active managers.
However, an opportunity set only creates the potential for outperformance—it is a necessary but not a sufficient condition. The key to success is the execution of an investment framework based on sound analysis. This paper explores these issues and ways in which we can take advantage of share price volatility.
VOLATILITY AND ACTIVE PORTFOLIO MANAGEMENT
Volatility simultaneously creates risks and opportunities. The main risk is a misjudgement of probabilities, which can lead to poor decision making and underperformance or, at worst, permanent capital losses from forced selling. In a nutshell, this is the risk of doing the wrong thing at the wrong time. On the other hand, volatility can create opportunities when the market misprices securities as a result of incorrect assessments of the issues and likely outcomes. Higher cross-sectional volatility can lead to a greater dispersion of returns and therefore creates the opportunity for outperformance for active managers.
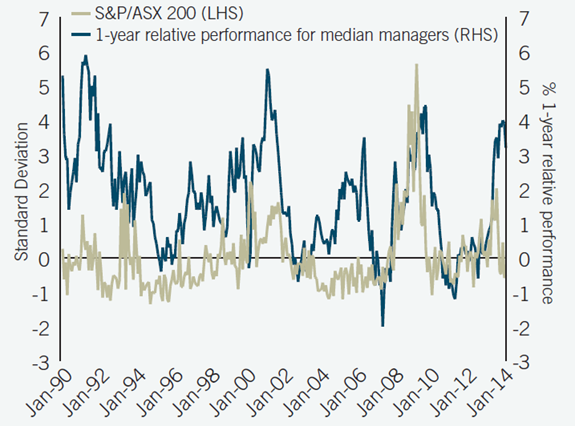
A good example of the relationship between higher cross-sectional volatility and active management returns was evident in 2013. As shown in the above chart, in 2013 cross-sectional volatility, as evidenced by the standard deviation of the S&P/ASX 200, reached some of the highest levels outside of the global financial crisis period. Unsurprisingly, the median active manager of Australian** equities outperformed the market by around 300 basis points for that year. As the blue line in the chart above suggests, this level of outperformance was achieved during periods of high volatility. So if higher volatility is here to stay, it makes sense to be active, not passive.
Figure 1: CROSS-SECTIONAL VOLATILITY
As at 31 January 2013
Sources: ASX, UBS, Mercer Manager Performance Analytics System
A good example of the relationship between higher cross-sectional volatility and active management returns was evident in 2013. As shown in the above chart, in 2013 cross-sectional volatility, as evidenced by the standard deviation of the S&P/ASX 200, reached some of the highest levels outside of the global financial crisis period. Unsurprisingly, the median active manager of Australian** equities outperformed the market by around 300 basis points for that year. As the blue line in the chart above suggests, this level of outperformance was achieved during periods of high volatility. So if higher volatility is here to stay, it makes sense to be active, not passive.
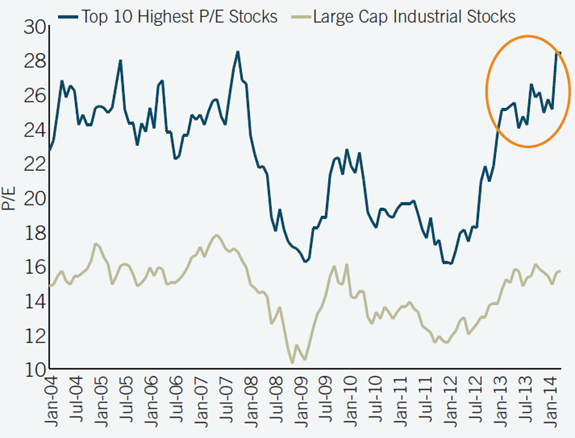
Figure 2: TOP 10 MOST EXPENSIVE INDUSTRIAL STOCKS
As at 31 January 2014
Sources: Goldman Sachs Global Investment Research, FactSet, I/B/E/S.
IS VOLATILITY RISK?
Because the relationship between volatility and risk has a range of different perspectives, only the end investor can answer this question according to how they define risk. With the advent of modern portfolio theory and the efficient markets hypothesis, it has now become common to think of volatility as risk. As an industry, we use sophisticated quantitative models to analyse share price movements and their relationships with each other and other variables or factors. In this context, investors think of and define risk as share price fluctuations around various averages or a mean. The higher the share price fluctuation, the higher the risk. One big drawback of this approach is that is it often backward looking, which can result in distortions when applied to a forward-looking market.
Another view of risk is the inability to meet your stated return objectives above inflation (CPI plus five percentage points, for example). Measurement timeframes are typically longer in this approach, and daily, monthly, and even yearly fluctuations don’t matter as much. The important thing is whether or not you achieve your objectives over a longer-term cycle. Another key factor in this approach to risk is the role that valuation plays when it comes to thinking about expected returns and allocating capital. Valuation risk is a major consideration and is probably the biggest risk investors face. Just ask anyone who bought technology stocks when the Nasdaq Composite Index was at 5,000 in March 2000.
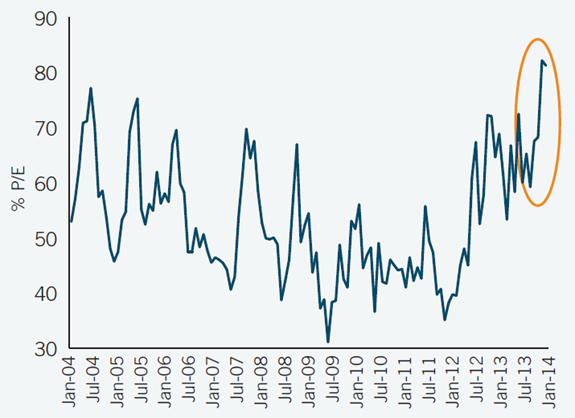
Figure 3: TOP 10 MOST EXPENSIVE INDUSTRIAL STOCKS
As at 31 January 2014
The average P/E of the ten most expensive industrial stocks is 80% above market—a new post dot-com peak
Sources: Goldman Sachs Global Investment Research, FactSet, I/B/E/S
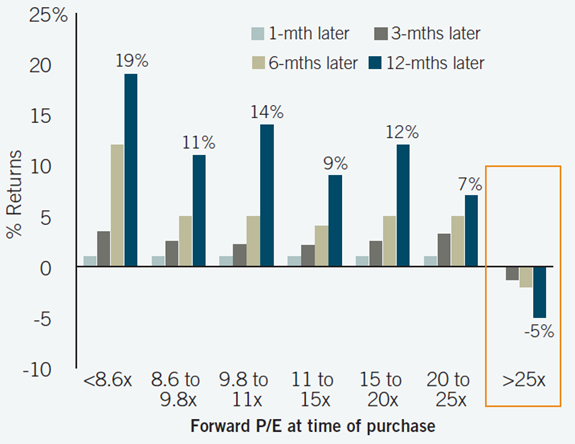
Recent analysis by Goldman Sachs bears this point out by showing just how overvalued the top 10 most expensive industrial companies in Australia are based on current multiples. This considers stocks with an average trading volume of more than $2 million per day. These 10 stocks trade at an average one-year forward price-to-earnings (P/E) multiple of 28—refer to Figure 2. If we look at the 10 most expensive stocks across the ASX 200, they trade at an average P/E of 80% above market which is a new post dot-com peak—refer to Figure 3. The analysis in Figure 4 points out that for the period January 2001 through to February 2014, stocks with a P/E greater than 25x have lost 5% in the following year, compared with a 10% average gain for the rest of the market. Buying these same stocks on a P/E multiple of more than 25x required a 2 to 3 year holding period to recover losses, and the stock still under-performed on average—refer to Figure 5. The obvious point is that as multiples rise, so does valuation risk—the higher the multiple, the lower the expected return.
Figure 4: BUYING EXPENSIVE STOCKS
As at 28 February 2014
Buying a stock on >25x P/E has tended to generate a loss of 5% over the following year. Returns generated conditional on P/E at time of purchase.
Sources: Goldman Sachs Global Investment Research, FactSet, I/B/E/S.
Figure 5: BUYING EXPENSIVE STOCKS
As at 28 February 2014
Buying on >25x required 2-3-year holding period to recover losses and the stock still underperformed on average. Returns measured since 2001.
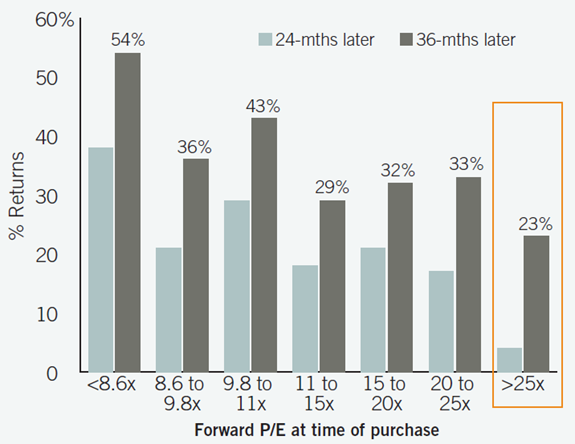
Sources: Goldman Sachs Global Investment Research, FactSet, I/B/E/S.
PROFITING FROM VOLATILITY
As already shown in Figure 1, it makes sense to be active rather than passive in periods of higher volatility. But which active managers should you choose, and why? Active managers that have the potential to perform best are those with experienced investment teams that have seen many business cycles, a well-structured investment process, and an information or organisational advantage. The investment process needs to have a strong focus on fundamentals to form accurate assessments of probabilities. It needs to be structured to take advantage of over and under-reaction to share price movements, and valuation needs to play a central role.
Let’s start with the investment fundamentals. The aim here is to have a good understanding of a company’s business, industry, competitive position, and pricing power to determine the likely path of earnings and returns. The manager should also be able to form an analysis of other possible outcomes using detailed sensitivity analysis on key assumptions. This provides a “cone” of expected outcomes and probabilities. This approach gives the portfolio manager the ability to compare the range of outcomes with the imputed share price at a particular point in time, and enables the manager to identify incorrect perceptions of probabilities factored by the market.
To take advantage of market overreaction, a portfolio manager needs to understand what drives it. The most obvious behavioural factor is short-termism. The best way to take advantage of this is to have a longer term view of probabilities that comes from understanding business and industry cycles. Herding is also common behaviour, with the best example being the fascination with the consensus view. Investors like to crowd around a consensus view rather than be different from the pack. This can create opportunities when group-think dominates —for example, think of the consensus market view on iron ore at the start of 2013. The consensus view was that Chinese steel production would grow between 2% and 3% (insufficient to absorb new supply) and the iron price would fall to US$90 per ton in the third quarter of 2013 due to seasonal factors. Actual steel production growth for the year turned out to be 7% to 8% and the iron ore price rose to between US$125 and $130 in the third quarter. As a result, iron ore names outperformed the market.
Figure 6: QUALITY STOCKS TENDED TO BE LESS VOLATILE
Observation period: January 2011 - December 2013
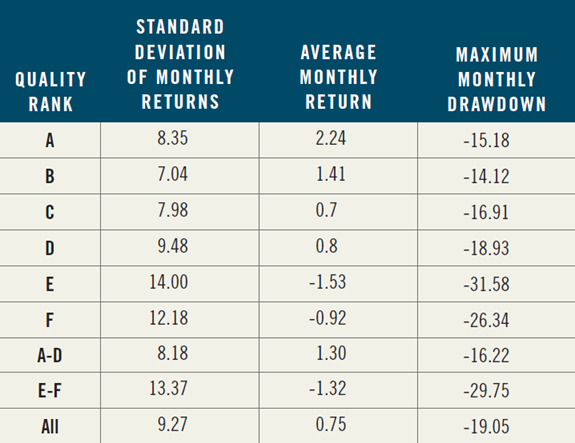
Source: T. Rowe Price
In any good investment process, valuation should play a central role not only to protect against valuation risk but also as a key mechanism to allocate capital between competing opportunities. As previously mentioned, it is very important to understand that valuation risk rises as multiples expand. As shown in Figure 5, the odds of making money when owning stocks with a P/E greater than 25 in the Australian market are low.
OUR BUSINESS QUALITY ASSESSMENT
The T. Rowe Price proprietary Business Quality Assessment framework groups companies into six categories based on return on capital and future growth prospects.
QUALITY STOCKS TENDED TO BE LESS VOLATILE
As investors in quality growth companies, we have undertaken extensive research to understand the risk/ return characteristics of these stocks. In previous articles we have spoken about the excess return potential of quality stocks as defined by returns and earnings growth. Our analysis, which was based on the entire universe of companies in the S&P/ASX 200 Index, has also shown that quality stocks, as defined by the T. Rowe Price Business Quality Assessment process, have also been lower-risk stocks. As shown in the table to the left, these stocks are lower-risk whether you want to think about risk in terms of share price volatility or a more investor-specific definition, such as ability to meet specific return objectives. Our analysis showed that high-quality stocks (quality rated A-D) have had a lower standard deviation of monthly returns (or share price movements) than low-quality stocks (quality rated E-F). The maximum monthly drawdown (monthly peak to trough share price movement) has also been lower for high-quality equities. As the table also shows, the average monthly return of quality stocks (A-D) has been positive and much higher than that of low quality stocks (E-F).
T. ROWE PRICE LOOKS FOR OPPORTUNITIES TO BENEFIT FROM VOLATILITY
Investors should not fear volatility because it creates opportunities for outperformance. Often share price movements don’t accurately reflect investment probabilities—they are overreactions resulting from misplaced perceptions. Higher-volatility environments have proven to be good for active managers, so if the recent trend toward higher volatility continues it makes sense to be active.
Investing is about assessing fundamentals and accurately determining probabilities. Our well-designed investment process assists us to do this. At the individual security level, we look for opportunities to benefit from volatility by either taking advantage of overreactions or by anticipating improvements in or deterioration from historical levels. This occurs when fundamental risk, which can be operational or financial, is changing. By anticipating changes in security or industry volatility, we can build more- robust investment portfolios in terms of overall volatility, achieving better risk/return dynamics. We can also do this structurally by investing in quality stocks, which our analysis shows offer lower-risk and higher-return characteristics.
重要情報
当資料は、ティー・ロウ・プライス・アソシエイツ・インクおよびその関係会社が情報提供等の目的で作成したものを、ティー・ロウ・プライス・ジャパン株式会社が翻訳したものであり、特定の運用商品を勧誘するものではありません。また、金融商品取引法に基づく開示書類ではありません。当資料における見解等は資料作成時点のものであり、将来事前の連絡なしに変更されることがあります。当資料はティー・ロウ・プライスの書面による同意のない限り他に転載することはできません。
資料内に記載されている個別銘柄につき、売買を推奨するものでも、将来の価格の上昇または下落を示唆するものでもありません。また、当社ファンド等における保有・非保有および将来の組入れまたは売却を示唆・保証するものでもありません。投資一任契約は、値動きのある有価証券等(外貨建て資産には為替変動リスクもあります)を投資対象としているため、お客様の資産が当初の投資元本を割り込み損失が生じることがあります。
当社の運用戦略では時価資産残高に対し、一定の金額までを区切りとして最高1.265%(消費税10%込み)の逓減的報酬料率を適用いたします。また、運用報酬の他に、組入有価証券の売買委託手数料等の費用も発生しますが、運用内容等によって変動しますので、事前に上限額または合計額を表示できません。詳しくは契約締結前交付書面をご覧ください。
「T. ROWE PRICE, INVEST WITH CONFIDENCE」および大角羊のデザインは、ティー・ロウ・プライス・グループ、インクの商標または登録商標です。
ティー・ロウ・プライス・ジャパン株式会社
金融商品取引業者関東財務局長(金商)第3043号
加入協会:一般社団法人日本投資顧問業協会/一般社団法人投資信託協会
