
Why the AI capex cycle has now become an economic cycle
November 2026, Equity
- Key Insights
-
- The AI capital expenditure (capex) cycle has grown larger than anyone forecast and outrun even mega‑cap tech companies’ cash flow. Credit is now filling the gap, and the cycle’s effects reach well beyond technology into interest rates and credit markets.
- The post‑crisis era of abundance has given way to an era of scarcity. AI needs far more physical capital than the “cloud” ever did, and that demand is crowding out other uses for savings and, in our view, keeping real interest rates higher.
- We believe the cycle is maturing, not ending. The question is no longer whether to own AI but where are returns improving and how much to pay for them. Answering it means following the bottlenecks as they shift, while guarding against the risk that so many of the best opportunities rest on the same outcome.
For more than a decade after the global financial crisis, the world lived in a period of abundance. Capital was plentiful, inflation and interest rates were low, and the dominant technologies of the era, cloud software and the smartphone, needed relatively little physical capital. Some called it secular stagnation.
The pandemic and then artificial intelligence (AI) broke that equilibrium. In January, we argued that the AI capex cycle was better understood as a competitive equilibrium than a spending boom, and that it could run for another two to three years before facing its first true test. Ten months on, the core of that view still holds.
What began as a technology cycle appears to be increasingly becoming a transformation of the economy.
What has changed is the nature of the cycle. We have moved from a world with excess capacity almost everywhere to one where, across the AI supply chain, there is excess capacity almost nowhere. What began as a technology cycle appears to be increasingly becoming a transformation of the economy.
The equilibrium is still in charge
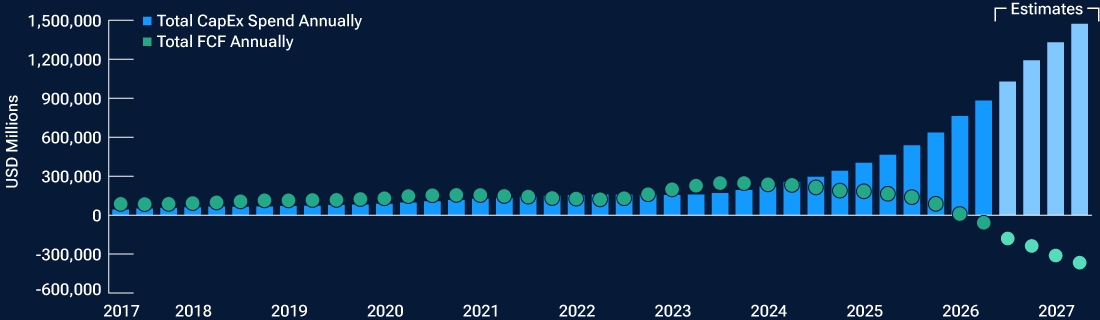
Scaling laws continue to hold. More capital and compute are still producing better models, and any company that spends less risks handing a competitor the lead. The Nash equilibrium1 that is driving this dynamic is not a judgment about whether this spending is wise. It simply recognizes that each player will make its best move given what its rivals are doing, and today that move is to keep investing. Across the largest mega‑cap technology companies,2 consensus capex estimates for 2027 have risen 131% since December 31, 2025, to close to USD 1.5 trillion (Figure 1).
Spending is rising faster than cash flow
(Fig. 1) Consensus capex and free cash flow (FCF) estimates of top mega‑cap technology companies1
As of September 30, 2026.
1 Alphabet (Google), Amazon, Meta, Microsoft, Oracle, SpaceX.
For illustrative purposes only. Actual outcomes may differ materially from estimates. Estimates are subject to change.
The specific securities identified and described are for informational purposes only and do not represent recommendations.
Source: T. Rowe Price analysis using data from FactSet Research Systems Inc. All rights reserved. Please see Additional Disclosures page for additional legal notices & disclaimers.
Why does AI need so much more capital per dollar of revenue than “the cloud” ever did? Because in AI, usage and hardware grow together. A cloud server could take on many new customers at almost no extra cost. An AI system cannot: Every new user and every new query need additional computing power. Efficiency gains are lowering the cost of each query, but usage is growing far faster. As a result, each dollar of revenue requires more investment and leaves less free cash flow. We believe this shift is structural, not temporary.
AI combines software‑like scalability in distribution with infrastructure‑like capital intensity in production. We frame the cycle as three races: 1. compute demand versus powered supply; 2. physical resources versus bottlenecks, and 3. capital versus the hurdle rate3 (cost of capital plus a margin). Returns hold only while marginal AI cash returns exceed the cost of capital.
AI capex cycle: From self‑funded to credit‑fueled
The assumption that hyperscalers could fund the buildout from their own free cash flow no longer holds. The supply chain of the past 15 years was built for smartphones, not for the power, cooling, and compute of AI data centers, and the constraints now reach into cement, land, transformers, and even the availability of electricians.
The largest spenders are redirecting cash from buybacks into data centers and chips. Consensus for 2027 free cash flow across these mega‑cap technology companies has swung from about USD 165 billion in June 2025 to roughly negative USD 237 billion for the end of 2026 (Figure 1). To close the gap, they are increasingly turning to credit markets.
Credit fills the funding gap
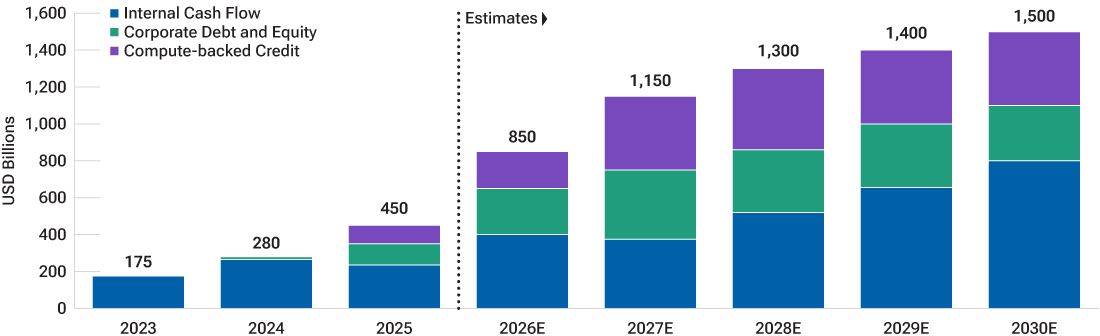
(Fig. 2) Estimated AI infrastructure capital expenditure by source of financing, 2023–2030 (USD billions)
Actual outcomes may differ materially fromestimates. Estimates are subject to change.
Sources: Analysis by T. Rowe Price 2023–2025 based on third‑party estimates and public deal tallies; 2026–2030 are T. Rowe Price base‑case estimates.
Funding has moved in stages (Figure 2). Operating cash flow paid for most of the build in 2023 and 2024, while corporate bonds, bank debt, and equity were increasingly needed to supplement it through 2025 and 2026. The next stage is compute‑backed credit, including project bonds, chip‑backed loans, and data center securitizations, placed largely with insurers and asset managers. Around USD 235 billion has already been completed or announced, and our base case is that roughly USD 1.8 trillion could be raised from 2026 to 2030.
This new source of funding extends the cycle, but it also shifts risk to lenders. Most deals depend on the creditworthiness of the companies leasing the capacity rather than the value of the chips, and for good reason: Resale prices for H100‑class chips have typically fallen by a third to a half within three years. Yet, some loans run for five to seven years against leases of only three.
In past capital cycles, structured financing kept the build going longer and then became the place where the losses landed. The eventual test may come less from a sudden cut in capital spending than from refinancing pressures, if asset values, lease commitments, and debt maturities become misaligned. In our view, this is potentially the early making of a credit cycle: Not yet systemic, but worth watching closely. Weak interest coverage would be the first signal of financial stress.
The cost of capital is rising, but growth can rise too
Credit markets are not the only place the cycle is being felt. A capital cycle this large cannot stay contained within technology. Money goes where it is treated best, and today that means AI infrastructure. The result is a competition for savings, with households, governments, and other companies all bidding for the same pool. Housing offers one example of the pressure. Despite relatively solid earnings and employment, housing activity remains weak, consistent with an environment of elevated financing costs, although affordability and other housing‑specific factors also play a role. We believe this crowding out is pushing real interest rates higher. U.S. 10‑year real yields rose by nearly a full percentage point between April and September,4 and setting aside near‑term energy shocks, we expect that pressure to persist.
Higher rates need not mean recession, however. AI can lift growth in two ways: By making workers and businesses more productive, and by driving heavy investment in physical capital. That leaves investors facing an environment few have experienced: Higher interest rates alongside stronger growth.
Investing in a changing regime
The lesson of the past decade is not that a particular style wins, but that investors are rewarded for recognizing the regime they are in. We do not believe the AI cycle is ending. Demand and earnings visibility extend well into 2027 and, in places, 2028. But the cycle is maturing, and the question has changed.
The lesson of the past decade is not that a particular style wins, but that investors are rewarded for recognizing the regime they are in.
A sustained AI spending cycle does not necessarily translate into attractive returns for every AI‑related stock, particularly where valuations already reflect substantial growth, or earnings revisions begin to slow. It is no longer whether to own AI, but where returns are still improving and how much to pay for them. Our base case is a crowding‑out boom with elevated inflation and real rates; the downside case is a capital glut, where capacity outruns demand, spreads widen, and treasuries rally.
Answering where returns are still improving starts with following the bottlenecks. Physical infrastructure remains central, from semiconductors, memory, and optical networking to power management, cooling, and electrical equipment. As AI workloads evolve, we also see emerging constraints around CPUs, storage, and the data infrastructure needed to support growing token usage and agent activity.
Because bottlenecks migrate, exposure should span the stack rather than rest on any single company or technology. As early beneficiaries mature, we favor recycling capital toward companies earlier in their return inflection. Answering it also means looking beyond the data center. AI‑enabled drug discovery is an early opportunity, while businesses in energy, financials, payments, and consumer staples can offer improving returns that do not depend on AI.
Risk management ties this together. Many of the strongest opportunities share exposure to the same buildout, so position sizing matters as much as finding ideas. And if AI’s competition for capital keeps real rates structurally higher, the bar rises for every investment. We are watching for signs of slowing AI usage and monetization, easing capacity constraints, or deteriorating credit conditions. Any of these could potentially challenge the economics supporting continued investment.
The cycle is still built to persist. But it is now an economic cycle, and investors need to treat it as one.
 David J. Eiswert, CFA
Portfolio Manager

- Oct 2026
- From the Field
The ChatGPT moment in transportation? Autonomous driving nears commercial inflection

Contact us
1 Nash equilibrium is a game theory concept where no player can increase their payoff by unilaterally changing their strategy, assuming all other players keep their strategies unchanged.
2 Alphabet (Google), Amazon, Meta, Microsoft, Oracle, SpaceX.
3 Hurdle rate: The minimum expected return a company requires before committing capital to an investment. It is typically based on the company’s cost of capital (the blended cost of its debt and equity), sometimes with an added premium for risk.
4 Source: T. Rowe Price analysis using data from FactSet Research Systems Inc. All rights reserved.
Additional Disclosures
For U.S. investors, visit troweprice.com/glossary for definitions of financial terms.
Please see vendor indices for more information, including definitions and source data: troweprice.com/marketdata.
Important Information
This material is being furnished for informational and/or marketing purposes only and does not constitute an offer, recommendation, advice, or solicitation to sell or buy any security.
Prospective investors should seek independent legal, financial and tax advice before making any investment decision. T. Rowe Price group of companies including T. Rowe Price Associates, Inc. and/or its affiliates receive revenue from T. Rowe Price investment products and services.
Past performance is not a guarantee or a reliable indicator of future results. All investments involve risk, including possible loss of principal.
Information presented has been obtained from sources believed to be reliable, however, we cannot guarantee the accuracy or completeness. The views contained herein are those of the author(s), are as of October 2026, are subject to change, and may differ from the views of other T. Rowe Price Group companies and/or associates. Under no circumstances should the material, in whole or in part, be copied or redistributed without consent from T. Rowe Price.
All charts and tables are shown for illustrative purposes only. Actual future outcomes may differ materially from any estimates or forward‑looking statements provided.
The material is not intended for use by persons in jurisdictions which prohibit or restrict the distribution of the material and in certain countries the material is provided upon specific request.
Issued in the USA by T. Rowe Price Investment Services, Inc., distributor and T. Rowe Price Associates, Inc., investment adviser, 1307 Point Street, Baltimore, MD 21231, which are regulated by the Financial Industry Regulatory Authority and the U.S. Securities and Exchange Commission, respectively.
© 2026 T. Rowe Price. All Rights Reserved. T. Rowe Price, INVEST WITH CONFIDENCE, the Bighorn Sheep design, and related indicators (see troweprice.com/ip) are trademarks of T. Rowe Price Group, Inc. All other trademarks are the property of their respective owners. Use does not imply endorsement, sponsorship, or affiliation of T. Rowe Price with any of the trademark owners.
- 202610‑6041008