
Unlock your portfolio: The case for international equities
May 2026, Equity
U.S. stocks have delivered strong returns for much of the past decade, but leadership does not stay in one place forever. Today, concentrated U.S. market leadership, improving earnings overseas, and lower international valuations may create a stronger case for looking beyond domestic equities. For investors heavily tilted toward U.S. stocks, international equities can help broaden diversification and expand sources of potential long‑term return.
Why consider international equities now?
- Reduce concentration risk: International equities can lessen dependence on a small group of large U.S. technology companies.
- Broaden sources of return: Different sectors, regions, and economic cycles can create opportunities outside the U.S.
- Start from lower valuations: Many international markets trade at lower valuations than the U.S., which may improve long‑term return potential.
- Benefit from shifting leadership: When market leadership broadens, globally diversified investors may be better positioned.
Looking beyond the “Magnificent Seven” headlines, non‑U.S. equities have outperformed 40% of the time over the last 10 years
(Fig. 1) Performance leadership has traded off sharply across most calendar years
| 2016 | 2017 | 2018 | 2019 | 2020 | 2021 | 2022 | 2023 | 2024 | 2025 | 2026 (Q1) |
|---|---|---|---|---|---|---|---|---|---|---|
| U.S. Equity 12.0% |
Int’l. EM Equity 37.8% |
U.S. Equity ‑4.4% |
U.S. Equity 31.5% |
Int’l. EM Equity 18.7% |
U.S. Equity 28.7% |
Int’l. DM Equity ‑14.5% |
U.S. Equity 26.3% |
U.S. Equity 25.0% |
Int’l. EM Equity 34.4% |
Int’l. EM Equity ‑0.1% |
| In’tl EM Equity 11.6% |
Int’l. DM Equity 25.6% |
Int’l. DM Equity ‑13.4% |
Int’l. DM Equity 22.7% |
U.S. Equity 18.4% |
Int’l. DM Equity 11.8% |
U.S. Equity ‑18.1% |
Int’l. DM Equity 18.9% |
Int’l. EM Equity 8.1% |
Int’l. DM Equity 31.9% |
Int’l. DM Equity ‑1.1% |
| Int’l. DM Equity 1.5% |
U.S. Equity 21.8% |
Int’l. EM Equity ‑14.2% |
Int’l. EM Equity 18.9% |
Int’l. DM Equity 8.3% |
Int’l. EM Equity ‑2.2% |
Int’l. EM Equity ‑19.7% |
Int’l. EM Equity 10.3% |
Int’l. DM Equity 4.3% |
U.S. Equity 17.9% |
U.S. Equity ‑4.3% |
Past performance is not a guarantee or a reliable indicator of future results. Index performance is for illustrative purposes only and is not indicative of any specific investment. Investors cannot invest directly in an index.
Figures are shown in U.S. Dollars. U.S. Equity is represented by the Russell 1000 Index, International Emerging Markets (EM) Equity is represented by the MSCI EM Index, International Developed Markets (DM) Equity is represented by the MSCI EAFE Index. The “Magnificent Seven” is Alphabet (Google), Amazon, Apple, Meta, Microsoft, NVIDIA, and Tesla. The specific securities identified and described are for informational purposes only and do not represent recommendations.
Sources: T. Rowe Price calculations using data from FactSet Research Systems Inc. All rights reserved. Please see Additional Disclosures page for additional legal notices & disclaimers.
Diversification matters more when markets are concentrated
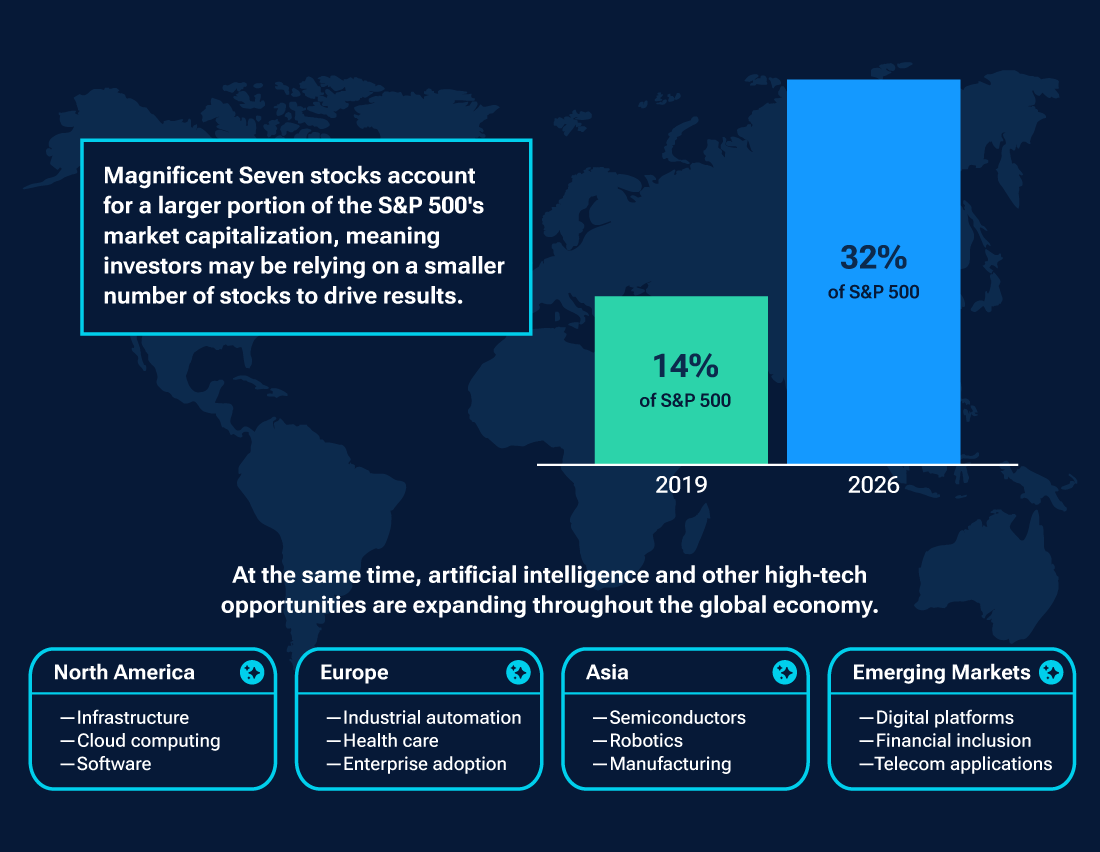
The U.S. market still offers access to many exceptional companies—but it has also become far more concentrated. As of April 2026, the Magnificent Seven made up about 32% of the S&P 500’s market value, up from 14% in 2019. That means many investors may be relying more heavily than they realize on just a handful of stocks to drive portfolio results. Adding international equities can help broaden exposure and reduce that concentration risk.
Where could international equities add value?
- A global opportunity set: More than one‑third of global market capitalization lies outside the U.S., and the non‑U.S. opportunity set has expanded over time. Since 1999, listed non‑U.S. companies have grown 38%, while listed U.S. companies have contracted -44%, according to the World Bank Group.
- More diversified sector exposure: Non‑U.S. markets can provide greater exposure to sectors such as financials, industrials, and energy, which are less dominant in the U.S. These markets also include well‑known global companies such as Allianz, Rolls‑Royce, Airbus, and TotalEnergies, for example. In addition, investors may access companies tied to artificial intelligence, often at more attractive valuations.
- Different regional growth drivers: Structural trends such as Japan’s corporate governance reforms, Europe’s increased infrastructure and defense spending and potential easing of regulations, and a manufacturing build‑out in select Asian economies are supporting opportunity beyond the U.S.
- Potential currency support: A weaker U.S. dollar can increase the value of overseas market gains when they are translated back into U.S. dollars.
AI is expanding across geographies and industries as U.S. market concentration grows
(Fig. 2) What began with infrastructure is increasingly spreading to adopters and enablers across the global economy
Sources: T. Rowe Price analysis using data from S&P. For illustrative purposes only.
The fundamentals are improving
International stocks may be worth a closer look—not just for diversification, but because they may offer attractive value. Since the pandemic, many companies outside the U.S. have improved their earnings, but their stock prices are still generally lower than those of U.S. companies. For long-term investors, that can be a good starting point and may lead to stronger return potential over time.
What does the data suggest?
- Stronger earnings: Earnings growth in developed international markets has improved, with earnings per share rising to 5.2% from 1.7% before the pandemic, pointing to healthier company fundamentals.
- More attractive valuations: With the forward price‑to‑earnings ratio of international developed markets stocks trading at a 23% discount to the S&P 500 Index as of March 31, 2026, international equities remain less expensive and could be a good opportunity for U.S. investors.
- Long‑term potential: International stocks have lagged the U.S. in recent years, but leadership can shift over time. With company fundamentals improving, valuations still lower than in the U.S., and market gains broadening, international stocks may present a long‑term growth opportunity for investors.
Is your portfolio positioned for international opportunities?
For investors who want to reduce concentration and broaden opportunity, international equities may be worth another look. Speak with your financial advisor to determine how international equities fit within your goals and asset allocation.
Strategies to Consider

Contact us
Additional Disclosure
For U.S. investors, visit troweprice.com/glossary for definitions of financial terms.
Please see vendor indices for more information, including definitions and source data: troweprice.com/marketdata.
Important Information
The specific securities identified and described are shown for illustrative purposes only and do not necessarily represent securities purchased or sold by T. Rowe Price. This information is not intended to be a recommendation to take any particular investment action and is subject to change. No assumptions should be made that the securities identified and discussed were or will be profitable.
This material is provided for informational purposes only and is not intended to be investment advice or a recommendation to take any particular investment action.
The views contained herein are those of the authors as of April 2026 and are subject to change without notice; these views may differ from those of other T. Rowe Price associates.
This information is not intended to reflect a current or past recommendation concerning investments, investment strategies, or account types, advice of any kind, or a solicitation of an offer to buy or sell any securities or investment services. The opinions and commentary provided do not take into account the investment objectives or financial situation of any particular investor or class of investor. Please consider your own circumstances before making an investment decision.
Information contained herein is based upon sources we consider to be reliable; we do not, however, guarantee its accuracy.
Risk Considerations: All investments are subject to market risk, including the possible loss of principal. International investments can be riskier than U.S. investments due to the adverse effects of currency exchange rates, differences in market structure and liquidity, as well as specific country, regional, and economic developments. These risks are generally greater for investments in emerging markets. Diversification cannot assure a profit or protect against loss in a declining market.
Past performance is not a guarantee or a reliable indicator of future results. All charts and tables are shown for illustrative purposes only.
T. Rowe Price Investment Services, Inc.
© 2026 T. Rowe Price. All Rights Reserved. T. ROWE PRICE, INVEST WITH CONFIDENCE, the Bighorn Sheep design, and related indicators (see troweprice.com/ip) are trademarks of T. Rowe Price Group, Inc. All other trademarks are the property of their respective owners. Use does not imply endorsement, sponsorship, or affiliation of T. Rowe Price with any of the trademark owners.
- 202605-5483694