
Private assets in DC plans: What’s changed? What’s next?
Retirement
- Key Insights
-
- Growing alignment between private asset investment structures and the operational needs of DC plans is broadening opportunities to access private markets.
- Return enhancement and diversification are driving interest in private assets, but fees, liquidity, and litigation risk must be sufficiently addressed.
- Professionally managed multi‑asset solutions can offer a prudent pathway to private markets exposure by centralizing governance and managing liquidity.
Investment capabilities in defined contribution (DC) plans are entering the next phase of their evolution. As innovation in private markets accelerates and policy shifts signal a more supportive regulatory backdrop, DC plan sponsors and their advisors are increasingly asking not whether private asset integration is possible, but whether it is practical, prudent, and aligned with participant goals.
We believe that a broader investment universe—one that includes certain private asset classes—can offer better outcomes for plan participants, particularly when accessed through well‑constructed, professionally managed multi‑asset solutions. However, from the investment case to operational considerations, properly evaluating opportunities for private asset exposure requires a thorough understanding of the current landscape and what may come next.
What hasn’t changed?
Persistent retirement headwinds
The primary challenge of DC plan investing remains the same: helping participants accumulate enough assets for a confident retirement that can last decades. The structural pressures facing retirement savers—including insufficient savings rates, the financial effects of increased life expectancy, and the persistent erosion of purchasing power—have not eased. If anything, they have intensified (Figure 1).
Preparing for retirement is a challenge
(Fig. 1) Headwinds facing retirement savers
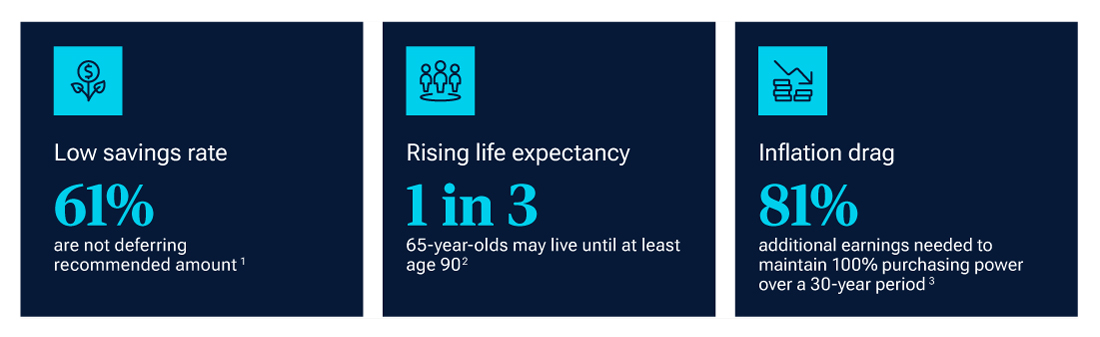
1 Source: T. Rowe Price, Global Retirement Savers Study. Q: About what percentage of your personal income, if any, do you expect to contribute to your 401(k) plan in the next 12 months? Q: What percentage of your income, if any, do you expect your employer to contribute to your retirement account in the next 12 months? n = 3,001. As of July 2025.
2 Source: Social Security Administration, as of January 2026.
3 Based on assumed inflation rate of 2% over a 30-year period and is comparing ending earnings to starting earnings.
These realities mean that investment strategies must do more of the heavy lifting to help participants reach their retirement goals.
Evolution in multi‑asset capabilities
The evolution of multi‑asset retirement portfolios reflects this enduring challenge. Since becoming the dominant qualified default investment alternative (QDIA), target date solutions have expanded well beyond their foundational stock‑and‑bond allocations. Portfolio construction has become more sophisticated to incorporate additional asset classes, refined glide paths, and broader sources of risk‑adjusted returns that can potentially enhance diversification and improve durability across market environments (Figure 2).
The ability to incorporate private assets as building blocks in target date and other multi‑asset solutions represents a continuation of this tradition. The need for growth, diversification, and thoughtful risk management has not changed. What has—and what will likely continue to evolve—is the opportunity set available to pursue these objectives.
The need for demonstrable value
The suitability of private assets in DC plans has at times been debated. However, the fundamental value proposition has remained consistent: the potential to enhance diversification and returns.
Ultimately, private assets must earn their place in DC plan portfolios. We believe that any allocation, whether public or private, should demonstrate unique net‑of‑fee benefits within the context of the broader portfolio. Inclusion should improve expected participant outcomes in a measurable way, without undermining liquidity management, fee discipline, or fiduciary responsibility.
Diversification in multi-asset strategies continues to evolve
(Fig. 2) Stages of diversification in target date solutions
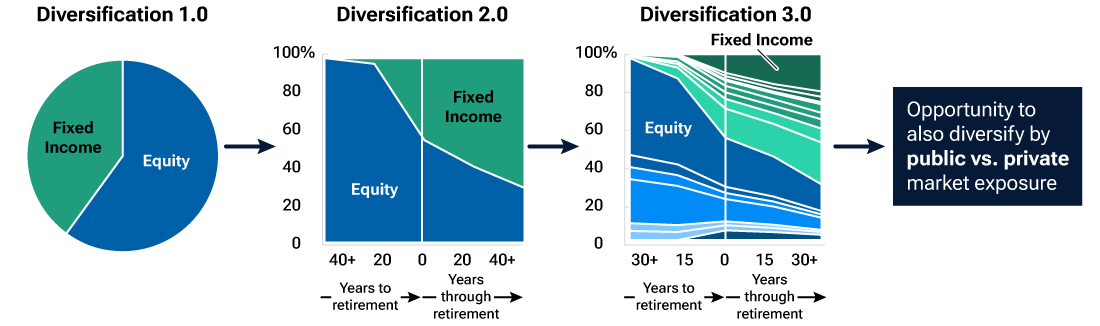
Source: T. Rowe Price.
What has changed?
A shifting investment landscape
Public markets today look different than they did a generation ago. Equity indices have become increasingly concentrated, with a growing share of returns driven by a small number of large companies. At the same time, the number of publicly listed firms has declined, as many companies have opted to access capital outside traditional exchanges and stay private longer (Figure 3a). Debt markets have also experienced structural changes, shaped by institutional demand dynamics and the availability of customized financing outside traditional bond sectors.
Meanwhile, private markets have surged in size and scope (Figure 3b). Private equity, private credit, infrastructure, and direct private real estate now represent a significantly larger portion of the global investable universe than they did two decades ago. For long‑term investors, this shift raises an important strategic question: whether excluding private markets limits access to meaningful segments of economic growth.
Inclusion should improve expected participant outcomes in a measurable way, without undermining liquidity management, fee discipline, or fiduciary responsibility.
Diminishing structural barriers
The regulatory and product landscape is also evolving. Private assets have long played a role in many DC plans, for instance through equity strategies that tactically invest in companies prior to their public listing. However, uncertainty around regulatory interpretation and potential litigation risk has curbed broader integration of private assets.
More recently, policy moves and industry engagement have signaled greater willingness to address these barriers. Structural innovation—such as evergreen funds, which offer periodic liquidity and long‑term exposure to private markets—has made private asset integration more operationally compatible with DC requirements, including daily valuation and participant transactions.
Private assets are expanding rapidly
(Fig. 3a) Number of publicly listed companies
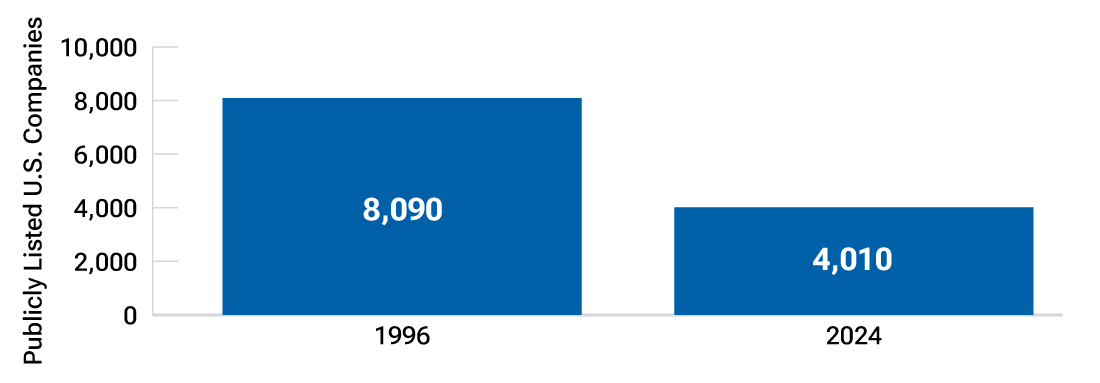
As of December 31, 2024.
Source: World Federation of Exchanges
(Fig. 3b) Growth in private assets ($ billions)
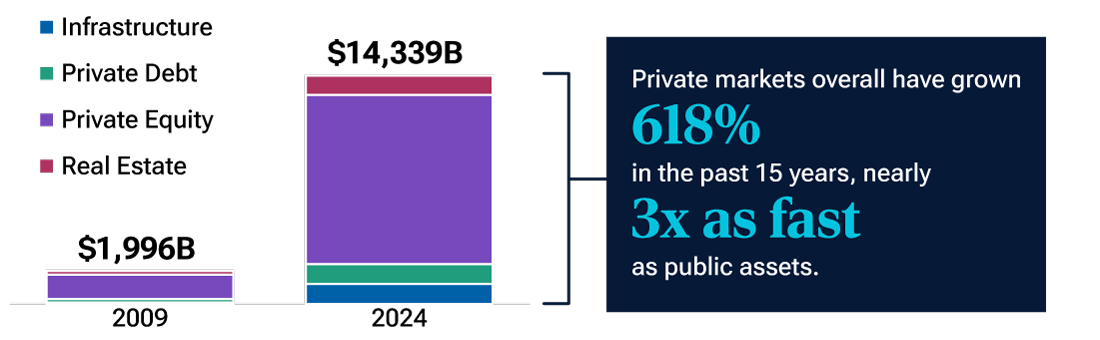
Source: Ocorian, “Global infrastructure assets rise to record $1.22 trillion.” February 4, 2026.
Taken together, these developments are reshaping the feasibility conversation. The DC industry is increasingly focused on real‑world implementation, carefully assessing how private assets may fit within diversified, professionally managed multi‑asset solutions.
The investment case for private assets
Introducing private asset allocations in target date portfolios offers additional tools to pursue diversification and return objectives.
Private equity, private credit, infrastructure, and private real estate each introduce differentiated return drivers.
- Private equity offers exposure to value creation that often takes place before companies enter public markets.
- Private credit can provide negotiated income streams that differ structurally from traditional fixed income.
- Private infrastructure can provide steady income with lower exposure to economic cycles and a potential inflation hedge.
- Private real estate can boost income generation and help cushion against inflation.
When combined thoughtfully with public equities and bonds, these exposures can add diversification benefits due to differences in economic drivers and market dynamics.
Structural innovation...has made private asset integration more operationally compatible with DC requirements....
Understanding the opportunity set
(Fig. 4) Private asset class overviews
| Private equity | Private infrastructure | Private credit | Private real estate | |
|---|---|---|---|---|
| What it is |
|
|
|
|
| Key considerations |
|
|
|
|
| Role in portfolio |
|
|
|
|
Source: T. Rowe Price.
1 The nature of traditional private equity investing can lead to a performance pattern known as the J-curve. This requires investors to prudently manage their cash flows and capital needs and, from a DC plan sponsor perspective, could involve additional management activity that sponsors may not be accustomed to or interested in assuming. See the Definitions section for additional detail.
What’s next?
Evaluation on the part of investment managers and plan sponsors must be rigorous. Appraisal‑based valuations can smooth reported volatility in private markets, but investment managers should acknowledge the underlying economic risk and understand true correlations, particularly in stressed environments. Moreover, manager performance dispersion in private markets has been pronounced, making skilled active management and disciplined due diligence critical to outcomes.
In the context of target date solutions, providers are generally responsible for selecting which private market allocations meet the threshold for inclusion and for underlying manager selection, while plan sponsors/fiduciaries and/or their consultants and advisors retain responsibility for selecting the target date provider.
Plan sponsor interest varies by plan size
Our survey data and industry engagement suggest that interest in private assets is real but measured (Figure 5). Plan sponsors and consultants consistently cite diversification and return enhancement as primary objectives when evaluating private asset strategies. At the same time, implementation appetite varies across different private market exposures and by plan size.
In our research, private credit emerges as the most likely private asset to be implemented, selected by 43% of plan sponsor respondents.
- Despite increased headline risk around private credit today, our Target Date team agrees with the plurality of plan sponsors that a structural allocation to private credit is appealing as a source of income with lower volatility than public market alternatives.
- Furthermore, private credit is typically viewed by consultants and plan sponsors as a reasonable entry point for incorporating private markets exposure in DC plans.
- We observe differences, however, when we segment the plan sponsor population by plan assets.
- Plans with less than $1 billion in assets are more likely than their larger counterparts to anticipate integration of private equity and, to a lesser extent, other alternatives such as cryptocurrency. While cryptocurrency is part of the broader DC discussion around alternative investments, our T. Rowe Price Target Date team similarly views it as the least likely to be implemented in target date portfolios.
- In contrast, plans with more than $1 billion in assets are more likely to anticipate integration of private credit and direct real estate.
- Regarding direct real estate, we’ve already seen implementation in the mega plan market, particularly within custom target date strategies.
Importantly, fees, liquidity constraints, benchmarking challenges, and litigation risk are identified as top barriers to implementation (Figure 6). While many plan sponsors see the possible benefits of offering DC plan investments that include exposure to private assets, they are seeking clarity on these aspects and expect them to be sufficiently addressed.
Plan sponsor views on potential implementation
(Fig. 5) Perspectives regarding private asset classes, by plan size
Question: Which alternative investment strategies are most likely to be incorporated into DC plans over the next 12–24 months?
Rating: Least Likely (1) to Most Likely (4)
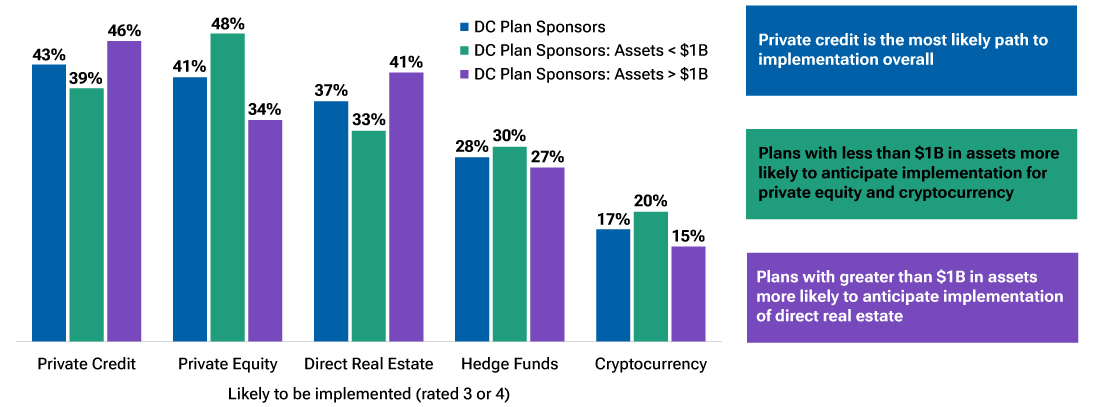
Source: T. Rowe Price, 2026 DC Plan Sponsor Retirement Trends Study.
Fees and liquidity remain in focus
(Fig. 6) Perspectives among DC plan consultants/advisors and sponsors
Question: What are the top two reasons preventing implementation of alternative investments in DC plans?
Rating: Select top 2.
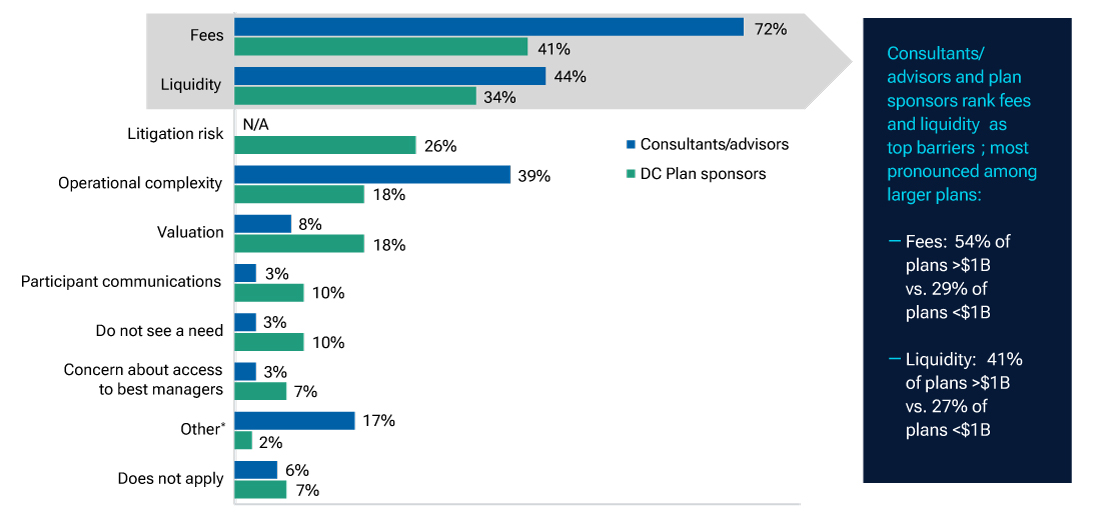
Consultant/advisor data: T. Rowe Price, 2025 Defined Contribution Consultant Study. Plan sponsor data: T. Rowe Price, 2026 DC Plan Sponsor Retirement Trends Study. See Appendix for study methodology. Litigation risk was not offered as a response option for consultants/advisors.
1 Other responses, consultants/advisors: Difficulty in conducting proper due diligence, employee tenure mismatch with alts time horizons, litigation risk. Other responses, plan sponsors: Participant understanding of the option, litigation risk.
Final thoughts: From concept to implementation
If private assets are to widely gain traction in DC plans, their implementation vehicle will matter as much as their investment case. The strongest consensus points toward professionally managed, multi‑asset solutions—particularly target date strategies and, to a lesser extent, managed accounts—as the most practical entry points. These structures centralize governance, manage liquidity within a diversified framework, and reduce the risk of participant misuse associated with stand‑alone options.
For plan sponsors, the evaluation of private assets ultimately returns to fiduciary fundamentals. Any allocation must be assessed for its potential contribution to participant outcomes, its value proposition, and its operational feasibility. Liquidity management, manager selection, cost reasonableness, and participant communication all require careful consideration. Additionally, within the context of target date solutions, it is important to understand the role the private market building block is expected to play and how it evolves across a glide path to align with participants’ investment objectives and time horizon to retirement.
As policy discussions evolve and product innovation continues, prudence remains the guiding principle. The integration of private assets, if pursued, should reflect a documented, research‑driven process grounded in participant best interests, consistent with how fiduciaries evaluate any other investments offered in a DC plan. The opportunity is compelling, but fiduciary discipline remains non‑negotiable. Portfolio durability, liquidity management, cost discipline, and governance standards must remain intact.
Appendix: Study methodology
T. Rowe Price DC Plan Sponsor Retirement Trends Study: The survey was fielded from October 21–December 4, 2025. Data reflect responses from 136 plan sponsors that have a role in overseeing and/or selecting their organization’s DC plan investment offerings. Survey respondents were not aware that the research was sponsored by T. Rowe Price, and they are not necessarily T. Rowe Price clients.
T. Rowe Price Defined Contribution Consultant Study: The study was fielded from January 13–March 10, 2025. Participating in the 2025 study were 36 of the leading consultant and advisor firms (81% consultant and 19% advisor, based on self-identification of firm types) with over 136,000 DC plan sponsor clients and representing nearly $9 trillion in assets under advisement (AUA), based on self‑reported figures.
T. Rowe Price Global Retirement Savers Study (GRSS): The 2025 GRSS surveyed 7,010 adults age 18+, representative of the population of workers (on age, gender, and region) contributing to a defined contribution (DC) or similar account‑based workplace retirement plan. 1,000 (or slightly more) adults per market were surveyed, except in the U.S., where 3,001 adults were surveyed. The data are weighted to provide equal representation across all countries.
 Jessica Sclafani, CAIA®
Head, Retirement Strategist Team
Jessica Sclafani, CAIA®
Head, Retirement Strategist Team
 Andrew Jacobs Van Merlen, CFA
Portfolio Manager
Andrew Jacobs Van Merlen, CFA
Portfolio Manager

- March 2026
- From the Field
Multi-asset collaboration and due diligence

Contact us
Investment Risks
Private investments are typically speculative and exposed to a high degree of business and financial risk. They may be leveraged and engage in speculative practices that increase the risk of investment loss and cause performance volatility.
Definitions
The J-curve performance pattern reflects early losses during an initial investment period in which committed capital from investors is called and deployed by the investment manager, followed by gradual gains through a latter-stage harvesting period in which the manager generates and returns profits stemming from business improvements.
Visit troweprice.com/glossary for definitions of additional financial terms.
Additional Disclosure
CAIA® is a registered certification mark owned and administered by the Chartered Alternative Investment Analyst Association.
Important Information
This material is being furnished for general informational and/or marketing purposes only. The material does not constitute or undertake to give advice of any nature, including fiduciary investment advice. Prospective investors are recommended to seek independent legal, financial and tax advice before making any investment decision. T. Rowe Price group of companies including T. Rowe Price Associates, Inc. and/or its affiliates receive revenue from T. Rowe Price investment products and services. Past performance is not a guarantee or a reliable indicator of future results. The value of an investment and any income from it can go down as well as up. Investors may get back less than the amount invested. Diversification cannot assure a profit or protect against loss in a declining market.
This material is provided for informational purposes only and is not intended to be investment advice or a recommendation to take any particular investment action.
The views contained herein are those of the authors as of April 2026 and are subject to change without notice; these views may differ from those of other T. Rowe Price associates.
This information is not intended to reflect a current or past recommendation concerning investments, investment strategies, or account types, advice of any kind, or a solicitation of an offer to buy or sell any securities or investment services. The opinions and commentary provided do not take into account the investment objectives or financial situation of any particular investor or class of investor. Please consider your own circumstances before making an investment decision.
Information contained herein is based upon sources we consider to be reliable; we do not, however, guarantee its accuracy.
Past performance is not a guarantee or a reliable indicator of future results. All investments are subject to market risk, including the possible loss of principal. All charts and tables are shown for illustrative purposes only.
T. Rowe Price Investment Services, Inc. For Institutional Investors Only.
© 2026 T. Rowe Price. All Rights Reserved. T. Rowe Price, INVEST WITH CONFIDENCE, the Bighorn Sheep design, and related indicators (see troweprice.com/ip) are trademarks of T. Rowe Price Group, Inc. All other trademarks are the property of their respective owners. Use does not imply endorsement, sponsorship, or affiliation of T. Rowe Price with any of the trademark owners.
- 202604‑5321585