- From the Field
- Restoring America’s nuclear energy capacity—digging in to potential impacts and implications
- Recent executive orders from the White House call for the quadrupling of U.S. nuclear energy capacity by 2050.
- 2025-06-25 13:48
- Key Insights
-
- Recent executive orders from the White House call for the quadrupling of U.S. nuclear energy capacity by 2050.
- The scale of investment required for this energy transition is not realistic without first removing significant barriers to nuclear power growth.
- While the ultimate winners and losers in a U.S. nuclear renaissance remain unclear, one thing is certain—all potential solutions for providing nuclear power require uranium.
Recent executive orders from the White House call for the quadrupling of U.S. nuclear energy capacity by 2050. While there are major barriers to overcome if this ambitious plan is to be achieved, the potential impacts and implications for the U.S. energy sector of such a transitional shift in capacity and supply are significant and far‑reaching.
Today, the U.S. nuclear fleet’s 94 reactors have capacity of ~100 gigawatts (GW) and provide ~20% of the country’s electrons. More than 90% of the U.S. nuclear fleet was built in the 1970s and 1980s and, since the early 1990s, just six GW of nuclear capacity has been added across five reactors (Fig. 1). In order to quadruple U.S. nuclear energy capacity by 2050, an additional 15 GW per year of nuclear capacity would need to be commissioned from 2030 to 2050—versus a peak commissioning of 10.5 GW in 1974. We would also need to see the adoption of Generation III+ and Generation IV reactors and micro reactors, often referred to collectively as small module reactors, or SMRs.
New U.S. nuclear capacity commissioned per year
(Fig. 1)
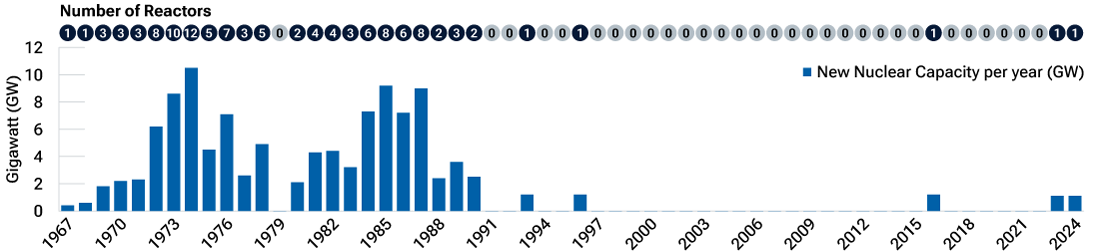
As of December 31, 2024
Source: U.S. Department of Energy. Data analysis by T. Rowe Price.
Such a large scale of investment is not realistic without removing significant barriers to nuclear power growth, including: (1) licensing and permitting, (2) cost and bankability, (3) workforce and supply chain, and (4) development of SMRs. This paper examines these various challenges, how President Donald Trump’s executive orders attempt to address them, and how we, as investors, are looking to position ourselves to benefit from the potential growth in nuclear power.
1. Licensing and permitting
Two of the president’s four executive orders on nuclear energy focus on the barriers to new capacity, specifically licensing, permitting, and testing—predominantly overseen by the U.S. Nuclear Regulatory Commission (NRC). The NRC is viewed as a global leader in nuclear safety licensing and regulation, but regulatory efficiency in the licensing review and approval process is an ongoing issue. The regulatory efficiency is impeded by a patchwork of legislatively mandated hearings and reviews, prohibitive head count levels, and competing designs seeking review and approval. Standardization of both the process and designs would go a long way toward allowing the NRC to remain a global leader while also increasing the speed with which designs and projects are approved.
This work is underway, and the president’s executive orders seek to expedite this needed reform. Specifically, President Trump has called for the deployment of new SMR technology at a domestic U.S. Army base by no later than September 2028. Importantly, the licensing, permitting, and testing process for nuclear power plants at military bases falls under the sole jurisdiction of the Department of Energy (DOE). Successfully deploying SMR technology at a government site could go a long way toward jump‑starting the addition of new nuclear power plants by the private sector.
2. Cost and bankability
The construction of additional nuclear power plants in the U.S. will need to overcome cost and bankability concerns. The most recently constructed nuclear power plant in the U.S., Vogtle in Georgia, saw Units 3 and 4 enter service in 2023 and 2024, respectively, more than seven years late and USD 18 billion over budget. Research from Massachusetts Institute of Technology (MIT) and the DOE estimates that Vogtle unit construction costs today would be around USD 15,000/kilowatt (kW) in the U.S. This compares with estimated nuclear unit costs in other countries ranging from USD 3,000/kW to USD 10,000/kW (Fig. 2).
New nuclear capacity costs1 (USD/kW)
(Fig. 2)
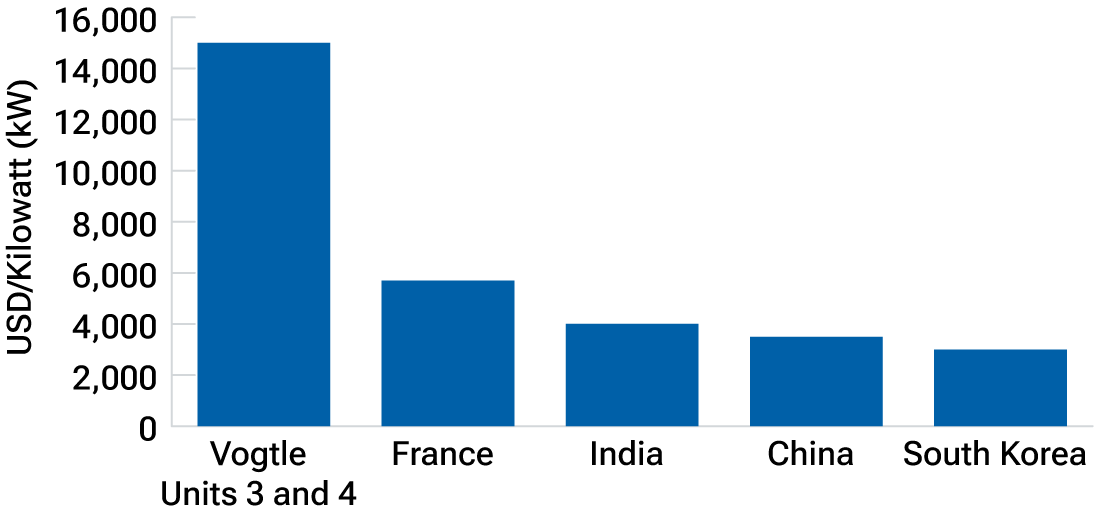
As of December 31, 2024.
1Overnight costs. The overnight cost is the capital cost exclusive of financing charges accruing during the construction period.
Sources: U.S. Department of Energy, MIT, International Energy Agency, Nuclear Energy Agency. Data analysis by T. Rowe Price.
At USD 15,000/kW, a nuclear plant would be uneconomical for both ratepayers and investors, and getting such a project approved by regulators or investors is a tall order. This is further exacerbated by the inability to secure debt financing or tax equity financing for a nuclear project. The construction of Vogtle Units 3 and 4 required DOE loan guarantees and caused the rating agencies to downgrade Georgia Power’s credit rating. Lower unit costs (USD/kW) can contribute to improved bankability, as the sheer size of the projects is a financing constraint.
The president’s executive order tasks the DOE with funding nuclear restarts, upgrades, and the construction of new nuclear projects—with a goal of starting construction for 10 new large reactors by 2030. In addition, the development of SMRs is expected to improve the economics of nuclear power deployment by significantly reducing the upfront capital costs required.
3. Workforce and supply chain
The DOE estimates that the U.S. would need an additional 375,000 workers to support the deployment of 200 GW—a tripling—of new nuclear power by 2050. This number includes around 100,000 workers to operate the new reactors and 275,000 related to construction and manufacturing for the new reactors. Today, the industry’s labor pool is constrained by a shortage of existing skilled labor and the new project pipeline, which contribute to challenges in training new workers.
The limited pipeline of nuclear projects also inhibits domestic development and manufacturing supply chain. For example, there are no domestic forging capabilities to support the material and component needs of the Westinghouse AP1000 reactor. Similarly, some materials that are required to construct a nuclear power plant are critical minerals where there is little to no domestic supply. Current domestic labor and vendor constraints will limit the U.S. grid to just three GW per year of new nuclear capacity, assuming no other constraints.
Another important bottleneck is enrichment capacity. Mined uranium must be enriched before being used in power plants. Currently, Russia and China control nearly 60% of world enrichment capacity. The U.S. once held a leading share of enrichment capacity, but this came to an end following the 1993 “Megatons to Megawatts” agreement, which was aimed at reducing the threat of nuclear proliferation by converting weapons‑grade uranium from Russian warheads to low‑enriched uranium for commercial power plants. This led to an oversupply of enriched uranium from Russia that shuttered domestic enrichment capacity. The last U.S. enrichment plant capable of unobligated production was shut down in 2013. Today, there is only one U.S. uranium enrichment facility with capacity to enrich just one‑third of existing U.S. reactor requirements.
“Today, there is only one U.S. uranium enrichment facility with capacity to enrich just one‑third of existing U.S. reactor requirements.”
Rick de los Reyes, Sector Portfolio Manager and Head of Commodities
The president’s executive orders attempt to address these issues. The Department of Labor has been tasked with growing the nuclear workforce. On the issue of enrichment, the DOE and the NRC are to “develop a plan to expand domestic uranium conversion capacity and expand enrichment capabilities sufficient to meet projected civilian and defense reactor needs…”. The orders also call for the use of the Defense Production Act to enter into commercial agreements with domestic suppliers for nuclear fuel supply.
4. Development of SMRs
Finally, the sheer magnitude of quadrupling installed nuclear capacity in the U.S. will require the adoption and use of a few different technologies. Existing nuclear plants in the U.S. use traditional large‑scale reactors. Vogtle Units 3 and 4, for instance, utilize Westinghouse’s AP1000 reactor, which is considered a large‑scale Gen III reactor. The appeal of newer SMRs is the significantly lower capital cost required to deploy them. This capital cost could decline even further if the technology is standardized, allowing it to be mass produced in a more cost‑effective manner.
As of today, there is one operating SMR in Russia and one that is under construction in China. There are also 80+ SMR designs currently in development across 19 countries. Over the past 70 years, the U.S. has constructed 50+ different commercial reactor designs. Lack of standardization, among other things, was a key contributor to the ballooning costs for nuclear reactors during the 1970s and 1980s.
As mentioned earlier, the president’s executive orders direct the Energy Secretary to speed the standardization of design and select a technology to be put into use at a U.S. military site. Standardizing reactor designs could improve costs and reduce lead times for approvals, labor, and equipment.
All solutions require uranium
From a natural resources perspective, we believe the best way to invest in this secular shift toward nuclear is through uranium. The technology behind nuclear power is still evolving. It is not entirely clear who will be the winners and losers among nuclear energy equipment providers, engineering and construction companies, or the power providers. What we do know for certain is that all potential solutions for providing nuclear power require uranium.
If the ambitions of President Trump’s executive order are to be achieved, and if the rest of the world’s projected growth in nuclear power also comes to fruition, the world will face a significant deficit in uranium supply (Fig. 3). The de‑emphasis of nuclear power over the last 10+ years, particularly since the Fukushima nuclear accident in 2011, has resulted in significant underinvestment in uranium mining. Given that building new uranium mines can take a decade or more, the necessary planning and investment to add new supply needs to be happening now.
Global uranium supply and demand
(Fig. 3)
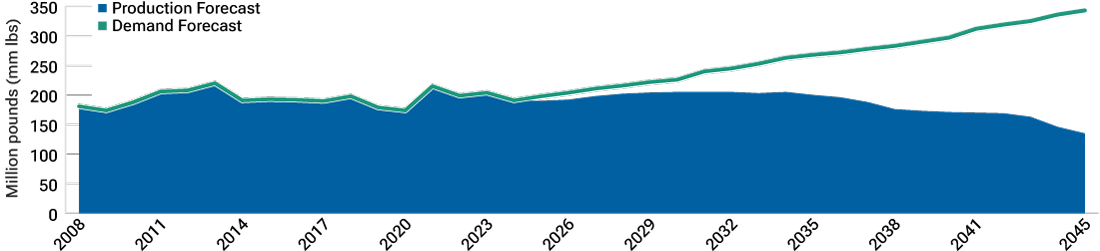
As of December 31, 2024.
There is no guarantee that any forecast made will come to pass.
Source: Goldman Sachs Global Investment Research. Data analysis by T. Rowe Price.
Meanwhile, the diverging supply and demand numbers don’t tell the full story. It will also be crucial that uranium supply comes from reliable sources. The U.S. currently produces less than 1% of the world’s uranium and relies almost entirely on imports for its needs. Globally, 75% of uranium production comes from government‑owned sources, the majority of which comes from Kazakhstan, Uzbekistan, and Russia (Fig. 4).
Global ownership of uranium production
(Fig. 4)
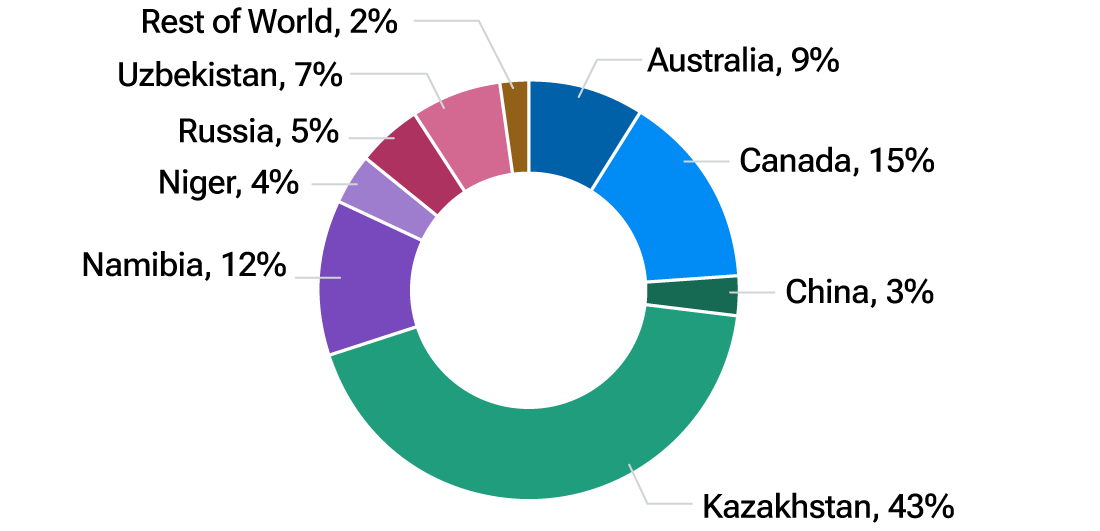
As of January 1, 2023. Most recent data available.
Breakdowns based on tonnes of uranium (tU) produced.
Sources: Nuclear Energy Agency and the International Atomic Energy Agency: Uranium 2024 Resources Report.
Moving forward, the U.S. and its allies will likely want to decrease dependence on imports and increase domestic production. For this reason, uranium producers in North America look well placed to capitalize on this “reshoring” of demand. Saskatoon‑based Cameco, for example, is the largest private uranium miner in the world, operating large low‑cost mines in Canada. Cameco also has exposure to all parts of nuclear fuel production through its investment in nuclear technology pioneer Westinghouse. Similarly, Uranium Energy Corp also looks to be well positioned, boasting the leading uranium resource base and the largest licensed production capacity within the U.S. Growing production from large, low‑cost, uranium miners in safe jurisdictions like North America will be necessary to meet the growing demands for nuclear power now, and in the decades to come.
-
Important Information
This material is provided for informational purposes only and is not intended to be investment advice or a recommendation to take any particular investment action.
The views contained herein are those of the authors as of June 2025 and are subject to change without notice; these views may differ from those of other T. Rowe Price associates.
This information is not intended to reflect a current or past recommendation concerning investments, investment strategies, or account types, advice of any kind, or a solicitation of an offer to buy or sell any securities or investment services. The opinions and commentary provided do not take into account the investment objectives or financial situation of any particular investor or class of investor. Please consider your own circumstances before making an investment decision.
Information contained herein is based upon sources we consider to be reliable; we do not, however, guarantee its accuracy. Actual future outcomes may differ materially from any estimates or forward-looking statements provided.
Past performance is not a guarantee or a reliable indicator of future results. All investments are subject to market risk, including the possible loss of principal. Because of the cyclical nature of natural resource companies, their stock prices and rates of earnings growth may follow an irregular path. All charts and tables are shown for illustrative purposes only.
T. Rowe Price Investment Services, Inc., distributor. T. Rowe Price Associates, Inc., investment adviser. T. Rowe Price Investment Services, Inc., and T. Rowe Price Associates, Inc., are affiliated companies.
© 2025 T. Rowe Price. All Rights Reserved. T. ROWE PRICE, INVEST WITH CONFIDENCE, the Bighorn Sheep design, and related indicators (see troweprice.com/ip) are trademarks of T. Rowe Price Group, Inc. All other trademarks are the property of their respective owners.
202506‑4576263