- In the Spotlight
- Five must-ask questions about private assets in DC plans
- Explore private assets’ potential to improve portfolio diversification and retirement outcomes.
- 2025-05-06 10:32
-
Jessica Sclafani, CAIA, Global Retirement Strategist
Som Priestley, CFA, Regional Head of Multi‑Asset Solutions and Portfolio Manager - Key Insights
-
- Private assets offer the potential to enhance portfolio diversification and improve long-term retirement outcomes.
- Amid industry efforts to lower access barriers, some DC plan sponsors are exploring how private assets could be incorporated into plan investments.
- Our research suggests that multi-asset portfolios, such as target date funds and managed accounts, are the most likely vehicles for private asset integration.
Private assets are a large and growing part of the global opportunity set. Yet, while they have long been used as strategic allocations in defined benefit (DB) plans, their inclusion in defined contribution (DC) plans has been limited. This disparity has been largely driven by structural challenges specific to the DC market, such as product costs, liquidity issues, and uncertainty over the regulatory and legal environment.
Now, however, we see growing national momentum to address many of these challenges, which suggests that private asset investments—particularly private equity, private credit, and direct private real estate—may be poised for greater adoption in DC plans. As DC plan sponsors and their advisors and consultants explore the potential of private assets, we offer five must‑ask questions to help guide their considerations.
Level setting on private assets
(Fig. 1) Asset class overviews
Private equity |
Private credit |
Direct private real estate |
5.5x* |
5x* |
4.2x* |
Equity stakes in private companies ranging in business stage and investment type, including secondaries and coinvestment funds |
Loans (often floating rate) negotiated between lenders and borrower companies, with a range of funding structures |
Direct investment in physical properties, including residential, mixed use, and industrial |
Often more leveraged than public stocks, which may lead to higher risks and higher returns |
Generally higher yielding than traditional fixed income, with fewer defaults historically |
Can offer attractive, stable income and hedge against unexpected inflation |
Typically less liquid than public counterparts, with longer-term commitment1 |
Usually less liquid and transparent than public debt |
Requires active management of properties and tenants |
* Growth in assets under management by asset class from December 2009 to June 2024.
Source: T. Rowe Price calculations of data from Preqin Ltd.
Note: To avoid double counting of available capital and unrealized value, fund of funds and secondaries are excluded.
1 The nature of traditional private equity investing can lead to a performance pattern known as the J-curve. The curve depicts early losses during an initial investment period in which committed capital from investors is called and deployed by the investment manager, followed by gradual gains through a latter-stage harvesting period in which the manager generates and returns profits stemming from business improvements. This structure requires investors to prudently manage their cash flows and capital needs and, from a DC plan sponsor perspective, could involve additional management activity that sponsors may not be accustomed to or interested in assuming.
1. What is the value proposition?
It is generally agreed that private assets can improve a portfolio’s risk/reward profile through added diversification and enhanced return potential, particularly when managed by skilled investors. They may be less correlated to traditional assets by offering exposure to investments outside public markets. Further, appraisal‑based (as opposed to market‑based) valuation methods contribute to a smoothing effect on private asset returns, reducing reported volatility.
However, DC plan sponsors must navigate within a complex operating environment and should evaluate these potential investment benefits alongside a variety of investment, legal, and operational considerations, such as those shown in Figure 2.
2. Why now?
The concept of private assets in DC plans is hardly new. To a small degree, certain private asset investment strategies, such as direct private real estate, have been offered in DC plans for years. However, even though the use of private assets in DC plans is not prohibited—including under ERISA—their use has been curbed in part by mixed signals from regulators.
Weighing private asset integration
(Fig. 2) Potential benefits and considerations
Potential Benefits |
Considerations |
Improved performance/stronger retirement outcomes |
Possible increase in overall investment management fee |
Added portfolio diversification |
Daily valuation and liquidity needs1 |
Uncorrelated returns/reduced volatility |
Level of expertise in fiduciary oversight |
Opportunity for stable income |
Additional communication with participants |
Meaningful excess returns through skilled active management |
Benchmarking challenges |
1 Private assets generally offer an illiquidity premia, but liquidity risk should be managed carefully and can be mitigated through a multi-asset strategy.
Anticipated guidance
Sub‑regulatory guidance on the inclusion of private assets in DC plans has wavered across recent presidential administrations, but more consistent guidance may provide added market conviction and ease plan sponsors’ concerns over litigation risks.
Near the end of the first Trump administration, the Department of Labor (DOL) issued an information letter1 (sub‑regulatory guidance) asserting that DC plan fiduciaries could consider including private equity investments within professionally managed, diversified investment options, including target date funds. The guidance underscored that fiduciaries should evaluate private equity investments carefully, considering factors such as risk and return characteristics, fees, liquidity, and participant disclosures.
The DOL later adjusted—but did not discard—that position during the Biden administration, narrowing its scope and emphasizing the fiduciary duties of plans.2 Given the current political landscape, many industry groups see momentum for new guidance that could encourage the expansion of private market access in DC plans.
Notably, we observe that some DC plan sponsors and their consultants and advisors agree with the investment case for including private asset exposure, specifically within a multi‑asset investment product. But the question of regulatory clarity and fiduciary responsibility continues to give decision‑makers pause.
Getting the vehicle and fees right
Beyond the policy landscape, industry innovations may provide additional pathways to offering private markets exposure to DC plan participants. Modern DC plans, in almost all cases, trade on a daily valuation basis. Many private asset products trade differently, and private assets are priced less frequently than public ones. However, there are evolving structural approaches that enable daily liquidity and daily pricing, which is the expectation for DC plan investments.
As the market evolves, these applications will likely improve in design and availability. Collective investment trusts (CITs), for instance, are gaining consideration as a vehicle well suited for private assets in DC plans, due in part to their possible cost savings versus other product types. Some private asset investment managers already offer or are working toward offering their solutions in a CIT vehicle. At the same time, “evergreen” fund structures, which include a sleeve of public assets to manage liquidity risk, have drawn attention as a possible way to mitigate the J‑curve effect in private asset investing (see footnote in Figure 1).
For private assets to become more prevalent in DC plan investments, we believe there will need to be greater recognition that the fee environment for DC plans differs from that for qualified individual investors. DC plan sponsors are especially fee sensitive and seek compelling value‑for‑cost relationships in the products offered to participants. We believe that any inclusion of private assets, especially within multi‑asset products, needs to preserve the balance between cost and value.
3. Where are private assets likely to be implemented?
In terms of where private assets may find a home within DC plans, professionally managed, multi‑asset solutions like target date funds are the leading contender. As shown in Figure 3, data from T. Rowe Price’s 2024 Defined Contribution Consultant Study show that consultants and advisors consider target date strategies—custom or off the shelf—to be the most likely DC investment pool in which private assets could be implemented. Managed accounts, while not as prevalent or commonly used by plan participants, could also serve as a multi‑asset chassis for private asset integration.
“...consultants and advisors consider target date strategies—custom or off the shelf—to be the most likely DC investment pool in which private assets could be implemented.”
Where are private asset investment strategies most likely to be implemented in DC plans?
(Fig. 3) Responses from DC plan consultants and advisors

Source: T. Rowe Price 2024 Defined Contribution Consultant Study, September 2024.
This study included 48 questions and was conducted from January 12, 2024, through March 4, 2024. Responses were from 35 consultant and advisor firms with over 134,000 plan sponsor clients and more than $7.5 trillion in assets under advisement (AUA). The AUA figures were self-reported.
Conversely, consultants and advisors believe that a stand-alone investment option on a DC plan core menu is the least likely method of implementation. This is an important distinction when considering the broader industry discussion on private assets in DC plans, as some stakeholders have expressed concern that individual participants could have the opportunity to invest a portion or even all of their retirement plan savings in a single private asset investment strategy they may not understand.
The plain reality is that there is little demand in the plan sponsor universe to offer private asset investment strategies as stand-alone investment options.
4. What are the DC plan community’s current views on private assets?
The greatest demand for private assets appears to be among large DC plan sponsors that offer a custom target date product. Prospective DC plan investors could include large plans with investment staff who are experienced in the use of private assets within non‑DC portfolios (e.g., DB plans or endowments). These sophisticated investors generally understand the investment case for private asset allocations and may be inclined to consider adding a private asset investment strategy in a white‑label investment option(s) and/or custom target date solution(s).
96%
of DC plan advisors and consultants surveyed favor an active-only approach to private equity, private credit, and private real estate.
What’s more, our 2024 Defined Contribution Consultant Study revealed an overwhelming preference among respondent firms to use active management to implement private asset investment strategies, as Figure 4 shows. This may partly reflect the fact that private markets are almost entirely the domain of active managers, as the idiosyncratic nature of private assets lends itself to skilled, research‑driven investing. Still, manager selection is paramount, as we’ve observed meaningful dispersion in private markets between the highest and lowest performers.
5. What should plan sponsors be watching as they consider next steps?
Plan sponsors can expect policy discussions and news coverage around private market access to increase in the year ahead. But as with any investment, it’s essential to separate the signal from the noise.
Before introducing a new allocation—public or private—in a multi‑asset portfolio, the investment opportunity needs to be evaluated both individually and within the context of the broader portfolio. In other words, any private asset allocation must earn its place in the portfolio by offering unique net‑of‑fee investment benefits.
DC plan consultant and advisor perspectives
(Fig. 4) What are your firm’s philosophical views related to active and passive implementation by asset class* or investment strategy in DC plans, within either a multi‑asset or stand-alone investment?

Source: T. Rowe Price 2024 Defined Contribution Consultant Study.
* Illustration reflects survey results specific to the private equity, private credit, and private real estate asset classes.
This is a crucial threshold as asset managers and plan sponsors consider incorporating private assets into multi‑asset products like target date solutions. For example, to justify the additional complexities of private investing, any investment should offer performance or diversification benefits that are meaningfully differentiated from what can be achieved in public markets—an objective that can be complicated by the appraisal‑based nature of private asset valuations. For these reasons, we encourage plan sponsors to keep a close eye on investment research that could influence private asset integration, such as the type of analysis shown in Figures 5 and 6.
Yet retirement investors also have unique needs that go beyond the investment merits of a particular approach. To that end, plan sponsors should consider factors such as the rate at which capital can be and remain invested, liquidity terms, leverage levels, and costs if and when they have broader discussions around risk appetite, participant communication strategies, and internal capacity to evaluate product offerings.
Hypothetical portfolio outcomes using reported and adjusted volatilities
(Fig. 5) Annualized risk and return results from adding a 20% allocation to private assets

March 2005 through September 2024.
Sources: Bloomberg Finance L.P., Standard & Poor’s, Cambridge Associates LLC, Cliffwater LLC, NCREIF (see Additional Disclosures). All data analysis by T. Rowe Price. See appendix for a list of representative benchmarks for the asset classes shown.
The information shows hypothetical results, which are shown for illustrative purposes only and are not indicative of realized past or future performance. Actual investment results may differ significantly. As the hypothetical portfolios are based on the performances of market indexes as described, performance does not incorporate fees, expenses, or any other costs associated with an actual investment. See the appendix for details on the allocation weights and for important information regarding hypothetical performance.
Note: Private asset returns can be adjusted to account for smoothing in several ways. The first-order autoregressive, or AR(1), model used in the table above postulates that the reported return is a weighted average of the true unobserved return for that quarter and the return in the prior quarter.
* Conditional value at risk (CVaR) is the weighted average of the “extreme” losses in the tail of a distribution of returns. 95% CVaR = the weighted loss in the lowest 5% of extreme tail events.
A closer look at risk characteristics
(Fig. 6) Reported and adjusted annualized volatilities and public equity correlations
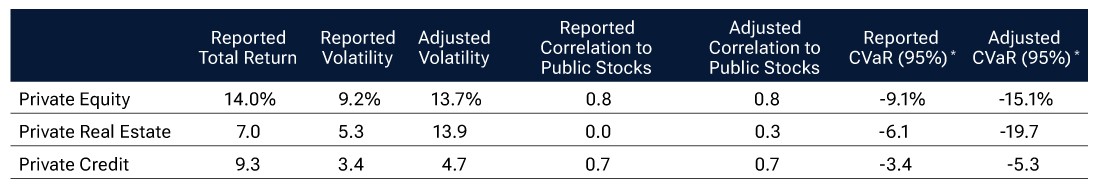
March 2005 through September 2024.
Sources: Cambridge Associates LLC, Cliffwater LLC, NCREIF. All data analysis by T. Rowe Price. See appendix for a list of representative benchmarks for the asset classes shown.
Past performance is not a guarantee or a reliable indicator of future performance.
Note: Private asset returns can be adjusted to account for smoothing in several ways. The first-order autoregressive, or AR(1), model used in the table above postulates that the reported return is a weighted average of the true unobserved return for that quarter and the return in the prior quarter.
* CVaR is the weighted average of the “extreme” losses in the tail of a distribution of returns. 95% CVaR = the weighted loss in the lowest 5% of extreme tail events.
What we’re watching
We are carefully researching and considering private asset investment in the context of DC multi‑asset portfolios. As we closely monitor the product development landscape and evaluate potential structures, we are weighing the potential investment benefits of private assets against the nuances of retirement investing.
From a portfolio construction standpoint, T. Rowe Price has developed a comprehensive framework for evaluating private assets alongside public investments, which can be applied across portfolio designs. Using this framework, we can study hypothetical portfolio outcomes under various allocation mixes while adjusting for the effect that smoothing can have on private asset returns and volatility in both normal and adverse market conditions (Figure 5). We can also use this framework to examine asset class correlations more accurately (Figure 6).
Over the years, similar research has helped us thoughtfully evolve the design of our target date strategies. For example, we added nontraditional asset classes, such as real assets and hedged equity, to help mitigate various risks and deliver more durable long-term outcomes.
We believe this research-driven approach can provide an advantage for DC plan stakeholders evaluating private asset opportunities.
The bottom line
As we collaborate with the DC plan community in exploring potential private asset integration, we remain focused on our North Star: building professionally managed, multi‑asset portfolios to create value for participants. This includes consistent awareness of the operational needs and realities of DC plans, such as daily valuation and liquidity and the importance of the value-for-fee relationship. Above all, it means supporting retirement savers in achieving their desired retirement outcomes.
Appendix
Figure A1: Representative indexes
Public Stocks (U.S. Large-Cap) |
S&P 500 Index |
Public Bonds (U.S.) |
Bloomberg U.S. Aggregate Bond Index |
Private Equity |
Cambridge Associates LLC U.S. Private Equity Index |
Private Credit |
Cliffwater Direct Lending Index |
Private Real Estate |
NCREIF Property Index |
Figure A2: Allocation weights in hypothetical portfolios
|
Portfolio Weights |
||||
|
Public Stock |
Public Bond |
Private Equity |
Private Real Estate |
Private Credit |
Base 60/40 Stock/Bond |
60% |
40% |
— |
— |
— |
With 20% Private Equity |
40 |
40 |
20% |
— |
— |
With 20% Private Real Estate |
48 |
32 |
— |
20% |
— |
With 20% Private Credit |
48 |
32 |
— |
— |
20% |
Important information regarding hypothetical results
Hypothetical results: The information provided above reflects data for hypothetical portfolios based on the theoretical blending of the indicated benchmarks. It does not reflect the actual returns of any portfolio or strategy. For the applicable hypothetical portfolios, the assumption of constant benchmark weights has been made for modeling purposes and is unlikely to be realized. Results shown for blended portfolios are hypothetical, do not reflect actual investment results, and are not a guarantee of future results. Hypothetical results were developed with the benefit of hindsight and have inherent limitations. Hypothetical results do not reflect actual trading or the effect of material economic and market factors on the decision-making process. Results are based on recognized broad market indexes and would not reflect fees associated with an actively managed portfolio. Results have been adjusted to reflect the reinvestment of dividends and capital gains. Actual returns may differ significantly from the results shown above. It is not possible to invest in an index. Different time periods would yield different results.
Get insights from our experts.
Subscribe to get email updates including article recommendations relating to retirement income.
-
1 See DOL Employee Benefits Security Administration Information Letter 06‑03‑2020.
2 See DOL Supplement Statement on Private Equity in Defined Contribution Plan Designated Investment Alternatives, December 2021.
Additional Disclosures
Bloomberg® and Bloomberg U.S. Aggregate Bond Index are service marks of Bloomberg Finance L.P. and its affiliates, including Bloomberg Index Services Limited (“BISL”), the administrator of the index (collectively, “Bloomberg”) and have been licensed for use for certain purposes by T. Rowe Price. Bloomberg is not affiliated with T. Rowe Price, and Bloomberg does not approve, endorse, review, or recommend T. Rowe Price products or services. Bloomberg does not guarantee the timeliness, accurateness, or completeness of any data or information relating to T. Rowe Price products or services.
The S&P 500 Index is a product of S&P Dow Jones Indices LLC, a division of S&P Global, or its affiliates (“SPDJI”) and has been licensed for use by T. Rowe Price. Standard & Poor’s® and S&P® are registered trademarks of Standard & Poor’s Financial Services LLC, a division of S&P Global (“S&P”); Dow Jones® is a registered trademark of Dow Jones Trademark Holdings LLC (“Dow Jones”) and these trademarks have been licensed for use by SPDJI and sub-licensed for certain purposes by T. Rowe Price. T. Rowe Price products are not sponsored, endorsed, sold or promoted by SPDJI, Dow Jones, S&P, their respective affiliates and none of such parties make any representation regarding the advisability of investing in such product(s) nor do they have any liability for any errors, omissions, or interruptions of the S&P 500 Index.
CFA® and Chartered Financial Analyst® are registered trademarks owned by CFA Institute.
CAIA® is a registered certification mark owned and administered by the Chartered Alternative Investment Analyst Association.
-
Important Information
This material is provided for informational purposes only and is not intended to be investment advice or a recommendation to take any particular investment action.
The views contained herein are those of the authors as of April 2025 and are subject to change without notice; these views may differ from those of other T. Rowe Price associates.
This information is not intended to reflect a current or past recommendation concerning investments, investment strategies, or account types, advice of any kind, or a solicitation of an offer to buy or sell any securities or investment services. The opinions and commentary provided do not take into account the investment objectives or financial situation of any particular investor or class of investor. Please consider your own circumstances before making an investment decision.
Information contained herein is based upon sources we consider to be reliable; we do not, however, guarantee its accuracy. Actual future outcomes may differ materially from any estimates or forward-looking statements provided.
Past performance is not a guarantee or a reliable indicator of future results. All investments are subject to market risk, including the possible loss of principal. Private investments are typically speculative and exposed to a high degree of business and financial risk. They may be leveraged and engage in speculative practices that increase the risk of investment loss and cause performance volatility. All charts and tables are shown for illustrative purposes only.
T. Rowe Price Investment Services, Inc. For Institutional Investors Only.
© 2025 T. Rowe Price. All Rights Reserved. T. ROWE PRICE, INVEST WITH CONFIDENCE, the Bighorn Sheep design, and related indicators (troweprice.com/en/intellectual-property) are trademarks of T. Rowe Price Group, Inc. All other trademarks are the property of their respective owners.
202504-4413698
Get the full story.
We’re ready to share our latest thinking, but industry regulations require you to register or sign in to continue reading this article. Thank you for understanding.
Just one more step.
To continue, you are required to read and accept our Terms & Conditions. Thank you for understanding.
-
Important Information
This material is provided for informational purposes only and is not intended to be investment advice or a recommendation to take any particular investment action.
The views contained herein are those of the authors as of April 2025 and are subject to change without notice; these views may differ from those of other T. Rowe Price associates.
This information is not intended to reflect a current or past recommendation concerning investments, investment strategies, or account types, advice of any kind, or a solicitation of an offer to buy or sell any securities or investment services. The opinions and commentary provided do not take into account the investment objectives or financial situation of any particular investor or class of investor. Please consider your own circumstances before making an investment decision.
Information contained herein is based upon sources we consider to be reliable; we do not, however, guarantee its accuracy. Actual future outcomes may differ materially from any estimates or forward-looking statements provided.
Past performance is not a guarantee or a reliable indicator of future results. All investments are subject to market risk, including the possible loss of principal. Private investments are typically speculative and exposed to a high degree of business and financial risk. They may be leveraged and engage in speculative practices that increase the risk of investment loss and cause performance volatility. All charts and tables are shown for illustrative purposes only.
T. Rowe Price Investment Services, Inc. For Institutional Investors Only.
© 2025 T. Rowe Price. All Rights Reserved. T. ROWE PRICE, INVEST WITH CONFIDENCE, the Bighorn Sheep design, and related indicators (troweprice.com/en/intellectual-property) are trademarks of T. Rowe Price Group, Inc. All other trademarks are the property of their respective owners.
202504-4413698