 On the Horizon
2026 Global Market Outlook: Minds, machines and market shifts
Balancing AI winners with broader opportunities and enduring risks
AI (artificial intelligence) is powering measurable change—and this will continue in 2026. But rapid capital deployment has led to stretched valuations in AI sectors, raising concerns about speculative bubbles and sustainability. Investors must balance excitement with disciplined analysis and risk management.
Meanwhile, the world continues to grapple with non-AI forces. Inflation remains stubborn in many developed economies, growth trajectories are diverging and geopolitical uncertainty—from trade tensions to the war in Ukraine—is adding further complexity to the global outlook.
Navigating this environment will require balancing exposure to enduring AI leaders with emerging opportunities in cyclical and international markets—while remaining vigilant to persistent macro risks. The age of speculation is giving way to real-world results, but investors must be mindful that old challenges—valuation, inflation, and geopolitical uncertainty—remain firmly in play.
We are facing a rapidly evolving investment landscape shaped by the impact of AI, expansionary fiscal policies, and shifting geopolitics.
In the US, AI-driven investment and government stimulus are reigniting growth. However, with upside risks to inflation, the Fed faces a delicate balancing act. In Europe, as tariff-related front-loading fades, manufacturing may weaken - with the European Central Bank likely to ease policy. Japan faces rising inflation, though fiscal measures should support growth. Emerging markets have managed inflation and debt and shown tariff resilience. While the backdrop is favorable, trade policy remains a risk.
Equity markets are broadening, both within AI-related sectors and beyond. AI enters a new phase with clear signs of monetization. Hardware and hyperscalers will still lead the way, but the evolution from digital AI, like software, to physical AI infrastructure is unlocking opportunities across materials, energy, and industrials. International and small-cap equities are increasingly appealing, supported by fiscal stimulus and improving cyclical conditions.
In fixed income, we expect higher yields and steeper curves reflecting ambitious fiscal agendas. High yield bonds and bank loans offer compelling income, but credit selection is key. Inflation-protected bonds and select emerging markets provide tactical opportunities.
Private markets are being revitalized. Stable rates and high demand for capital—especially for AI infrastructure—are fueling a wave of dealmaking and bespoke credit solutions. While fundamentals are robust, idiosyncratic risks must be tightly managed.
2026 will require agility. The age of speculation is giving way to real-world results, but old challenges—valuation, inflation, and geopolitics —remain. Navigating this new era calls for adaptability, a global lens, and a focus on both innovation and resilience.
- Economic Outlook
- Artificial Intelligence
- Equity Outlook
- Fixed Income Outlook
- Private Markets
- Asset Allocation
The U.S. economy is shaking off the 2025 growth scare, but the eurozone may lag as tariff front‑loading weighs on manufacturing.
The U.S. economy is set to rebound in 2026, driven by AI spending and fiscal expansion, while Europe may lag due to early tariffs draining manufacturing demand. Emerging markets have inflation and debt under control, but tariffs remain a risk. Central banks' policy paths will diverge, with easing likely in the UK and eurozone, and tightening in Japan.
As of November 14, 2025
For illustrative purposes only. Actual future outcomes may differ materially from forward-looking statements.
Source: T. Rowe Price.

AI is poised to be the biggest productivity driver since electricity, but soaring capex and the growing use of debt finance are fueling demands for clear monetization strategies.
AI’s story is shifting from possibility to profitability. Investment and innovation are booming, but bubble concerns are growing amid rising valuations and speculative activity in some areas of the market. Investors need to focus not only on visionary technology, but also on execution, financial discipline and clear paths to monetization.
Beyond tech—AI’s transformative potential across sectors
Capital expenditure1 building across the sectors and the AI ecosystem

1 Capex (capital expenditure) refers to a company’s spending in long-term assets such as property, technology, or equipment.
Source T. Rowe Price. For Illustrative purposes only.
Equity market leadership is broadening as AI gains spread, while fiscal stimulus and reindustrialization are driving opportunities beyond U.S. tech.
While AI continues to be a transformative force, we anticipate broader market participation in 2026. Within AI, the focus is shifting from digital to physical infrastructure. At the same time, fiscal stimulus and deregulation are creating opportunities in different sectors and across the globe. It is becoming clearer that the equity market’s “good ponds” are no longer confined to U.S. tech.
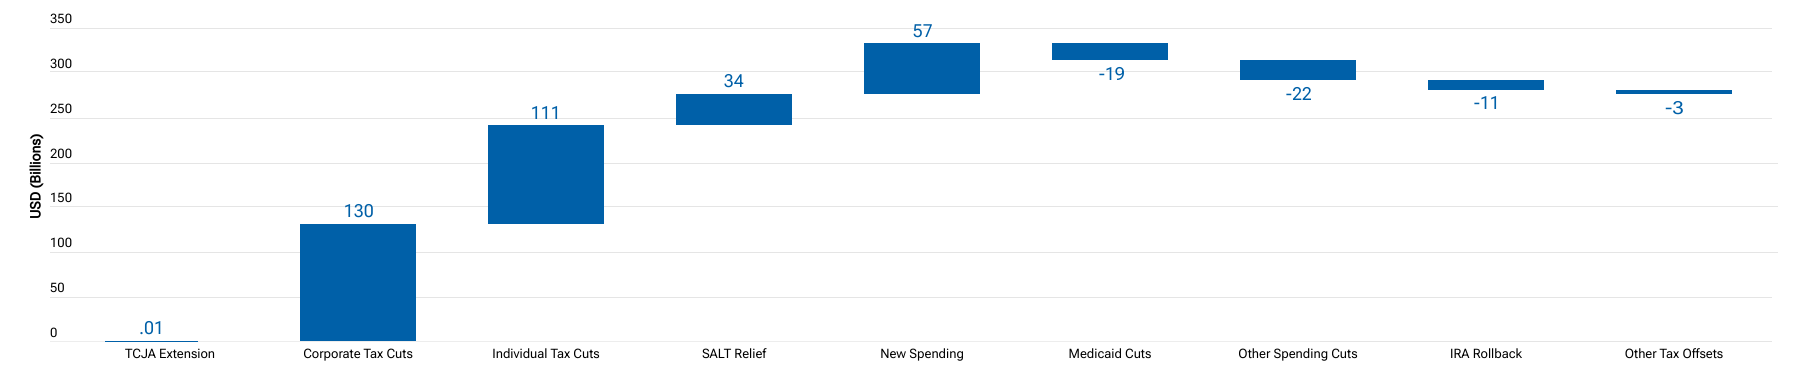
Net fiscal impulse from One Big Beautiful Bill Act estimated in FY 2026
Billions of USD vs. current policy
As of September 2, 2025.
Sources: Wolfe Research Portfolio Strategy, Wolfe Research DC Policy, and Bloomberg.“Fiscal impulse” refers to the impact of government fiscal policy on the economy. TCJA = Tax Cuts and Jobs Act; SALT = state and local tax; IRA = Inflation Reduction Act; FY = fiscal year.
Actual outcomes may differ materially from estimates. Estimates are subject to change.
We anticipate there will be selective opportunities in credit, but expansionary fiscal policy will drive longer‑maturity government bond yields higher.
Despite tight spreads, there will still be credit opportunities in 2026—however, selectivity will be crucial. Sub-investment-grade bonds and bank loans offer attractive yields versus equities, while expansionary fiscal policy is likely to drive government bond yields higher. Inflation-protected bonds in the U.S. and parts of Europe and Japan appear attractive, while opportunities also exist in select emerging market rates.
4.11%
2.67%
6.78%
1 Bloomberg Finance L.P. Yield to maturity is the total return anticipated on a bond held to maturity assuming all the securities are held to maturity.
2 As of October 31, 2025. The Yield of the High Yield market is represented by the Bloomberg US HY 2% Issuer Capped Bond Index. Yield to worst is a measure of the lowest possible yield on a bond whose contract includes provisions that would allow the issuer to redeem the securities before they mature. Source: Bloomberg Finance L.P.
Stabilizing interest rates, lower market volatility and demand from AI‑related projects are helping to end the drought in key deal markets, driving renewed growth in private equity and credit.
Private markets are set for growth in 2026 as stabilizing rates and rising AI-driven capital needs revive the IPO and M&A markets. Private equity exits are increasing, and demand for private credit—especially for tech infrastructure—is strong. Opportunities span lending, distressed, and bespoke solutions, with fundamentals robust despite some idiosyncratic risks.
We favor stocks over bonds as we expect the two-speed economy to avoid recession, and non-U.S. currency exposure as a way to benefit from likely U.S. dollar weakness.
The U.S. economy is set for further growth, but stretched valuations complicate tactical asset allocation. We favor stocks over bonds given inflation risk, with international and small‑cap stocks best positioned. High yield offers a lower‑risk way, relative to equities, to benefit from a strong economy, and we prefer unhedged exposure to non‑U.S. currencies given the weakening dollar.
2026 tactical allocation views
| Asset Class | Underweight | Neutral | Overweight |
|---|---|---|---|
| Equities | - | - | |
| Bonds | - | - | |
| Cash | - | - |
As of October 31, 2025
For informational purposes only. This material is not intended to be investment advice or a recommendation to take any particular investment action. Actual future outcomes may differ materially from any forward-looking statements made.
| Region | Underweight | Neutral | Overweight |
|---|---|---|---|
| U.S. | - | - | |
| Europe | - | - | |
| U.K. | - | - | |
| Japan | - | - | |
| Canada | - | - | |
| Australia | - | - | |
| Emerging Markets | - | - | |
| China | - | - |
As of October 31, 2025
For informational purposes only. This material is not intended to be investment advice or a recommendation to take any particular investment action. Actual future outcomes may differ materially from any forward-looking statements made.
| Style | Underweight | Neutral | Overweight |
|---|---|---|---|
| U.S. Growth | - | - | |
| U.S. Value | - | - | |
| Global Ex-U.S. Growth | - | - | |
| Global Ex-U.S. Value | - | - | |
| U.S. Large-Cap | - | - | |
| U.S. Mid-Cap | - | - | |
| U.S. Small-Cap | - | - | |
| Global Ex-U.S. Large-Cap | - | - | |
| Global Ex-U.S. Small-Cap | - | - | |
| Real Assets Equities | - | - |
As of October 31, 2025
For informational purposes only. This material is not intended to be investment advice or a recommendation to take any particular investment action. Actual future outcomes may differ materially from any forward-looking statements made.
The asset classes across the equity and fixed income markets shown are represented in our multi‑asset portfolios. Certain style and market capitalization asset classes are represented as pairwise decisions as part of our tactical asset allocation framework.
| Sector | Underweight | Neutral | Overweight |
|---|---|---|---|
| U.S. Investment Grade (IG) | - | - | |
| Developed Ex-U.S. IG (USD Hedged) | - | - | |
| U.S. Long-Term Treasuries | - | - | |
| Inflation-Linked | - | - | |
| Global High Yield | - | - | |
| Floating Rate Loans | - | - | |
| Emerging Market (EM) Dollar Sovereigns | - | - | |
| EM Local Currency Bonds | - | - |
As of October 31, 2025
For informational purposes only. This material is not intended to be investment advice or a recommendation to take any particular investment action. Actual future outcomes may differ materially from any forward-looking statements made.
The asset classes across the equity and fixed income markets shown are represented in our multi‑asset portfolios. Certain style and market capitalization asset classes are represented as pairwise decisions as part of our tactical asset allocation framework.
Investment Risks:
International investments can be riskier than U.S. investments due to the adverse effects of currency exchange rates, differences in market structure and liquidity, as well as specific country, regional, and economic developments. The risks of international investing are heightened for investments in emerging market and frontier market countries.
Investing in technology stocks entails specific risks, including the potential for wide variations in performance and usually wide price swings, up and down. Technology companies can be affected by, among other things, intense competition, government regulation, earnings disappointments, dependency on patent protection and rapid obsolescence of products and services due to technological innovations or changing consumer preferences.
Small-cap stocks have generally been more volatile in price than the large-cap stocks. Investing in private companies involves greater risk than investing in stocks of established publicly traded companies. Risks include potential loss of capital, illiquidity, less available information and difficulty in valuating private companies. They are not suitable, nor available, for all investors.
Fixed-income securities are subject to credit risk, liquidity risk, call risk, and interest-rate risk. As interest rates rise, bond prices generally fall. Investments in high-yield bonds involve greater risk of price volatility, illiquidity, and default than higher-rated debt securities. Investments in bank loans may at times become difficult to value and highly illiquid; they are subject to credit risk such as nonpayment of principal or interest, and risks of bankruptcy and insolvency.
Some or all alternative investments such as private credit, may not be suitable for certain investors. Alternative investments are typically speculative and involve a substantial degree of risk. In addition, the fees and expenses charged may be higher than the fees and expenses of other investment alternatives, which will reduce profits. As interest rates rise, bond prices generally fall. Investments in high yield bonds involve greater risk of price volatility, illiquidity, and default than higher rated debt securities.
Inflation-Linked Bonds (Treasury Inflation Protected Securities in the U.S.): In periods of no or low inflation, other types of bonds, such as US Treasury Bonds, may perform better than Treasury Inflation Protected Securities (TIPS).
Important Information
This material is being furnished for informational and/or marketing purposes only and does not constitute an offer, recommendation, advice, or solicitation to sell or buy any security.
Prospective investors should seek independent legal, financial and tax advice before making any investment decision. T. Rowe Price group of companies including T. Rowe Price Associates, Inc. and/or its affiliates receive revenue from T. Rowe Price investment products and services.
Past performance is not a guarantee or a reliable indicator of future results. All investments involve risk, including possible loss of principal.
Information presented has been obtained from sources believed to be reliable, however, we cannot guarantee the accuracy or completeness. The views contained herein are those of the author(s), as of November 14, 2025, are subject to change, and may differ from the views of other T. Rowe Price Group companies and/or associates. Under no circumstances should the material, in whole or in part, be copied or redistributed without consent from T. Rowe Price.
All charts and tables are shown for illustrative purposes only. Actual future outcomes may differ materially from any estimates or forward-looking statements provided.
The material is not intended for use by persons in jurisdictions which prohibit or restrict the distribution of the material and in certain countries the material is provided upon specific request.
USA—Issued in the USA by T. Rowe Price Investment Services, Inc., distributor and T. Rowe Price Associates, Inc., investment adviser, 1307 Point Street, Baltimore, MD 21231, which are regulated by the Financial Industry Regulatory Authority and the U.S. Securities and Exchange Commission, respectively.
© 2025 T. Rowe Price. All Rights Reserved. T. ROWE PRICE, INVEST WITH CONFIDENCE, the Bighorn Sheep design, and related indicators (troweprice.com/ip) are trademarks of T. Rowe Price Group, Inc. All other trademarks are the property of their respective owners.
202511-4975467