

Emerging Markets and the Need to Go Beyond the BRICs
- For many global equity investors, emerging markets (EM) exposure has been a source of performance pain in recent years. While bearish sentiment has grown for EMs, much of the underperformance has been concentrated within the BRICs, as the pillars of the long-term growth and return thesis have come under intensifying scrutiny.
- While the highs and lows of sentiment have clearly played a role, the volatility of recent years is indicative of real change in the emerging world that requires understanding.
- With the fundamental and structural changes happening within the EM world, investors should embrace the view that the EM thesis has evolved.
- While disconcerting for some, this evolution implies opportunity, the mispricing of assets and also the need to move beyond the BRICs to capture the trends that will define the next decade of the EM story.
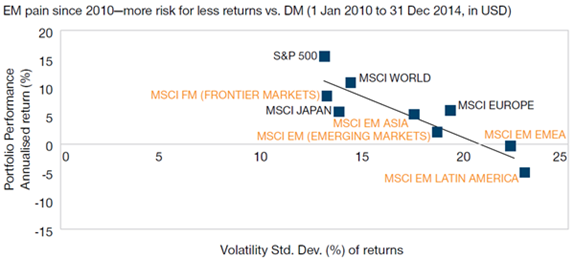
For many global investors, EMs have been a challenging place to generate return over the past few years. This is even more apparent when considering the perspective of developed market (DM) equities which have been in the midst of one of the biggest bull market rallies in history. When factoring in the added volatility that EMs have delivered (Figure 1), the performance of EM indices appears to defy the principal of investment theory that higher volatility is compensated via higher returns (over the long term, at least).
FIGURE 1: Emerging markets and unrewarded volatility
As at 31 Dec 2014
Sources: Robert Shiller, DataStream, Goldman Sachs Global ECS Research, FactSet, MSCI, and Zephyr Style Advisor.
There are two predominant reasons behind the unflattering comparison of EM and DM equities. Firstly, the re-rating of developed world equity valuations has exerted a powerful influence on DM equity returns, especially since “the death of equities” was pronounced toward the end of 2011. This can be observed via the MSCI World Index forward P/E reaching a trough of 10x earnings at the end of September 2011, before rising to 16.6x by the end of Q1 2015. This has followed a mixture of global QE and an improving US economy, which has fuelled an ongoing hope of a real recovery in economic conditions. Put simply, in this particular equity cycle, the “stop getting worse” phase has been a powerful driver of DM returns. Moreover, it has come before broad-based evidence that the improvement phase of the corporate earnings cycle had actually been established.
The MSCI EM index has missed out on the majority of this re-rating process, however, with its P/E rating rising more modestly from of 8.6x to 11.5x earnings over the same period quoted above. While there are several reasons behind this, most paramount is that the EM economic growth premium over the DM world has been narrowing from a peak of over 6% in 2007 to around 3% today. In tandem, aggregate EM earnings have disappointed versus expectations.
CORPORATE EARNINGS— DISPROPORTIONATELY PUNISHED?
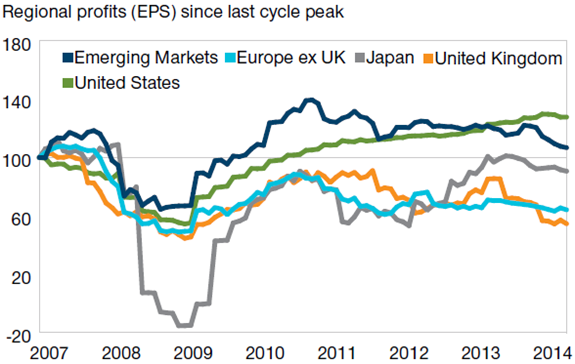
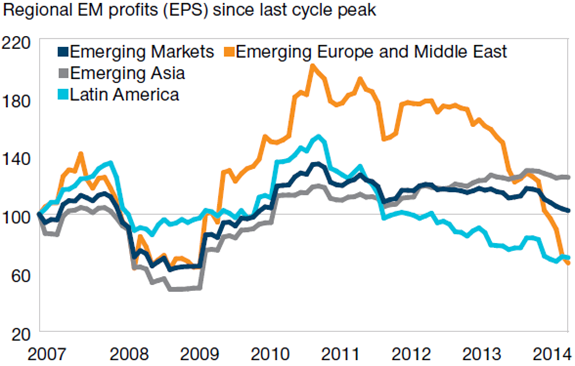
While economic growth is a crucial part of the long-term case for EM investing, it is the delivery of superior corporate earnings growth that explains the majority of EM stock returns over the long term. With aggregate EM profits contracting since 2012, the reaction of markets and the souring of sentiment has been especially brutal in this cycle (Figure 2).
FIGURE 2: Earnings disappointment has been punished in EM (but not Europe!)
As at 31 Mar 2015
Sources: FactSet, MSCI, and Citi Research.
However, one key point highlighted by breaking up the aggregate trend in EM earnings into regional constituent parts is that the aggregate does not represent an accurate indicator of profits delivery in any single region. Indeed, this is why DM earnings are rarely aggregated because it would disguise the huge variance between the likes of Europe, Japan and the US since the global financial crisis. In the case of EM, this is one clear example of how simplistic aggregate data can be misleading and, more importantly, how the shared characteristics of EMs are waning. This breakdown in the correlation of fundamentals (both economic and corporate) implies a real need to consider whether EMs should be considered as an asset class in benchmark terms or as a collection of opportunities with a large and growing diversity of characteristics.
EMERGING MARKET EVOLUTION
Since the global financial crisis, there has been a rising focus on what global macroeconomic conditions in this era mean for the future of the emerging world. While this top-down focus is natural, one reality that has quietly evolved is the rotation of country and sector fundamentals and returns.
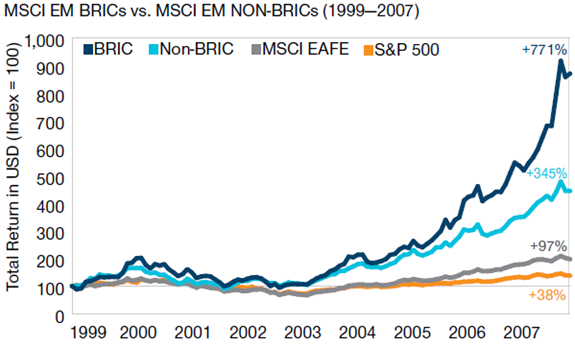
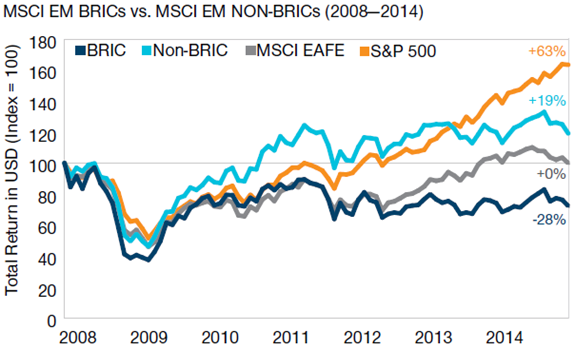
Whether looking at absolute or relative returns, economic growth figures or delivered earnings growth, many EM index statistics over the past few years have made for painful viewing. However, it’s important to note that the nature of index construction has played a big role in how disappointing the picture has been for EMs. This is because much of the pain felt by investors has centered on the largest EMs, most notably the BRICs (Figure 3), reversing the powerful trend of steady and consistent outperformance that followed the Asian and Russian financial crises in 1997- 98, but largely ended as the global economy collapsed in 2008.
FIGURE 3: The decade of the BRICs and life post the Global Financial CrisisAs at 31 Dec 2014
Sources: FactSet, MSCI
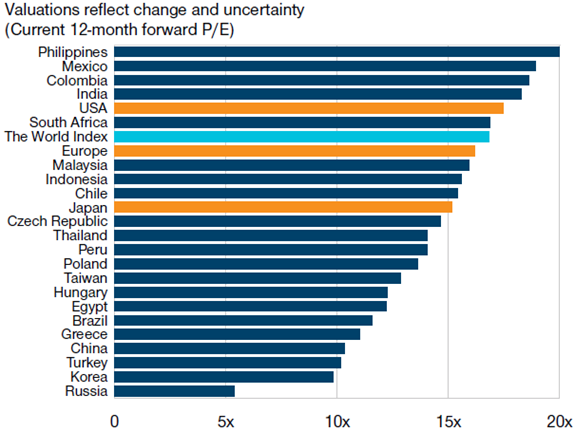
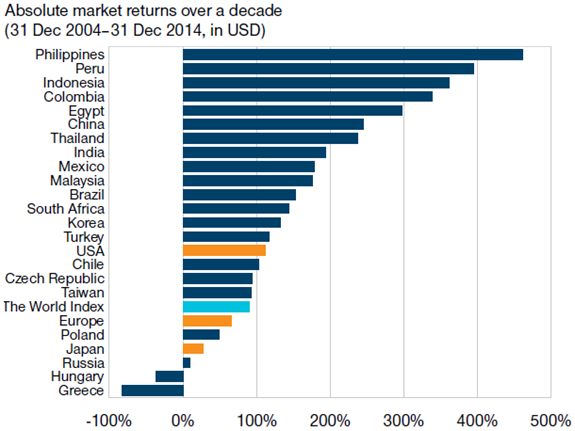
So why have non-BRIC EM stocks fared better? We believe this is largely because more non-BRIC nations have delivered to a greater degree on the promise of the EM thesis put forth a decade ago—that economic growth, fuelled by domestic factors such as favorable demographics and consumption growth, would lead to superior corporate profitability, which would drive superior returns for investors. While the path has not always been smooth, non-BRIC countries such as the Philippines, Peru, Indonesia, Egypt and Thailand have delivered on this promise over the past decade. In contrast, where this thesis has failed, as is the case with Russia, there has been commensurate underperformance versus other EM countries and versus DM peers (Figure 4).
Disappointment and elevated risks surrounding Russia can clearly be seen in the market’s valuation. This reinforces the need to look at EMs individually when defining the investment case. While the MSCI EM Index P/E trades at a level of 11.5x forward earnings, this is heavily influenced by some of the large benchmark constituents in the index.
Figure 4: Dispersion of EM fundamentals
Sources: FactSet, MSCI.
Today, when considering the most fertile growth economies within the EM world, valuations have now largely normalised. For these stocks, it is now the power of long-term compounded earnings growth that will drive returns forward. In a world of low growth, economies such as the Philippines, Indonesia and India contain growth assets that are worthy of loftier valuations in our view.
The divergence in performance in recent years has also led to a reshaping of the country landscape in the MSCI EM benchmark. Three of the four BRICs have lost index weighting, led by Russia, which is now just 4% of the MSCI Emerging Markets benchmark having peaked at 11% in 2008. Asia, excluding China and India, has risen from 30% to almost 38% currently.
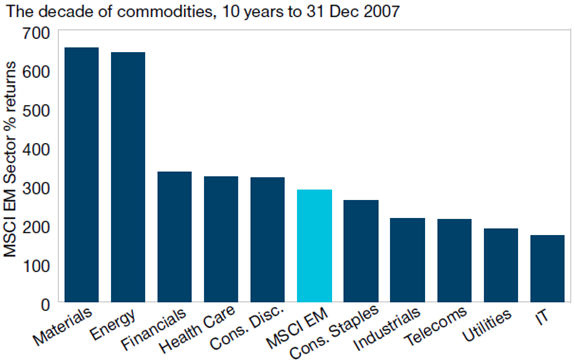
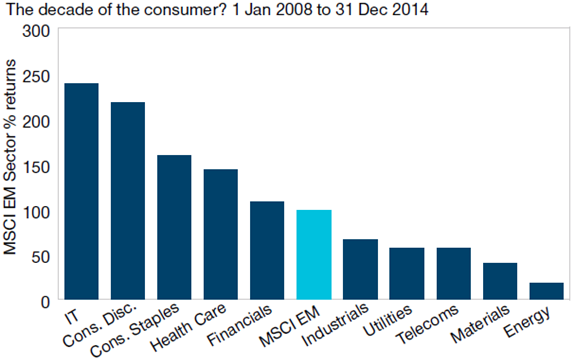
We have also seen a change at a sector level, with the end of the commodity super-cycle causing energy and materials sectors to underperform materially and make way for consumption and technology-oriented sectors (Figure 5). This is an important trend on the basis that the commodity cycle has structurally evolved, as opposed to just cyclically. If maintained, this will herald a new era for many EM economies, creating both positive and negative drivers on a country-specific basis.
FIGURE 5: Change of leadership by sector
As at 31 Dec 2014
Sources: FactSet, MSCI
THE BRIC THESIS REVISITED
Emerging markets have grown and evolved materially over the past 15 years. In many respects, this evolution has reached a point where the reality of investing now surpasses the simplicity of the badges that seek to define (or confine) the collective group of stocks. This evolution from a collective group driven by similar fundamental drivers to a dispersed set of fundamental opportunities is most apparent in the BRICs, the economic titans that were expected to drive the EM story forward.
Taking the current fundamentals of Brazil and Russia, economic growth has collapsed with economic contraction possible in both countries in 2015. Brazil remains a vibrant demographic story with excellent long-term potential, but twin deficits and a lack of political preparedness for a world defined by lower growth and commodity prices has left the economy in a very vulnerable short-term position. Russia, meanwhile, fails to meet many of the criteria that originally underpinned the BRIC thesis. Poor demographics, political isolation and an economic reliance on energy prices have all compounded genuine economic risks, both near and long term.
China still retains its advantaged economic growth backdrop and continues to be supported by growing urbanisation and industrialisation, as well as increasingly strong domestic consumption. However, the days of its economy growing by over 10% p.a. are over, with GDP growth in the 6% to 7% range likely for the medium term— still high in comparison with the rest of the world, but not encouraging for those who look for acceleration to find comfort. While painful for Russia and Brazil, the drivers of Chinese growth are being rebalanced away from the capital investment that created such a strong decade for commodity prices, with the focus now on achieving more sustainable consumption-led growth. The path will not be smooth given debt overhangs and over-capacity issues, but the opportunity by industry and stock remains a rich one.
India holds much more cause for optimism given that its economy retains so many of the positive fundamentals that create a fertile growth environment. In addition to its advantaged growth position, structural reforms taken by Prime Minster Narendra Modi are encouraging. Along with a budget targeting both economic stability and the unlocking of supply bottlenecks, we have seen the introduction of a credible new monetary policy framework, with the Reserve Bank of India aiming to bring down CPI inflation to around 4%. The fact that the central bank has committed itself to an inflation target is a positive for sentiment and reflects a greater buy-in and long-term thinking from the political establishment. In just eighteen months, India has moved from being at the centre of the fragile-five storm, to be held up as a reformist, growing economy with falling inflation and a minimal current account deficit.
ANOTHER TAPER TANTRUM?
Given that EMs sold off sharply in 2013 on the announcement that the US Federal Reserve was “tapering” its QE program, many investors are asking whether the scene is set for a repeat sell-off as we approach the long anticipated first hike in US interest rates. When (and we believe it is a case of when rather than if) interest rates do start to rise, EM stocks may indeed suffer a temporary pullback as investors reach for the historic playbook of EM returns in a world of rising US rates. Importantly, while the timing of rate hikes is still debated with intense scrutiny, the path of higher rates should not come as such a shock, as it did when first announced in 2013. This should soften the impact. In addition, we have also seen both Japan and Europe ease monetary policy since 2013, allaying some of the concerns surrounding EM access to capital in a world of rising DM rates and tightening DM liquidity.
Moreover, much of the concern during the taper tantrum centred on whether EM policy makers would act rationally and thoughtfully in the face of twin deficits that were real sources of potential risk and instability. While the policy action has varied country by country, there are good reasons to believe that many policymakers are aware of the actions necessary to avoid the conditions that can lead to scenarios of real economic crisis. Indeed, the likes of India and Indonesia have surprised with their reform programs and the balanced approach to acknowledging the need for economic stability to attract and retain global capital. Together with oil price declines that have aided inflation control as well as current account and fiscal deficits in many EM nations, the conditions for a taper/tightening tantrum part II seem less obvious.
THE EVOLUTION OF EMERGING MARKETS AND THE NEED FOR CHANGE
Ultimately, we believe there is a better way for investors who have sought to gain their EM exposure predominantly through the BRIC markets within a global equity approach. We would encourage investors to identify whether their portfolios are set to capture the best of the EM thesis over the next decade given the evolution of the universe. In our view, the BRIC markets have fundamentally changed over the past decade with the positive change thesis playing out very unevenly. Therefore, there is a need for adjustment as we move forward.
We would stress that there is a very strong case for selectivity within investing, and this belief does not infer a strong case for a passive, benchmark-oriented approach. The end of the commodity super-cycle and the evolution taking place within many EM economies is real and will have strong implications, both negative and positive. Investors will need to think in a more granular way in order to capture these trends. We believe we will see an uneven world going forward, with less correlation and more dispersion of returns across countries, sectors and stocks. While it is a more complex environment, this should provide more opportunities for thoughtful investors to take advantage of valuation anomalies and temporary crises of confidence that is part of investing. Importantly, with a focus on fundamentals, there still remain many opportunities for global investors to benefit from the EM world.
2015-GL-1743
重要情報
当資料は、ティー・ロウ・プライス・アソシエイツ・インクおよびその関係会社が情報提供等の目的で作成したものを、ティー・ロウ・プライス・ジャパン株式会社が翻訳したものであり、特定の運用商品を勧誘するものではありません。また、金融商品取引法に基づく開示書類ではありません。当資料における見解等は資料作成時点のものであり、将来事前の連絡なしに変更されることがあります。当資料はティー・ロウ・プライスの書面による同意のない限り他に転載することはできません。
資料内に記載されている個別銘柄につき、売買を推奨するものでも、将来の価格の上昇または下落を示唆するものでもありません。また、当社ファンド等における保有・非保有および将来の組入れまたは売却を示唆・保証するものでもありません。投資一任契約は、値動きのある有価証券等(外貨建て資産には為替変動リスクもあります)を投資対象としているため、お客様の資産が当初の投資元本を割り込み損失が生じることがあります。
当社の運用戦略では時価資産残高に対し、一定の金額までを区切りとして最高1.265%(消費税10%込み)の逓減的報酬料率を適用いたします。また、運用報酬の他に、組入有価証券の売買委託手数料等の費用も発生しますが、運用内容等によって変動しますので、事前に上限額または合計額を表示できません。詳しくは契約締結前交付書面をご覧ください。
「T. ROWE PRICE, INVEST WITH CONFIDENCE」および大角羊のデザインは、ティー・ロウ・プライス・グループ、インクの商標または登録商標です。
ティー・ロウ・プライス・ジャパン株式会社
金融商品取引業者関東財務局長(金商)第3043号
加入協会:一般社団法人日本投資顧問業協会/一般社団法人投資信託協会
