

Lower Oil Prices Are Creating Valuation Opportunities
EXECUTIVE SUMMARY
The dramatic decline in oil prices in the second half of 2014 appears to have created both absolute and relative value opportunities in stocks that either have been excessively punished by the market for their energy-related exposure or not yet fully rewarded for the direct or indirect earnings benefits they should see from lower fuel costs. However, investors should avoid drawing overly broad or simplistic conclusions about where these opportunities are to be found. Company-specific factors must be carefully analyzed, and other macro trends—such as where an industry currently sits in the business cycle, or the appreciation of the U.S. dollar that has accompanied falling oil prices—also need to be taken into account.
OIL PRICES COULD STAY LOWER, LONGER THAN MARKETS CURRENTLY ANTICIPATE
- Although weaker demand growth in China and other markets has contributed to the collapse in oil prices, supply growth—particularly from the boom in U.S. shale oil production—has been the primary driver. We do not expect US shale production growth to decelerate quickly, despite the 54% drop in prices since last June (Figure 1).
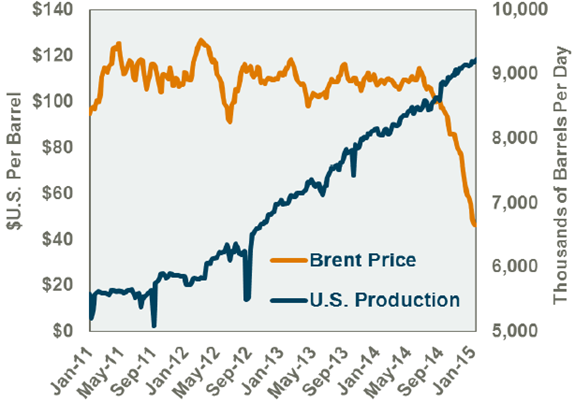
- T. Rowe Price analysts believe further short-term price declines are possible, although cash costs—the thresholds at which producers start to lose money on current production—suggest prices below $40 per barrel are probably unsustainable. That said, we would not be surprised if oil remains in the $50 to $65 range (nominal) for a number of years.
- Our relatively bearish outlook for oil prices is a product of our analysts’ relatively bullish views on price sensitivities for core U.S. shale plays, the prospects for steep declines in exploration and production costs, and projected gains in per-well productivity.
- Tier 1 U.S. shale producers—those working the best assets in the most productive areas, like Texas’s Permian Basin or North Dakota’s Bakken Formation—are in better shape to ride out a prolonged period of low prices than investors may realize. Despite widespread predictions of disaster if oil fell below $80 per barrel, our estimate is that cash operating costs for Tier 1 shales average in the $15 per barrel range while all-in breakeven costs are in the $50/bbl range and falling. The supply destruction needed for a sustained oil price recovery will not be easily achieved.
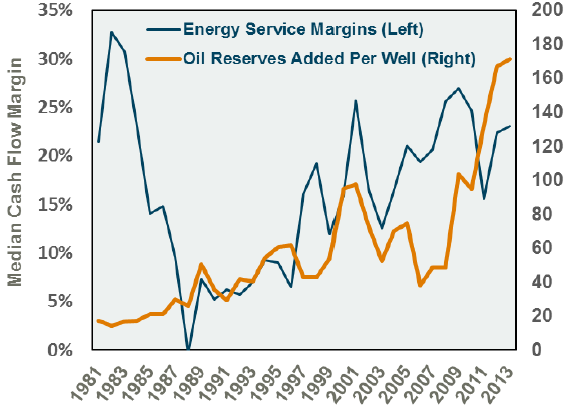
- Rapid declines in drilling costs and gains in well productivity could dramatically reduce cash costs in the years ahead. This projection is based, in part, on the oil crash of the mid-1980s, which saw prices fall more than 50% in just two years—and then remain relatively low through the 1990s (aside from short-term spikes associated with geopolitical events like the first Gulf War).
- Figure 2, shows that profit margins in the oil service industry fell below zero in the late 1980s, reflecting the extreme downward pressure on pricing in a deeply depressed market. Margins recovered only slowly thereafter—in part because productivity gains allowed producers to pump more oil, on average, out of each new well drilled, tamping down demand. We think this experience could be repeated in coming years, supporting production levels despite the decline in oil prices.
THE ENERGY SECTOR: MIDSTREAM AND DOWNSTREAM PLAYERS APPEAR LESS VULNERABLE
Steeply lower oil prices are an earnings negative for virtually all energy subsectors. However, given the price and cost dynamics described above, some companies will suffer more than others. To the extent market reaction has failed to take this into account, there may be relative value opportunities in companies that have been excessively penalized. Our views on some key subsectors:
- Exploration & Production: Nearly one-third of all Oil Service and E&P companies went out of business in the 1980s oil bust, and a similar wave can be expected this time around. That process has not yet started, but should begin this year and accelerate into 2016, as long-term price hedges roll off. However, we still see select opportunities in high-quality Tier 1 producers who can ride out the storm and pick up assets at steep discounts. But careful analysis of price sensitivity and balance sheet strength is critical in this defensive environment.
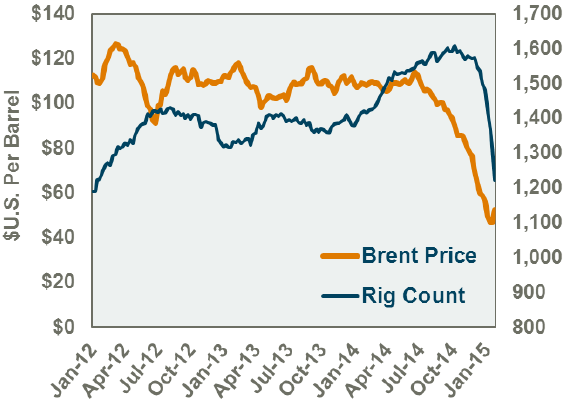
- Energy Services: Oil and gas equipment manufacturers can expect to be hit hardest as projects are deferred or cancelled. The active rig count is tracking oil prices lower (Figure 3), and could be halved by mid-2015. The negative operating leverage from simultaneous declines in utilization and pricing is likely to be brutal.
- Midstream/Downstream: There may be relative value opportunities in companies that primarily serve downstream business, such as pipelines and refineries, where capital spending should hold up better. The outlook is hardly rosy for downstream businesses. But without supply destruction, oil still has to move to market, which should lessen the hit from negative leverage. Many of these businesses are also high energy users and/or have diversified carriage (railroads), so lower fuel costs should ease the pressure on margins.
- Other Energy: Oil, gas, coal, and renewables are, to a degree, substitute goods. So downward pressure on oil prices is transferred almost immediately to those other sectors. Similarly, a collapse in oil drilling costs will also impact the natural gas cost curve and thus the ultimate clearing price for natural gas, hurting those producers. Here again, careful analysis may reveal value opportunities created by market over-reaction or under-reaction.
IMPACT ON NON-ENERGY INDUSTRIES AND COMPANIES MAY BE LESS SIMPLE THAN IT APPEARS
Lower energy prices obviously affect earnings expectations in other industries, either directly or indirectly. However, recent market valuations may reflect mistaken conclusions about the actual impact on specific companies, creating both opportunities and risks for longer-term, value-oriented investors. Some sectors where this may be the case:
- Industrials: At its peak last year, the energy sector accounted for almost 35% of U.S. non-financial capital spending, so the decline we expect in energy cap-ex would be materially significant not just for fixed investment but for U.S. GDP growth as well. But it’s unclear whether the potential impact has been accurately discounted for companies that have some exposure to the sector—heavy truck manufacturers, for example. While energy-related businesses may account for a relatively small share of revenues for these firms, energy capex may have provided a significant chunk of their earnings growth. To the extent this exposure has not been fully priced by the market, these may be stocks to avoid or at least underweight.
- Chemicals: Conventional wisdom suggests that lower oil prices equal lower feedstock costs, which should mean higher earnings for chemical companies, particularly specialty producers with some pricing power. But roughly one-third of U.S. chemical producers use natural gas as a feedstock. These firms have enjoyed a sizable cost advantage over oil-based producers—until now. It’s not yet clear whether the market has accurately assessed the impact, but we remain alert to potential bargains.
- Airlines: Airlines are expected to benefit from lower fuel costs, and our analysis suggests the earnings effect has not been fully priced in for the industry as a whole. But, here again, the story is not quite so simple. Lower fuel costs may allow some marginal players to hang on, keeping pressure on ticket prices on some routes. Airlines also may face regulatory pressure to pass lower costs on to consumers—by reducing or eliminating fuel surcharges, for example.
- Aerospace: While airlines are expected to benefit from lower fuel costs, airplane manufacturers are widely viewed as vulnerable to order cancellations, as carriers elect to keep older, less-efficient jets in service. But airlines are typically reluctant to cancel orders, out of concern that a rebound in fuel costs will force them to return at the back of the line. The fuel savings for new wide-bodied jets are also still substantial, even at current fuel prices. So the short-term impact on the major commercial aerospace firms may have been exaggerated.
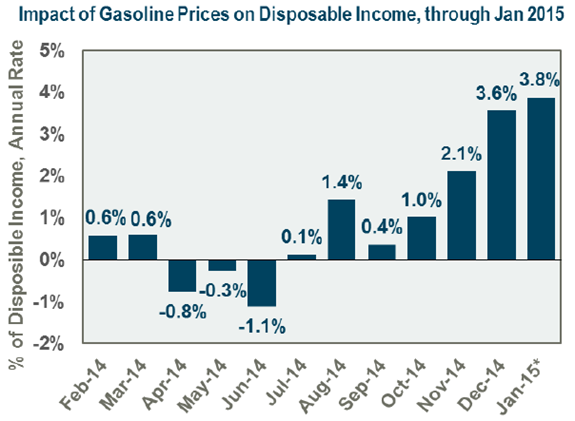
- Consumer Sectors: Lower gas prices have added disposable income to consumer’s pockets (Figure 4). For some consumer businesses (restaurants, for example) the knock-on effects on demand should be clear, even if they aren’t felt immediately. But for many bricks-and-mortar retailers, and related sectors like retail real estate investment trusts, the challenge of online shopping remains a much bigger issue.
- Autos: Lower oil prices are obviously beneficial, shortening replacement cycles while boosting demand for tires, auto parts, etc. But auto-related stocks already have had a strong run since the market trough of 2009. At this point in the economic cycle, caution seems appropriate, lower oil prices notwithstanding.
CONCLUSIONS
- While the steep drop in oil prices since mid-2014 will have widespread effects on earnings both inside and outside the energy sector, the full implications may not be fully understood or accurately reflected in stock prices. This may create opportunities for longer-term, value-oriented investors.
- Mispricing may be the product of incomplete information, or overly broad generalizations based on consensus opinion about the impact of cheaper oil on broad sectors or industries. In either case, in-depth company-by-company analysis is likely to be critical to distinguishing true winners from losers.
- Skilled stock selection, backed by a robust global research platform, experienced analysts, and an interdisciplinary process that covers both sides of the capital structure (debt as well as equity) is likely to be critical to investment success.
重要情報
当資料は、ティー・ロウ・プライス・アソシエイツ・インクおよびその関係会社が情報提供等の目的で作成したものを、ティー・ロウ・プライス・ジャパン株式会社が翻訳したものであり、特定の運用商品を勧誘するものではありません。また、金融商品取引法に基づく開示書類ではありません。当資料における見解等は資料作成時点のものであり、将来事前の連絡なしに変更されることがあります。当資料はティー・ロウ・プライスの書面による同意のない限り他に転載することはできません。
資料内に記載されている個別銘柄につき、売買を推奨するものでも、将来の価格の上昇または下落を示唆するものでもありません。また、当社ファンド等における保有・非保有および将来の組入れまたは売却を示唆・保証するものでもありません。投資一任契約は、値動きのある有価証券等(外貨建て資産には為替変動リスクもあります)を投資対象としているため、お客様の資産が当初の投資元本を割り込み損失が生じることがあります。
当社の運用戦略では時価資産残高に対し、一定の金額までを区切りとして最高1.265%(消費税10%込み)の逓減的報酬料率を適用いたします。また、運用報酬の他に、組入有価証券の売買委託手数料等の費用も発生しますが、運用内容等によって変動しますので、事前に上限額または合計額を表示できません。詳しくは契約締結前交付書面をご覧ください。
「T. ROWE PRICE, INVEST WITH CONFIDENCE」および大角羊のデザインは、ティー・ロウ・プライス・グループ、インクの商標または登録商標です。
ティー・ロウ・プライス・ジャパン株式会社
金融商品取引業者関東財務局長(金商)第3043号
加入協会:一般社団法人日本投資顧問業協会/一般社団法人投資信託協会

