

Navigating a Liquidity-Constrained Fixed Income Environment
EXECUTIVE SUMMARY
- Credit markets have seen a significant decline in liquidity in the wake of the 2008 financial crisis, as new government regulations have limited Wall Street banks’ proprietary trading activities. This has occurred alongside strong investor demand for fixed income assets and heavy corporate debt Issuance.
- As the Federal Reserve prepares to unwind unprecedented monetary accommodation, regulators have expressed concerns that if rates rise and investors aggressively sell their fixed income holdings, dealers’ constrained capacity to absorb supply has the potential to fuel financial market volatility.
- In the view of T. Rowe Price’s Fixed Income Division, liquidity conditions are unlikely to improve meaningfully anytime soon. With that in mind, this paper discusses our holistic approach to managing liquidity risk in client portfolios. Portfolio managers, traders, and analysts continually collaborate to assess liquidity conditions at both the market and security levels. Quantitative tools provide additional insights into the liquidity profiles of portfolios and prospective performance under different market scenarios.
- A shortage of liquidity could worsen market dislocations if rates rise markedly. But there are several factors that should temper the impact of increasing rates, and demand for fixed income seems unlikely to falter for long. In the current environment, global trading and fundamental research capabilities, along with a long-term investment horizon, are essential for meeting clients’ investment objectives.
Amid highly accommodative monetary policy, record corporate debt issuance, and considerable investor demand for yield, liquidity in fixed income markets may appear ample. A closer examination, however, reveals growing market strains against the backdrop of a looming increase in interest rates.
Stimulus efforts from the world’s major central banks have dramatically increased the money supply and, by extension, lifted asset prices. However, the global rally in financial assets has not necessarily translated into increased market liquidity—that is, the ease of purchasing or selling these assets when needed, with a reasonable expectation of the execution price and a minimal market impact.
Low liquidity is not a new challenge for fixed income investors. In contrast with equities, the asset class is fragmented into specialized sectors and consists of tens of thousands of different issues that appeal to a concentrated, predominantly institutional investor base. With the exception of the Treasury, agency mortgage-backed securities (MBS), and repurchase agreement (repo) markets, trading volumes for individual securities are low compared with stocks. Many bond issues are small or privately placed, and some never change hands. With most trading taking place over the counter through dealer intermediaries, pre-trade pricing transparency is limited compared with exchange-based equity markets.
REGULATORY CHANGES, CYCLICAL FORCES AT WORK
Stricter government regulations stemming from the 2008 global financial crisis have increased these challenges by limiting the ability of market makers to facilitate trades. The Dodd-Frank Act’s Volcker Rule prohibits banks from trading for their own accounts— previously an important source of offsetting market demand for traditional buy-and-hold investors. And Basel III regulations, which are being phased in, require banks to hold more capital against risk-weighted assets. In response, dealers have shed assets and scaled back trading activities due to the reduced profitability of these once lucrative businesses.
At the same time that market making has become more difficult for the sell side, the buy side has seen fixed income assets under management swell. Since the end of 2008, bond mutual funds and exchange-traded funds (ETFs) have amassed more than $1.2 trillion in inflows.1 Corporate debt products have been major beneficiaries, as exceedingly low short-term interest rates, meager Treasury yields, and a low default environment emboldened investors to increase credit risk to earn higher returns. Assets in investment-grade and high yield funds surged from $880 billion in December 2008 to about $2.1 trillion in December 2014.2
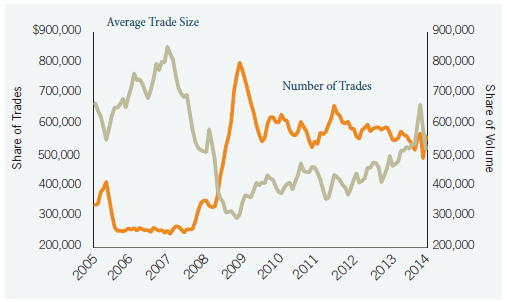
- Although trading volumes rose in the wake of the financial crisis and have held steady at these higher levels, there was a corresponding drop in the average size of trades (Figure 1). With dealers increasingly acting as agents, taking orders and connecting counterparties rather than using their balance sheets to facilitate trades, large-block transactions have become rarer
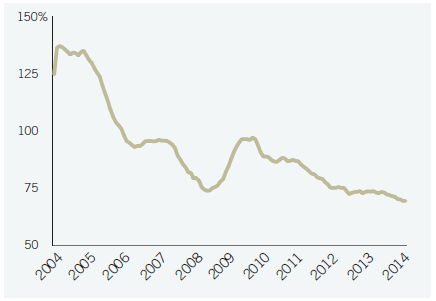
- Turnover—a measure of trading activity relative to market size—has progressively declined (Figure 2). In essence, trading volumes have not kept pace with the expanding size of corporate credit markets. Encouraged by robust investor demand and an opportunity to lock in historically low borrowing costs, corporations have issued an impressive amount of new debt in recent years. Outstanding U.S. corporate debt has grown from $4.5 trillion at the end of 2004 to close to $8 trillion at the end of 2014.3 Average monthly trading volumes have risen by much less.
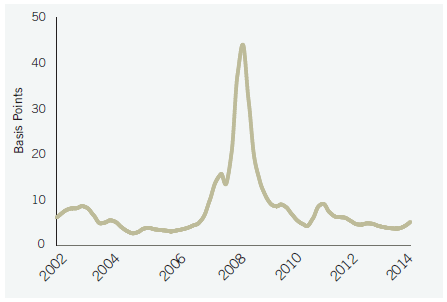
- Bid-ask spreads have narrowed in recent years but remain slightly above their pre-crisis lows despite subdued volatility. Unable to take on more risk because of higher capital costs, dealers require greater compensation to intermediate trades and supply markets with liquidity, making trading more costly for investors. This is particularly evident when risk aversion is high, as seen in late 2011 when bid-ask spreads widened as the Eurozone debt crisis escalated. (Figure 3.)
TIGHTER FED POLICY RAISES RED FLAGS
Concerns about liquidity risk have gained more market traction now that the Federal Reserve is ending its asset purchases and is expected to begin hiking the fed funds rate later this year. The worry is that rising rates and falling bond prices will trigger widespread redemptions from bond funds. The current market structure can handle low trading volume and turnover, but it could be strained by a large and sudden reversal of flows.
International regulators have voiced concerns that large outflows could lead to market instability, like that which briefly transpired in May–June 2013 when then-Fed Chairman Ben Bernanke first discussed tapering asset purchases. The subsequent spike in rate and spread volatility lasted for only a short time, however, as Fed officials reassured investors that monetary policy would remain highly accommodative for a considerable period after QE3 concluded.
In our view, bond market liquidity will remain constrained for the foreseeable future. It is unlikely that regulators will loosen rules intended to engender a more stable financial system. Encouragingly, electronic alternatives to the traditional over-the-counter trading model have developed in a number of markets, providing additional counterparties with which to trade. However, these innovations have not made up for the reduction in dealer capital devoted to trading activities.
T. Rowe Price’s Fixed Income Division is assuming that current conditions reflect the new reality, and we will be managing liquidity in our portfolios with that notion until conditions change.
COLLABORATIVE APPROACH TO LIQUIDITY MANAGEMENT
To manage liquidity risk in client portfolios, we take a holistic approach where teams of traders, analysts, and portfolio managers (PMs) collaborate closely to evaluate liquidity at both the market and security levels. To further analyse portfolio liquidity, we employ various quantitative tools to assess risk and test assumptions.
A team of 35 global fixed income trading professionals4 has a firsthand view of market conditions. Dedicated to specific sectors, they review pricing and subscription levels for new issues; analyze bid-offer spreads, volumes, and depth in the secondary market; and examine supply/demand dynamics across maturities, credit qualities, and the capital structure. Traders regularly communicate these trends to PMs and credit analysts, who factor this information into their investment decisions.
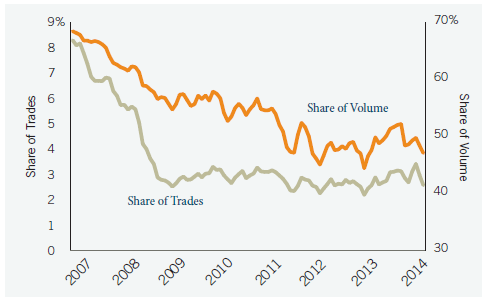
“Liquidity ebbs and flows, but the bottom line is there’s less of it than there used to be,” says Vernon Reid, an investment-grade corporate trader. “Trade sizes are lower, and the number of people you need to call is higher.” When dealers had more capital devoted to trading activities, a $25 million high-grade trade might be completed with one phone call at a tight bid-ask spread. Now, with the exception of a few widely held index names, moving large blocks requires a patient approach—a longer time line, greater selectivity, and sometimes several smaller transactions. (Figure 4.)
Figure 4: Fewer Large Trades
Block trades (those greater than $5 million) accounted for less than 3% of all trades each month at the end of 2014, down from over 8% in early 2007. Their share of total monthly volume is also down significantly.
Three-month rolling averages.
Sources: FINRA TRACE and T. Rowe Price.
At the same time, it is imperative that traders understand the level of urgency for each trade. Given the asymmetric risk/reward tradeoff in fixed income, where there is considerably more downside risk than upside potential, this is particularly critical when PMs need to exit a position quickly to avoid credit-negative events. Rapid execution may entail a wider-than-desired spread differential, but it provides downside protection for clients. Conversely, trading in smaller sizes over a longer time period may result in a lower cost to trade, but it increases exposure to market volatility. Therefore, effective trading requires finding the right balance between speed of execution and exposure to market risk.
As large Wall Street banks pared their trading operations, smaller rivals and electronic alternatives have moved in and gained market share. Our traders utilize electronic platforms to source liquidity whenever practical. A benefit of these systems is tighter bid‑ask spreads. And they are valuable for smaller trades, such as those arising from client cash flows. However, e-trading still has relatively low penetration in fixed income markets.5 Less-liquid positions are not well suited for these platforms, and institutional investors generally prefer to perform large trades over the counter to avoid moving markets.
Maintaining strong relationships with the traditional dealer community remains essential for effective trading given the greater market depth it can supply. Dealers also provide valuable market color, and by learning what bonds the sell side is seeking to acquire or offload, these relationships can lead to better execution in the secondary market. Additionally, they can create opportunities for traders to leverage our internal credit research to create needed liquidity. Bond trading is not a zero-sum game due to the varied goals of participants; sharing the fundamental relative value story for an issuer better equips intermediaries to locate counterparties who would benefit from taking the other side of a trade.
LONG-TERM PERSPECTIVE
For PMs, liquidity is a necessary consideration in the investment process for two primary reasons. First, they need to be prepared for redemptions in the event that the industry as a whole experiences a shift in investor cash flows; insufficient liquidity could force the sale of high-conviction positions at unfavourable prices. Just as important, liquidity allows managers to be opportunistic during periods when risk aversion is high but fundamentals remain sound. This valuable “dry powder” may take the form of Treasuries or a slight increase in cash at times when investor positioning begins to look crowded in certain areas.
“We are always looking for opportunities to be liquidity providers,” says Dan Shackelford, manager of the US Core Bond Strategy. “Investors struggled in 2008, but we stood ready to buy when others were forced to sell.” More recently, working with municipal analysts, his strategy took advantage of opportunities in tax-free municipal bonds when the sector faced liquidity challenges stemming from isolated credit concerns.
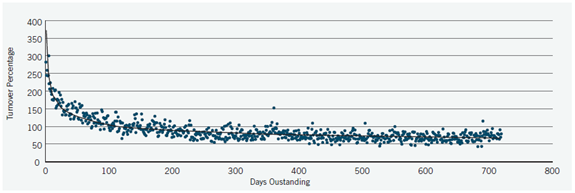
David Tiberii, who runs the US Investment Grade Corporate Bond Strategy, observes that liquidity in the high-grade sector has become concentrated in a smaller set of securities, and some of the longstanding rules have changed: “The time frame for liquidity has shortened. Bonds used to be liquid for maybe three to five years after issuance. Now they lose liquidity within a year or two,” he says (Figure 5.), “$500 million deals used to have decent liquidity; now it’s $1 billion or more.”
Figure 5: Liquidity Declines With Age
Annualized turnover by days outstanding in 2014.
Sources: FINRA TRACE and T. Rowe Price.
Given these trends, the primary market is a valuable source of bonds. New issues are considerably more liquid than older-vintage bonds and usually come with price concessions. In addition, transacting in the primary market allows larger mandates to build positions in the sizes they need without accruing high transaction costs.
That said, the secondary market still offers attractive opportunities. Liquidity risk is frequently mispriced, which can result in attractive spread pickup. And in corporate credit markets, companies may have been overlooked or unjustly punished by unfavourable market technicals. “We are generally a buy-and-hold strategy,” says Tiberii. “We’ll buy less-liquid securities when we have high conviction in a credit, and it offers good relative value.”
“The lower the liquidity, the more discerning we need to be,” adds High Yield Credit Analyst Jason Bauer. In this environment, he says that the burden of proof for holding a large position is higher. “We have to think harder about the thesis underpinning investments. This requires an increasingly long-term perspective. If a bond is a material position in a portfolio, we must be very comfortable owning it.”
BALANCING LIQUIDITY AND YIELD
Highly liquid securities are not without risks. Because the largest, most widely held corporate bonds are easier to trade, asset managers may elect to sell them first during periods of market volatility. Bonds commonly held by ETFs are more susceptible to volatile retail flows. And paying a premium for liquidity can reduce excess returns over the life of a bond. Therefore, PMs must carefully weigh the costs and benefits of increasing portfolio liquidity.
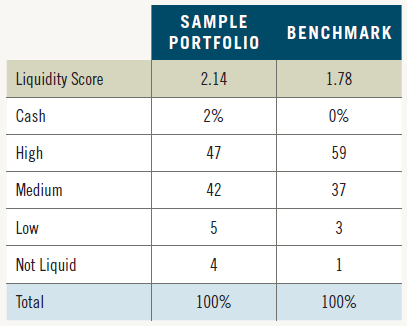
To perform this cost-benefit analysis, PMs use qualitative judgment derived from experience as well as quantitative tools. They have ready access to models that show how long it would take to raise cash in a given portfolio, how overall liquidity compares with a benchmark or another portfolio, and how different market scenarios might affect performance. (See shaded section on page 8 for more information.)
PMs also have daily conversations with traders to assess whether quoted prices reflect reality and with credit analysts to gauge their level of conviction. This is especially important in volatile markets. “It helps portfolio managers when analysts strongly advocate adding to positions when names we like are trading down. As long as fundamentals remain intact, we can’t be afraid of market technicals,” says Bauer. “We have to look through the noise and pick winners that will outperform over time. During periods of weakness, I’ll take a shopping list to the PMs.”
Diversified fixed income mandates (e.g., core, core plus, and global multi-sector strategies) typically maintain allocations to more liquid sectors, such as Treasuries and agency MBS. As demonstrated by quantitative analysis, this can help offset the risks of holding higher-yielding— but less-liquid—credit positions. It also enables PMs to take advantage of market dislocations.
If a particular sector begins to look overbought and at risk of investor outflows, multi-sector managers can adjust portfolio exposures or work with sector specialists to raise liquidity within that sector. “We want to be prepared for outflows due to fear in the bond markets. However, holding cash and Treasuries is expensive; it means losing yield,” says Shackelford. “We are managing consistently, monitoring areas of the market where there could be illiquidity. Investors are not going to head for the exits in every sector at the same time, and illiquidity may not occur in the places where it has in the past.”
Indeed, markets have very different liquidity characteristics when viewed from a global perspective. “When we think of cross-market relative value, we spend time thinking about the associated liquidity,” says Arif Husain, head of International Fixed Income. “For example, many issuers issue bonds in several currencies, and there are often discrepancies in their pricing. By taking a global approach, we can maximize value relative to the liquidity of a particular issue.” Furthermore, he notes that there are some markets where liquidity remains ample; many major foreign exchange pairs retain substantial liquidity, even in large size.
DEMAND MAY NOT WAVER FOR LONG
As Fed tightening approaches, the dearth of liquidity in credit markets may exacerbate market turbulence. Still, the situation may not be as dire as some prognosticators have suggested. Although rates appear set to rise, several factors may cause them to increase at only a measured pace:
- Careful removal of accommodative monetary policy. The Fed is on track to begin tightening policy toward the middle of 2015. But officials have reiterated that they expect economic conditions to warrant keeping the fed funds rate at below-normal levels even after employment and inflation reach their targets.
- Subdued global growth. The U.S. economy has accelerated following its weather-related contraction in the first quarter of 2014, but growth in many other major economies remains soft. The euro-area economy is barely growing, and a consumption tax hike has disrupted Japan’s recovery. Emerging markets have differentiated growth trajectories, but overall projections have been marked down due to spillover effects from the developed world and geopolitical strife.
- Relative value. For investors in need of highly rated sovereign debt, U.S. Treasuries look appealing on a relative basis. At the end of January 2015, a 10-year Treasury note out-yielded comparable German bunds and Japanese government bonds by 137 and 140 basis points, respectively.6 Europe and Japan will remain highly accommodative for the foreseeable future, even as the Fed prepares to tighten, supporting a continued relative value trade over the intermediate term.
- Presence of noneconomic buyers. The regulations that have caused banks to reduce bond inventories have also forced them to fortify their balance sheets by buying Treasury debt. And global central banks are likely to remain large buyers of Treasuries for the foreseeable future given a scarcity of higher-yielding alternatives in the high-grade sovereign space.
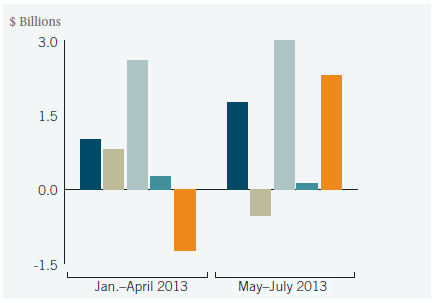
- Liability-driven investors. As pension plans approach fully funded status, their sponsors are increasingly buying long-dated, high-quality fixed income securities to lock in equity gains and better match plan assets with liabilities. Higher rates can expedite this reallocation decision. When longer-term Treasury yields rose sharply in mid-2013, there was a noticeable bid at the long end of the curve from pension funds and insurers, helping stabilize volatile bond markets. (Figure 6.)
- Secular demographic trends. The significant growth in fixed income assets in recent years is a reflection of an aging population and associated portfolio rebalancing. Like pension plans, baby boomers are de-risking, reallocating portfolios from equities to bonds. Although there may be retail outflows following periods of negative fixed income returns, they are unlikely to be sustained.
T. ROWE PRICE WELL POSITIONED
Even if there are market dislocations in a rising rate environment, we see reasons to be cautiously optimistic:
- Bond markets have always been inefficient due to their fragmented nature and price discovery challenges. A less-liquid market exacerbates these inefficiencies, creating opportunities for active investors with strong fundamental research capabilities. Our 52 credit analysts7 cover over 2,600 issuers across every major sector of the global markets.
- Credit analysis is all the more critical in the current environment. Less-liquid bonds can present attractive opportunities when an issuer is fundamentally sound and investors are adequately compensated with additional spread. Strong credit research reduces the risk of being forced to sell bonds due to a downgrade at times when market conditions are poor. And if our analysis suggests that the market has mispriced an issuer’s default risk, we can hold bonds until maturity.
- We generally have a long-term investment bias, thereby reducing turnover and the higher transaction costs experienced in illiquid markets.
- The scale of our fixed income complex enables us to be more nimble than larger competitors who may be challenged to build and exit positions of size when market depth is shallow. As of December 31, 2014, T. Rowe Price had $166.9 billion in global fixed income assets under management.
- The globalization of fixed income markets has led to overlap between sectors that were once siloed. For example, the global high yield universe was dominated by U.S. corporate names 10 years ago. Today it consists of a more diverse mix of U.S., European, and emerging markets issuers. As markets become more interwoven, the buyer base for formerly esoteric areas of the market has expanded, providing new sources of liquidity for firms possessing global trading and research platforms.
QUANTITATIVE TOOLS PROVIDE INSIGHTS
To address the structural changes in fixed income markets and the potential for increased volatility as the Fed normalizes monetary policy, the U.S. Securities and Exchange Commission issued guidance for fund advisors earlier this year. The SEC urged advisors to assess portfolio liquidity under both normal and stressed market conditions, perform more general stress testing and scenario analysis, and evaluate risk management practices based on their findings.
Prior to the SEC’s guidance, T. Rowe Price had taken steps to more thoroughly assess liquidity risk in fixed income portfolios. Specifically, the firm’s Enterprise Risk Group and quantitative fixed income team have developed tools to measure how well a portfolio could weather significantly diminished market liquidity, large redemptions, and other adverse scenarios. These tools include:
- Credit Quality: Using T. Rowe Price’s proprietary rating scale, liquidity progressively deteriorates as credit quality declines; defaulted securities are deemed illiquid.
- Sector: Sovereigns possess more liquidity than corporate debt, which in turn is slightly more liquid than most other sectors.
- Country Type: Developed market bonds are more liquid than their emerging market counterparts, while frontier markets have more considerable liquidity challenges.
- Currency Denomination: G8 currencies are the most liquid, followed by unrestricted non-majors. Bonds from countries with currency controls are the least liquid.
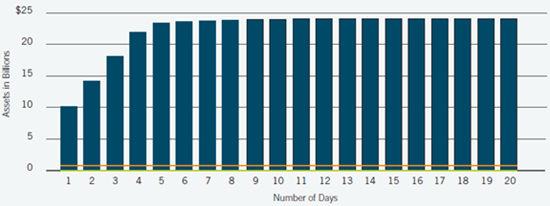
Figure 7: Amount Liquidated Over Time
1 - Source: Investment Company Institute.
2 - Source: Investment Company Institute.
3 - Source: SIFMA
4 - Includes 24 traders and 11 trading assistants and trading analysts. As of December 31, 2014.
5 - According to an August 2013 paper by McKinsey & Company and Greenwich Associates, “Corporate Bond E-Trading: Same Game, New Playing Field,” electronic trading accounted for 15% to 20% of investment-grade cash bond volume and just 10% of high yield cash bond volume.
6 - Source: Barclays.
7 - Consists of 46 credit analysts and six portfolio manager/analysts. As of December 31, 2014.
8 - MSCI provides data for corporates and sovereigns on a daily basis. For other sectors, T. Rowe Price estimates a liquidity score.
2015-GL-1444
重要情報
当資料は、ティー・ロウ・プライス・アソシエイツ・インクおよびその関係会社が情報提供等の目的で作成したものを、ティー・ロウ・プライス・ジャパン株式会社が翻訳したものであり、特定の運用商品を勧誘するものではありません。また、金融商品取引法に基づく開示書類ではありません。当資料における見解等は資料作成時点のものであり、将来事前の連絡なしに変更されることがあります。当資料はティー・ロウ・プライスの書面による同意のない限り他に転載することはできません。
資料内に記載されている個別銘柄につき、売買を推奨するものでも、将来の価格の上昇または下落を示唆するものでもありません。また、当社ファンド等における保有・非保有および将来の組入れまたは売却を示唆・保証するものでもありません。投資一任契約は、値動きのある有価証券等(外貨建て資産には為替変動リスクもあります)を投資対象としているため、お客様の資産が当初の投資元本を割り込み損失が生じることがあります。
当社の運用戦略では時価資産残高に対し、一定の金額までを区切りとして最高1.265%(消費税10%込み)の逓減的報酬料率を適用いたします。また、運用報酬の他に、組入有価証券の売買委託手数料等の費用も発生しますが、運用内容等によって変動しますので、事前に上限額または合計額を表示できません。詳しくは契約締結前交付書面をご覧ください。
「T. ROWE PRICE, INVEST WITH CONFIDENCE」および大角羊のデザインは、ティー・ロウ・プライス・グループ、インクの商標または登録商標です。
ティー・ロウ・プライス・ジャパン株式会社
金融商品取引業者関東財務局長(金商)第3043号
加入協会:一般社団法人日本投資顧問業協会/一般社団法人投資信託協会
