June 2023 / MIDYEAR MARKET OUTLOOK
2023 Midyear Market Outlook: Finding the Signal Through the Noise

INTRODUCTION
Reluctantly Bearish
Moving into the second half of 2023, the balance of economic forces still appears tilted against global capital markets. Sticky inflation, central bank tightening, and financial instability all pose clear risks.
Yet, through late May, economies and markets both showed surprising resilience. Growth remained positive in the major economies (Figure 1), and earnings results came in stronger than expected. Key equity markets posted gains.
These results appeared to validate the wisdom of a “reluctantly bearish” approach. Bearish, because the risks are substantial. Reluctant, because excessive pessimism can lead investors to overlook opportunities and miss market recoveries.
It’s an open question whether economies and markets can continue to defy the pessimists in the second half, says Sébastien Page, head of Global Multi‑Asset and chief investment officer (CIO).
Many economic indicators, Page notes, are flashing red. But lingering distortions from the COVID pandemic make it hard to distinguish the signal from the noise—the useful information from the meaningless data points.
The strongest bear argument, Page says, is that the economic impact of 500 basis points (bps) of interest rate hikes by the U.S. Federal Reserve has yet to be fully felt. “Every time the Fed has slammed on the brakes in the past, someone’s head has gone through the windshield,” he warns. “And we’ve already found out that some banks weren’t wearing their seat belts this time.”
Although the banking crisis appears contained, its impact on credit conditions will be felt with a lag, notes Arif Husain, head of International Fixed Income and CIO. Resolution of the political dispute over the U.S. debt ceiling also could squeeze market liquidity in the second half, he says, as the U.S. Treasury rebuilds its depleted cash account at the Fed.
Yet, opportunities can be found in select sectors, including small‑cap stocks and high yield bonds. Cheaper valuations and a weaker U.S. dollar also could make global ex‑U.S. equity markets attractive, says Justin Thomson, head of International Equity and CIO. Positive yield curves could do the same for global ex‑U.S. bond markets, Husain adds.
In an uncertain environment, careful security selection will be critical. “Skilled active management can help investors avoid riskier exposures,” Page argues.
Growth Has Slowed but Major Economies Are Not in Recession—Yet
(Fig. 1) Growth in real gross domestic product (GDP), year over year
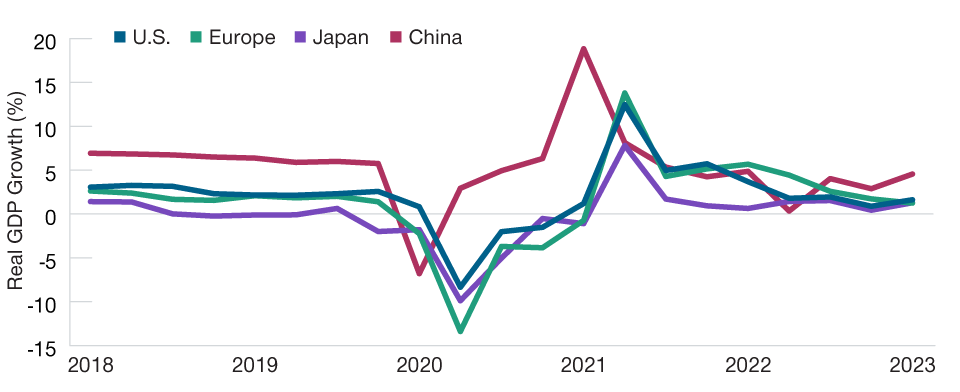
As of March 31, 2023.
Sources: Haver Analytics/U.S. Bureau of Economic Analysis, Statistical Office of the European Communities, Cabinet Office of Japan, Japan Ministry of Internal Affairs and Communications, International Monetary Fund.
Explore our three themes:
1. Economic Resilience Tested
The global economy avoided recession in the first half of 2023. The second half will bring further tests as the impacts of higher interest rates and tighter liquidity are fully felt.
2. Bonds Are Back?
An inverted yield curve means investors may want to think twice before aggressively jumping into longer‑term U.S. bonds. Credit sectors and global ex‑U.S. markets offer return potential.
3. A Focus on Earnings
Earnings growth estimates have come down but may need to fall even more in the second half. Still, there are opportunities in U.S. small‑cap stocks, mega‑cap technology, and global ex‑U.S. markets.
Summary
Entering 2023, T. Rowe Price investment leaders argued that fears of a deep global economic downturn were exaggerated. Pessimism, they suggested, could create contrarian opportunities. As of late May, both propositions appeared correct:
- Recessions in the U.S. and Europe, widely predicted at the start of the year, had yet to materialize.
- Major equity markets in the U.S., the eurozone, and Japan showed positive year‑to‑date returns.
- Default rates remained low, supporting attractive returns on high yield bonds.
“So far this year, the good news has roughly outweighed the bad news,” Husain says.
The market consensus still seems to foresee a global recession starting later this year or early 2024, but now expects it to be mild, Thomson says. However, “I think markets also understand that the biggest tail risk is a credit crunch leading to a much deeper recession.”
A list of economic and financial paradoxes has made it hard to estimate that risk, Husain notes. Resolution of the U.S. debt ceiling dispute avoided one potential crisis but could tighten liquidity in the second half. Low unemployment helps support consumer demand, which is positive for earnings, but is potentially negative for inflation and interest rates. Reflation in Japan is good news but could lead the BoJ to decontrol yields, which would be bad news for other global markets.
Given these uncertainties, and the low “signal‑to‑noise ratio” in the data, it’s no surprise that interest rate volatility has remained high (Figure 8). It’s likely to remain that way, Husain says.
From an asset allocation perspective, however, investors should remember the longer‑term historical record, Page says. “U.S. stocks have outperformed U.S. bonds 67% of the time, on a rolling 12‑month basis, by an average of seven percentage points5,” he notes. “That’s based on over 80 years of data.”
That record is one reason Page describes himself as a “reluctant bear” on U.S. equities, despite high valuations and a poor earnings outlook. It also shapes his overall market view: “My takeaway fits in a fortune cookie,” he says. “Stay invested; stay diversified.”
Market Volatility Is Likely to Persist
(Fig. 8) Implied volatility measures
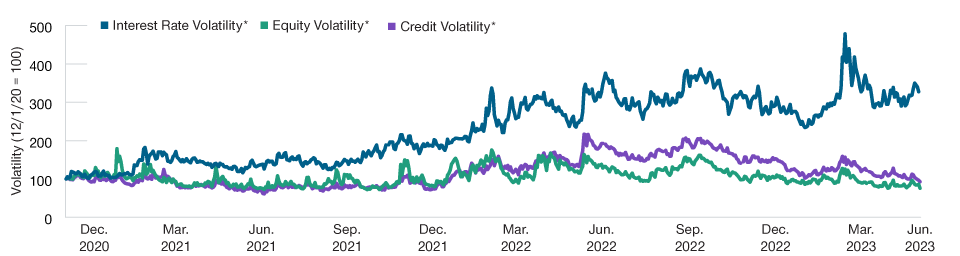
As of June 1, 2023. Past performance is not a reliable indicator of future results.
Interest rate volatility = MOVE Index, which represents implied volatility on 1‑month Treasury bill options. Equity volatility = VIX index, which represents expected volatility of the S&P 500 Index. Credit volatility = high yield 3‑month implied volatility, which represents expected future volatility of the iShares iBoxx High Yield Corporate ETF. This exchange‑traded fund is shown for illustrative purposes only to demonstrate high yield volatility.
*Values rebased to December 1, 2020.
Source: Bloomberg Finance L.P. All data analysis by T. Rowe Price.
5 Stocks based on Ibbotson® SBBI® US Large-Cap Stocks from 1926 to 1939; S&P 500 Index from 1940 to present. Bonds based on Ibbotson® SBBI®US Intermediate-term Government Bonds Index from 1926 to 1975; Bloomberg U.S. Aggregate Bond Index from 1976 to present. Rolling monthly observations January 1926 through April 2023.
Past performance is not a reliable indicator of future results.
2023 Tactical Allocation Views

*For pairwise decisions in style and market capitalization, boxes represent positioning in the first asset class relative to the second asset class. The asset classes across the equity and fixed income markets shown are represented in our multi‑asset portfolios. Certain style and market capitalization asset classes are represented as pairwise decisions as part of our tactical asset allocation framework.
This material is provided for informational purposes only and is not intended to be investment advice or a recommendation to take any particular investment action. Information and opinions, including forward‑looking statements, are derived from proprietary and nonproprietary sources deemed to be reliable but are not guaranteed as to accuracy.
Additional Disclosures
Information has been obtained from sources believed to be reliable but J.P. Morgan does not warrant its completeness or accuracy. The index is used with permission. The Index may not be copied, used, or distributed without J.P. Morgan’s prior written approval. Copyright © 2023, J.P. Morgan Chase & Co. All rights reserved.
Source: MSCI. MSCI and its affiliates and third party sources and providers (collectively, “MSCI”) makes no express or implied warranties or representations and shall have no liability whatsoever with respect to any MSCI data contained herein. The MSCI data may not be further redistributed or used as a basis for other indices or any securities or financial products. This report is not approved, reviewed, or produced by MSCI. Historical MSCI data and analysis should not be taken as an indication or guarantee of any future performance analysis, forecast or prediction. None of the MSCI data is intended to constitute investment advice or a recommendation to make (or refrain from making) any kind of investment decision and may not be relied on as such.
Copyright © 2023, S&P Global Market Intelligence (and its affiliates, as applicable). Reproduction of any information, data or material, including ratings (“Content”) in any form is prohibited except with the prior written permission of the relevant party. Such party, its affiliates and suppliers (“Content Providers”) do not guarantee the accuracy, adequacy, completeness, timeliness or availability of any Content and are not responsible for any errors or omissions (negligent or otherwise), regardless of the cause, or for the results obtained from the use of such Content. In no event shall Content Providers be liable for any damages, costs, expenses, legal fees, or losses (including lost income or lost profit and opportunity costs) in connection with any use of the Content. A reference to a particular investment or security, a rating or any observation concerning an investment that is part of the Content is not a recommendation to buy, sell or hold such investment or security, does not address the suitability of an investment or security and should not be relied on as investment advice. Credit ratings are statements of opinions and are not statements of fact.
©2023 Morningstar, Inc. All rights reserved. The information contained herein: (1) is proprietary to Morningstar and/or its content providers; (2) may not be copied or distributed; and (3) is not warranted to be accurate, complete, or timely. Neither Morningstar nor its content providers are responsible for any damages or losses arising from any use of this information. Past performance is no guarantee of future results.
ICE Data Indices, LLC (“ICE DATA”), is used with permission. ICE DATA, ITS AFFILIATES AND THEIR RESPECTIVE THIRD-PARTY SUPPLIERS DISCLAIM ANY AND ALL WARRANTIES AND REPRESENTATIONS, EXPRESS AND/OR IMPLIED, INCLUDING ANY WARRANTIES OF MERCHANTABILITY OR FITNESS FOR A PARTICULAR PURPOSE OR USE, INCLUDING THE INDICES, INDEX DATA AND ANY DATA INCLUDED IN, RELATED TO, OR DERIVED THEREFROM. NEITHER ICE DATA, ITS AFFILIATES NOR THEIR RESPECTIVE THIRD-PARTY SUPPLIERS SHALL BE SUBJECT TO ANY DAMAGES OR LIABILITY WITH RESPECT TO THE ADEQUACY, ACCURACY, TIMELINESS OR COMPLETENESS OF THE INDICES OR THE INDEX DATA OR ANY COMPONENT THEREOF, AND THE INDICES AND INDEX DATA AND ALL COMPONENTS THEREOF ARE PROVIDED ON AN “AS IS” BASIS AND YOUR USE IS AT YOUR OWN RISK. ICE DATA, ITS AFFILIATES AND THEIR RESPECTIVE THIRD-PARTY SUPPLIERS DO NOT SPONSOR, ENDORSE, OR RECOMMEND T. ROWE PRICE OR ANY OF ITS PRODUCTS OR SERVICES.
CFA® and Chartered Financial Analyst® are registered trademarks owned by CFA Institute.
T. Rowe Price cautions that economic estimates and forward-looking statements are subject to numerous assumptions, risks, and uncertainties, which change over time. Actual outcomes could differ materially from those anticipated in estimates and forward-looking statements, and future results could differ materially from historical performance. The information presented herein is shown for illustrative, informational purposes only. Forecasts are based on subjective estimates about market environments that may never occur. The historical data used as a basis for this analysis are based on information gathered by T. Rowe Price and from third-party sources and have not been independently verified. Forward-looking statements speak only as of the date they are made, and T. Rowe Price assumes no duty to and does not undertake to update forward-looking statements.
IMPORTANT INFORMATION
This material is being furnished for general informational and/or marketing purposes only. The material does not constitute or undertake to give advice of any nature, including fiduciary investment advice, nor is it intended to serve as the primary basis for an investment decision. Prospective investors are recommended to seek independent legal, financial and tax advice before making any investment decision. T. Rowe Price group of companies including T. Rowe Price Associates, Inc. and/or its affiliates receive revenue from T. Rowe Price investment products and services. Past performance is not a reliable indicator of future performance. The value of an investment and any income from it can go down as well as up. Investors may get back less than the amount invested.
The material does not constitute a distribution, an offer, an invitation, a personal or general recommendation or solicitation to sell or buy any securities in any jurisdiction or to conduct any particular investment activity. The material has not been reviewed by any regulatory authority in any jurisdiction.
Information and opinions presented have been obtained or derived from sources believed to be reliable and current; however, we cannot guarantee the sources' accuracy or completeness. There is no guarantee that any forecasts made will come to pass. The views contained herein are as of the date noted on the material and are subject to change without notice; these views may differ from those of other T. Rowe Price group companies and/or associates. Under no circumstances should the material, in whole or in part, be copied or redistributed without consent from T. Rowe Price.
The material is not intended for use by persons in jurisdictions which prohibit or restrict the distribution of the material and in certain countries the material is provided upon specific request.
It is not intended for distribution to retail investors in any jurisdiction.

Arif Husain is the head of Global Fixed Income and chief investment officer of the Fixed Income Division. He is chairman of the Fixed Income Steering Committee and a member of the firm’s Management Committee. Arif is lead portfolio manager for the Global Government Bond High Quality Strategy. He is a vice president of T. Rowe Price Group, Inc., and T. Rowe Price International Ltd.

Sebastien Page is head of Global Multi-Asset and Chair of the Asset Allocation Steering Committee, which is responsible for management and oversight of the Multi-Asset Division. Before joining our firm Mr. Page was Executive Vice President at PIMCO.

Justin Thomson is the head of International Equity and a co-head of Global Equity. Justin is a member of the Management Committee, the chairman of the International Equity Steering Committee, and a member of the Asset Allocation and Environmental, Social, and Governance Committees. He also is the chief investment officer for International Equities.