June 2023 / MIDYEAR MARKET OUTLOOK
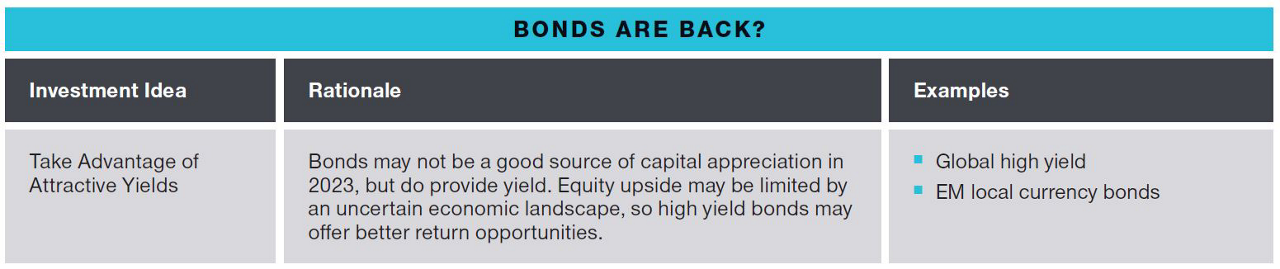
Bonds Are Back?
2023 Midyear Market Outlook - Theme two

The sharp rise in bond yields since early 2022 has improved return potential in many fixed income sectors. But an aggressive portfolio shift into longer‑term bonds still appears premature.
“Anyone who universally says that ‘bonds are back’ is being a little too optimistic,” Husain says. “Some bond markets are back. Others may be back in the near future. But I think it’s too sweeping to just say, ‘go out and buy fixed income.’”
Yields on most sovereign bonds and investment‑grade credits still aren’t positive in real (after inflation) terms, Husain notes. And with the U.S. Treasury yield curve close to a record inversion as of late May (Figure 4), investors who trade money market holdings for longer‑term bonds could pay a heavy return penalty.
Negative yield curves make it expensive to extend duration2—especially for investors using borrowed short‑term money to finance their long bond positions, Husain notes. “You end up sacrificing yield on a daily basis.”
Under these conditions, aggressively extending duration in the U.S. fixed income market amounts to a bet that a recession is near, Husain argues. “You’re saying, ‘I think the Fed will cut rates soon, and probably in a very quick way.’ I’m not sure we can say that, at least not yet.”
But Page thinks a modest increase in duration could be prudent for investors seeking to hedge against that very scenario—the sudden onset of a U.S. recession followed by rapid Fed rate cuts.
T. Rowe Price’s Asset Allocation Committee, Page notes, has modestly extended duration in its multi‑asset portfolios—both to guard against a growth shock and to potentially enhance returns if one does push yields sharply lower. “When you look at our tactical positions, we’re playing both defense and offense.”
High on High Yield
The rise in yields may have created more significant opportunities in corporate credit, Husain says. Yields in the 8%–10% range and credit spreads close to their 10‑year average (Figure 5) make the global high yield market attractive in any scenario short of a deep global recession, he argues.
Inverted Yield Curve Makes Buying Longer‑Term Bonds Expensive
(Fig. 4) Treasury yield curve (10‑year minus 3‑month constant maturity)
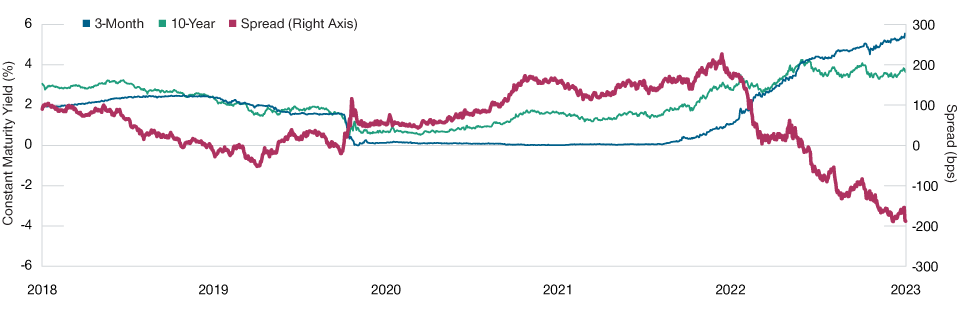
As of May 31, 2023.
Source: Federal Reserve Bank of St. Louis.
Slower economic growth and higher rates are likely to push default rates up gradually over the balance of 2023 and into 2024, Husain says. But with corporate balance sheets, on average, still featuring low leverage and ample debt service coverage, default risks appear moderate, he argues.
Based on their credit research, Page adds, T. Rowe Price analysts as of late May were forecasting a U.S. high yield default rate of about 3% over the next 12 months, roughly in line with the longer‑term historical average.
“We don’t see default rates getting anywhere close to eroding the extra yield premium, relative to investment‑grade bonds, that you can get in high yield right now,” Husain says.
Bottom‑up research and skilled security selection will be critical to managing default risk, Page cautions. “Skilled active managers know how to differentiate between healthy versus true junk balance sheets.” This, he contends, can help investors avoid “zombies”—companies that are still technically in business but almost certainly are headed toward bankruptcy.
Going Global
For investors in markets with inverted yield curves (like the U.S.), other global bond markets may offer attractive diversification and potential return opportunities, Husain says. “As I look around the world, I see some markets that actually have very steep, positive yield curves,” Husain observes. “So, investors are getting paid, in a sense, to own them.”
Some central banks, especially in the emerging markets, may be on the verge of cutting policy rates, Husain adds, creating a potential for capital appreciation in those markets. However, EM debt markets are only attractive on a very selective basis, he says.
Global investors also need to be mindful of several “black swan” risks—potentially high‑impact events with probabilities that are difficult to estimate, Husain cautions. Key among these, he says, is the possibility of a change in monetary policy by the BoJ.
Japan’s version of quantitative easing, Husain notes, includes capping yields on longer‑term Japanese government bonds. The BoJ has kept these controls in place even as the Fed and other major central banks have shifted to monetary tightening. “I would describe Japan as a last anchor of quantitative easing.”
Global Credit Sectors Offer Opportunities
(Fig. 5) Investment‑grade and high yield spreads, in basis points
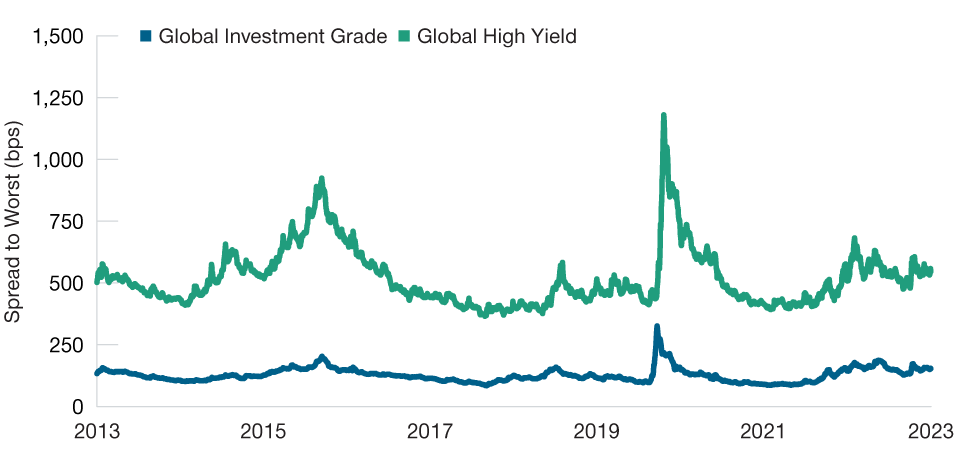
As of May 31, 2023. Past performance is not a reliable indicator of future performance.
Global high yield = J.P. Morgan Global High Yield Index. Global investment grade = Bloomberg Global Aggregate Corporate Index. Spreads versus sovereign bonds with similar duration.
Sources: J.P. Morgan Chase (see Additional Disclosures), Bloomberg Finance L.P. T. Rowe Price calculations using data from FactSet Research Systems Inc. All rights reserved.
But that anchor may be about to give way, which could have major implications for other global bond markets.
Japanese investors, Husain notes, control the world’s largest pool of financial wealth. But much of that wealth is invested outside Japan—a legacy, in part, of the years of negligible returns on Japanese bonds. However, if the BoJ allows yields to rise, Japanese investors could start bringing their wealth back home—delivering a significant shock to markets outside Japan.
“Japanese monetary policy could be the San Andreas fault of global finance,” Husain warns. “I know the BoJ is conscious of the effect it could have on global markets, but it’s a real and present danger, in my view. I certainly think it’s something that should be on our radar as investors.”
The threat of a broader systemic market event—perhaps triggered by a U.S. liquidity crunch—is another potentially dramatic but hard‑to‑quantify risk, Husain says.
Notwithstanding the recent depositor runs from several U.S. regional banks, the global banking system isn’t the most likely candidate for such an event, Husain suggests. A depressed U.S. commercial real estate sector also poses risks, but bank lending in the sector also is unlikely to be the epicenter of the next crisis, he adds.
“The playbook the authorities have for a banking crisis is pretty much set,” Husain argues. “They know how to deal with it.”
A more likely venue, Husain says, is the so‑called shadow banking system—lenders that are less regulated, less liquid, and more opaque than commercial banks. Many of these lenders, and the complex financial instruments they’ve created, have not yet endured a full economic cycle, Husain notes. “If we’re looking for potential trouble spots, I think that’s where we might find them.”
For illustrative purposes only. This is not intended to be investment advice or a recommendation to take any particular investment action.
Additional Disclosures
Information has been obtained from sources believed to be reliable but J.P. Morgan does not warrant its completeness or accuracy. The index is used with permission. The Index may not be copied, used, or distributed without J.P. Morgan’s prior written approval. Copyright © 2023, J.P. Morgan Chase & Co. All rights reserved.
Source: MSCI. MSCI and its affiliates and third party sources and providers (collectively, “MSCI”) makes no express or implied warranties or representations and shall have no liability whatsoever with respect to any MSCI data contained herein. The MSCI data may not be further redistributed or used as a basis for other indices or any securities or financial products. This report is not approved, reviewed, or produced by MSCI. Historical MSCI data and analysis should not be taken as an indication or guarantee of any future performance analysis, forecast or prediction. None of the MSCI data is intended to constitute investment advice or a recommendation to make (or refrain from making) any kind of investment decision and may not be relied on as such.
Copyright © 2023, S&P Global Market Intelligence (and its affiliates, as applicable). Reproduction of any information, data or material, including ratings (“Content”) in any form is prohibited except with the prior written permission of the relevant party. Such party, its affiliates and suppliers (“Content Providers”) do not guarantee the accuracy, adequacy, completeness, timeliness or availability of any Content and are not responsible for any errors or omissions (negligent or otherwise), regardless of the cause, or for the results obtained from the use of such Content. In no event shall Content Providers be liable for any damages, costs, expenses, legal fees, or losses (including lost income or lost profit and opportunity costs) in connection with any use of the Content. A reference to a particular investment or security, a rating or any observation concerning an investment that is part of the Content is not a recommendation to buy, sell or hold such investment or security, does not address the suitability of an investment or security and should not be relied on as investment advice. Credit ratings are statements of opinions and are not statements of fact.
©2023 Morningstar, Inc. All rights reserved. The information contained herein: (1) is proprietary to Morningstar and/or its content providers; (2) may not be copied or distributed; and (3) is not warranted to be accurate, complete, or timely. Neither Morningstar nor its content providers are responsible for any damages or losses arising from any use of this information. Past performance is no guarantee of future results.
ICE Data Indices, LLC (“ICE DATA”), is used with permission. ICE DATA, ITS AFFILIATES AND THEIR RESPECTIVE THIRD-PARTY SUPPLIERS DISCLAIM ANY AND ALL WARRANTIES AND REPRESENTATIONS, EXPRESS AND/OR IMPLIED, INCLUDING ANY WARRANTIES OF MERCHANTABILITY OR FITNESS FOR A PARTICULAR PURPOSE OR USE, INCLUDING THE INDICES, INDEX DATA AND ANY DATA INCLUDED IN, RELATED TO, OR DERIVED THEREFROM. NEITHER ICE DATA, ITS AFFILIATES NOR THEIR RESPECTIVE THIRD-PARTY SUPPLIERS SHALL BE SUBJECT TO ANY DAMAGES OR LIABILITY WITH RESPECT TO THE ADEQUACY, ACCURACY, TIMELINESS OR COMPLETENESS OF THE INDICES OR THE INDEX DATA OR ANY COMPONENT THEREOF, AND THE INDICES AND INDEX DATA AND ALL COMPONENTS THEREOF ARE PROVIDED ON AN “AS IS” BASIS AND YOUR USE IS AT YOUR OWN RISK. ICE DATA, ITS AFFILIATES AND THEIR RESPECTIVE THIRD-PARTY SUPPLIERS DO NOT SPONSOR, ENDORSE, OR RECOMMEND T. ROWE PRICE OR ANY OF ITS PRODUCTS OR SERVICES.
CFA® and Chartered Financial Analyst® are registered trademarks owned by CFA Institute.
T. Rowe Price cautions that economic estimates and forward-looking statements are subject to numerous assumptions, risks, and uncertainties, which change over time. Actual outcomes could differ materially from those anticipated in estimates and forward-looking statements, and future results could differ materially from historical performance. The information presented herein is shown for illustrative, informational purposes only. Forecasts are based on subjective estimates about market environments that may never occur. The historical data used as a basis for this analysis are based on information gathered by T. Rowe Price and from third-party sources and have not been independently verified. Forward-looking statements speak only as of the date they are made, and T. Rowe Price assumes no duty to and does not undertake to update forward-looking statements.
IMPORTANT INFORMATION
This material is being furnished for general informational and/or marketing purposes only. The material does not constitute or undertake to give advice of any nature, including fiduciary investment advice, nor is it intended to serve as the primary basis for an investment decision. Prospective investors are recommended to seek independent legal, financial and tax advice before making any investment decision. T. Rowe Price group of companies including T. Rowe Price Associates, Inc. and/or its affiliates receive revenue from T. Rowe Price investment products and services. Past performance is not a reliable indicator of future performance. The value of an investment and any income from it can go down as well as up. Investors may get back less than the amount invested.
The material does not constitute a distribution, an offer, an invitation, a personal or general recommendation or solicitation to sell or buy any securities in any jurisdiction or to conduct any particular investment activity. The material has not been reviewed by any regulatory authority in any jurisdiction.
Information and opinions presented have been obtained or derived from sources believed to be reliable and current; however, we cannot guarantee the sources' accuracy or completeness. There is no guarantee that any forecasts made will come to pass. The views contained herein are as of the date noted on the material and are subject to change without notice; these views may differ from those of other T. Rowe Price group companies and/or associates. Under no circumstances should the material, in whole or in part, be copied or redistributed without consent from T. Rowe Price.
The material is not intended for use by persons in jurisdictions which prohibit or restrict the distribution of the material and in certain countries the material is provided upon specific request.
It is not intended for distribution to retail investors in any jurisdiction.

Arif Husain is the head of Global Fixed Income and chief investment officer of the Fixed Income Division. He is chairman of the Fixed Income Steering Committee and a member of the firm’s Management Committee. Arif is lead portfolio manager for the Global Government Bond High Quality Strategy. He is a vice president of T. Rowe Price Group, Inc., and T. Rowe Price International Ltd.

Sebastien Page is head of Global Multi-Asset and Chair of the Asset Allocation Steering Committee, which is responsible for management and oversight of the Multi-Asset Division. Before joining our firm Mr. Page was Executive Vice President at PIMCO.

Justin Thomson is the head of International Equity and a co-head of Global Equity. Justin is a member of the Management Committee, the chairman of the International Equity Steering Committee, and a member of the Asset Allocation and Environmental, Social, and Governance Committees. He also is the chief investment officer for International Equities.