June 2023 / MIDYEAR MARKET OUTLOOK
A Focus on Earnings
2023 Midyear Market Outlook - Theme three

Equity returns were largely positive in the first five months of 2023. The question now is whether earnings forecasts, which stabilized in the first part of the year (Figure 6), will turn down again.
Page says he suspects they will. As of late May, he notes, 2024 earnings growth projections for the stocks in the S&P 500 Index were still in double digits. “We know that Wall Street analysts tend to wear rose‑colored glasses, but I think those expectations will have to come down.”
Assuming the global economy enters a mild recession, 2024 global earnings could be flat to down 5%, Thomson estimates.3 Compared with past earnings cycles, that could be viewed as a bullish outcome. “At this stage, I think we’re looking at a fairly benign cycle.”
Even a modest earnings decline would put further pressure on stretched U.S. large‑cap valuations. Back when the Fed was holding rates close to zero, Page recalls, a favorite Wall Street acronym was TINA—There Is No Alternative. “Well, TINA has left the building,” he says. “There are alternatives now.”
By some measures, U.S. large‑cap stocks actually appear more expensive than they did before last year’s bear market, Page says, even though the price/earnings ratio (P/E) on the S&P 500 Index has fallen.
The valuation model used to calculate the equity risk premium—the added reward for taking on the additional risk of holding stocks rather than bonds—compares the earning yield on the S&P 500 (the inverse of the P/E) with the 10‑year Treasury yield. At the beginning of 2022, Page notes, a P/E of 23 on the S&P 500 translated into an earnings yield of 4.3%, versus a 1.5% yield on the 10‑year Treasury note. That put the equity risk premium at 2.8 percentage points.
By late May of this year, the P/E on the S&P 500 had fallen to 18.4, raising the earnings yield to 5.4%. But the 10‑year Treasury yield had risen even more, to 3.7%. Net result: an equity risk premium of 1.7 percentage points—lower than before the 2022 equity sell‑off.
Earnings Growth Expectations Have Fallen but Still May Be Too High
(Fig. 6) Forward earnings per share (EPS) growth estimates, next 12 months
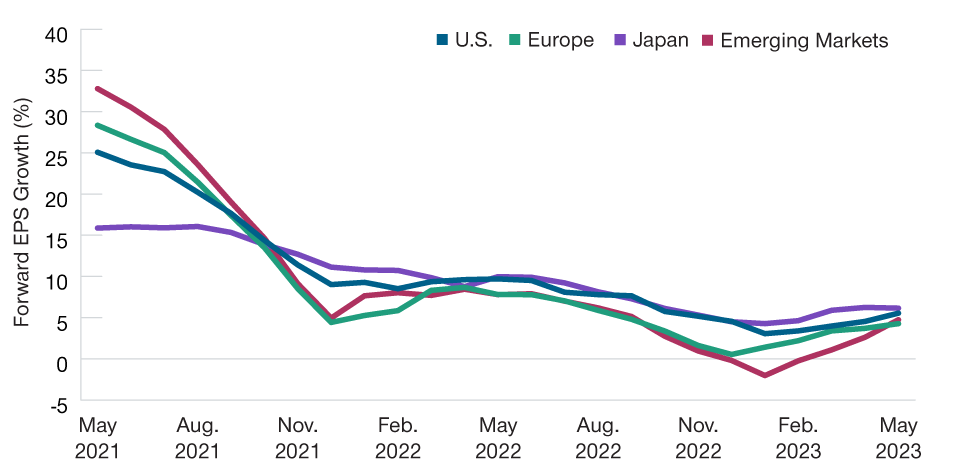
As of May 31, 2023. Actual outcomes may differ materially from estimates.
U.S. = S&P 500 Index. Europe = MSCI Europe Index. Japan = MSCI Japan Index. Emerging markets = MSCI Emerging Markets Index. Actual outcomes may differ materially from estimates.
Sources: Standard & Poor’s, MSCI (see Additional Disclosures). T. Rowe Price calculations using data from FactSet Research Systems Inc. All rights reserved.
By that same measure, Page adds, U.S. equity valuations currently are in the least attractive 5th percentile of their 10‑year historical range.4
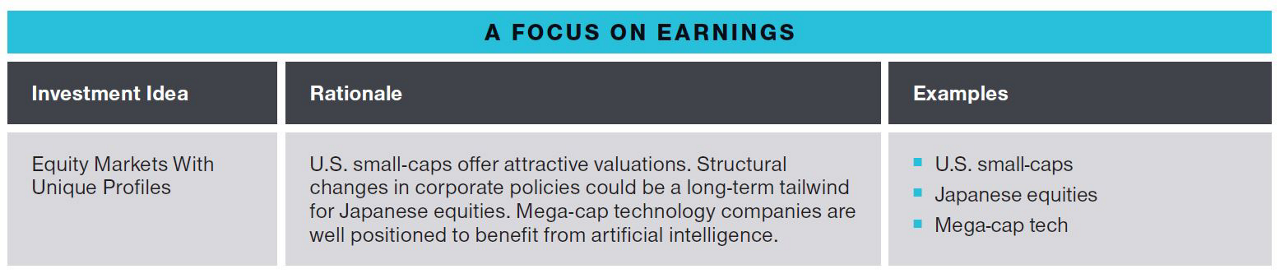
U.S. Small‑Caps Are Cheap
There are, however, bargains to be found in the U.S. market, Page adds. Many quality small‑ and mid‑cap stocks are trading at significant discounts to their historical averages. While the S&P 500’s P/E is closer to the top of its 10‑year range than to its bottom, Page notes, the reverse is true for the S&P 600 Index—a leading U.S. small‑cap benchmark. “U.S. small‑caps are priced like it’s 2008,” he says.
Of course, small‑cap valuations are low in part because many investors are worried about the risk of recession, and smaller companies historically have been more vulnerable in economic downturns. But, as with high yield bonds, skilled security selection can help active portfolio managers avoid companies with weak balance sheets and high cyclical earnings exposure, Page contends.
Potential opportunities also may be available at the opposite end of the capitalization spectrum: among the mega‑cap technology companies that were hard hit in the 2022 sell‑off, in part because of their expensive valuations.
Big tech rebounded strongly in the first half of 2023, in part driven by growing investor enthusiasm for artificial intelligence (AI) applications such as ChatGPT, the widely publicized interactive chatbot launched last November.
Thomson says he expects AI to continue to drive investment in a range of tech sectors, including semiconductors, memory, and cloud storage. AI programs also require expensive training, he notes. All this plays to the strengths of the largest tech platform companies, which have the resources to develop new AI applications and/or refine existing ones.
“There’s an AI arms race underway, and I think that means the strong will get stronger,” Thomson argues.
Equity Valuations Appear More Attractive Outside the U.S.
(Fig. 7) Forward 12-month P/E ratios in major equity regions
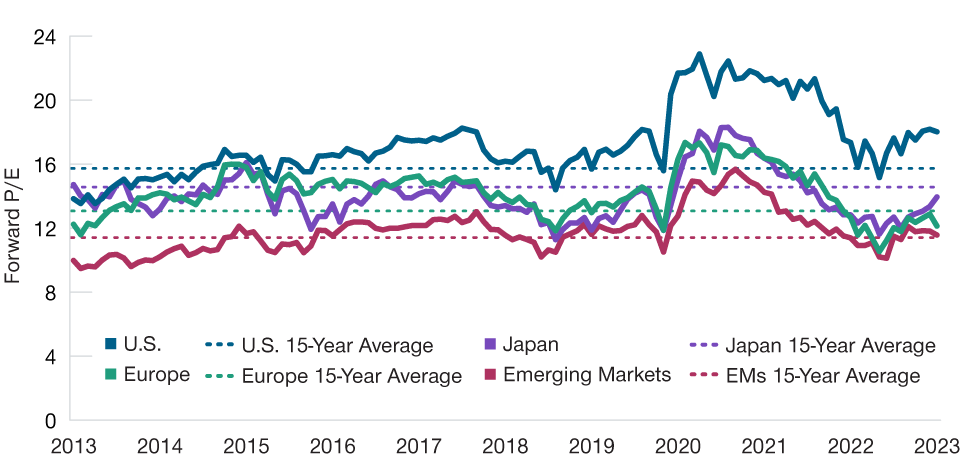
As of May 31, 2023.
U.S. = S&P 500 Index. Europe = MSCI Europe Index. Japan = MSCI Japan Index. Emerging markets = MSCI Emerging Markets Index. Actual outcomes may differ materially from estimates.
Sources: Standard & Poor’s, MSCI (see Additional Disclosures). T. Rowe Price calculations using data from FactSet Research Systems Inc. All rights reserved.
An End to U.S. Outperformance?
For global equities more broadly, a key question for the second half is whether a record‑long run of U.S. stock market outperformance will finally end.
Through the end of 2022, the S&P 500 Index had posted higher returns than the MSCI Europe, Australasia, and the Far East (EAFE) Index—a benchmark for developed markets outside the U.S. and Canada—for 53 consecutive rolling three‑year periods, measured quarterly, Thomson notes. But financial gravity could pull the U.S. market closer to earth:
- Most global ex‑U.S. markets continue to feature significantly lower valuations, relative to both U.S. equities and their own 15‑year averages (Figure 7).
- Recent earnings growth estimates have been higher for Japan, and comparable for developed Europe, relative to the S&P 500.
- A weaker U.S. dollar could enhance global return potential for unhedged U.S. dollar‑based investors.
Developed ex‑U.S. equities, as a group, already are catching up with the U.S., Thomson says. The MSCI Europe Index outperformed the global market (as measured by the MSCI All Country World Index) by a full percentage point through the first five months of 2023, he notes.
Japan’s equity market could be the standout going forward, Thomson argues. For the most recent fiscal year, which ended in March, he notes, 5% growth in Japanese corporate earnings translated into a hefty 12% rise in earnings per share, thanks to major share buybacks.
Longer‑term structural factors, such as improved corporate governance and capital allocation, also bolster the case for Japanese equities, Thomson contends, as does the potential for Japanese pension funds to reverse their 25‑year pattern of being net sellers of Japanese equities.
Thomson also says he maintains a positive view on Chinese equities despite the country’s structural economic issues. Money supply growth in China currently is outstripping real economic growth, he notes. “Under normal circumstances, that’s usually a strong backdrop for financial asset prices.”
But investors need to be mindful of the geopolitical risks—most particularly, the potential for conflict over Taiwan. “We can’t make the Taiwan tail risk go away,” Thomson says. “I think it’s probably overstated, but it’s there.”
Past performance is not a reliable indicator of future performance.
For illustrative purposes only. This is not intended to be investment advice or a recommendation to take any particular investment action.
Additional Disclosures
Information has been obtained from sources believed to be reliable but J.P. Morgan does not warrant its completeness or accuracy. The index is used with permission. The Index may not be copied, used, or distributed without J.P. Morgan’s prior written approval. Copyright © 2023, J.P. Morgan Chase & Co. All rights reserved.
Source: MSCI. MSCI and its affiliates and third party sources and providers (collectively, “MSCI”) makes no express or implied warranties or representations and shall have no liability whatsoever with respect to any MSCI data contained herein. The MSCI data may not be further redistributed or used as a basis for other indices or any securities or financial products. This report is not approved, reviewed, or produced by MSCI. Historical MSCI data and analysis should not be taken as an indication or guarantee of any future performance analysis, forecast or prediction. None of the MSCI data is intended to constitute investment advice or a recommendation to make (or refrain from making) any kind of investment decision and may not be relied on as such.
Copyright © 2023, S&P Global Market Intelligence (and its affiliates, as applicable). Reproduction of any information, data or material, including ratings (“Content”) in any form is prohibited except with the prior written permission of the relevant party. Such party, its affiliates and suppliers (“Content Providers”) do not guarantee the accuracy, adequacy, completeness, timeliness or availability of any Content and are not responsible for any errors or omissions (negligent or otherwise), regardless of the cause, or for the results obtained from the use of such Content. In no event shall Content Providers be liable for any damages, costs, expenses, legal fees, or losses (including lost income or lost profit and opportunity costs) in connection with any use of the Content. A reference to a particular investment or security, a rating or any observation concerning an investment that is part of the Content is not a recommendation to buy, sell or hold such investment or security, does not address the suitability of an investment or security and should not be relied on as investment advice. Credit ratings are statements of opinions and are not statements of fact.
©2023 Morningstar, Inc. All rights reserved. The information contained herein: (1) is proprietary to Morningstar and/or its content providers; (2) may not be copied or distributed; and (3) is not warranted to be accurate, complete, or timely. Neither Morningstar nor its content providers are responsible for any damages or losses arising from any use of this information. Past performance is no guarantee of future results.
ICE Data Indices, LLC (“ICE DATA”), is used with permission. ICE DATA, ITS AFFILIATES AND THEIR RESPECTIVE THIRD-PARTY SUPPLIERS DISCLAIM ANY AND ALL WARRANTIES AND REPRESENTATIONS, EXPRESS AND/OR IMPLIED, INCLUDING ANY WARRANTIES OF MERCHANTABILITY OR FITNESS FOR A PARTICULAR PURPOSE OR USE, INCLUDING THE INDICES, INDEX DATA AND ANY DATA INCLUDED IN, RELATED TO, OR DERIVED THEREFROM. NEITHER ICE DATA, ITS AFFILIATES NOR THEIR RESPECTIVE THIRD-PARTY SUPPLIERS SHALL BE SUBJECT TO ANY DAMAGES OR LIABILITY WITH RESPECT TO THE ADEQUACY, ACCURACY, TIMELINESS OR COMPLETENESS OF THE INDICES OR THE INDEX DATA OR ANY COMPONENT THEREOF, AND THE INDICES AND INDEX DATA AND ALL COMPONENTS THEREOF ARE PROVIDED ON AN “AS IS” BASIS AND YOUR USE IS AT YOUR OWN RISK. ICE DATA, ITS AFFILIATES AND THEIR RESPECTIVE THIRD-PARTY SUPPLIERS DO NOT SPONSOR, ENDORSE, OR RECOMMEND T. ROWE PRICE OR ANY OF ITS PRODUCTS OR SERVICES.
CFA® and Chartered Financial Analyst® are registered trademarks owned by CFA Institute.
T. Rowe Price cautions that economic estimates and forward-looking statements are subject to numerous assumptions, risks, and uncertainties, which change over time. Actual outcomes could differ materially from those anticipated in estimates and forward-looking statements, and future results could differ materially from historical performance. The information presented herein is shown for illustrative, informational purposes only. Forecasts are based on subjective estimates about market environments that may never occur. The historical data used as a basis for this analysis are based on information gathered by T. Rowe Price and from third-party sources and have not been independently verified. Forward-looking statements speak only as of the date they are made, and T. Rowe Price assumes no duty to and does not undertake to update forward-looking statements.
IMPORTANT INFORMATION
This material is being furnished for general informational and/or marketing purposes only. The material does not constitute or undertake to give advice of any nature, including fiduciary investment advice, nor is it intended to serve as the primary basis for an investment decision. Prospective investors are recommended to seek independent legal, financial and tax advice before making any investment decision. T. Rowe Price group of companies including T. Rowe Price Associates, Inc. and/or its affiliates receive revenue from T. Rowe Price investment products and services. Past performance is not a reliable indicator of future performance. The value of an investment and any income from it can go down as well as up. Investors may get back less than the amount invested.
The material does not constitute a distribution, an offer, an invitation, a personal or general recommendation or solicitation to sell or buy any securities in any jurisdiction or to conduct any particular investment activity. The material has not been reviewed by any regulatory authority in any jurisdiction.
Information and opinions presented have been obtained or derived from sources believed to be reliable and current; however, we cannot guarantee the sources' accuracy or completeness. There is no guarantee that any forecasts made will come to pass. The views contained herein are as of the date noted on the material and are subject to change without notice; these views may differ from those of other T. Rowe Price group companies and/or associates. Under no circumstances should the material, in whole or in part, be copied or redistributed without consent from T. Rowe Price.
The material is not intended for use by persons in jurisdictions which prohibit or restrict the distribution of the material and in certain countries the material is provided upon specific request.
It is not intended for distribution to retail investors in any jurisdiction.

Arif Husain is the head of Global Fixed Income and chief investment officer of the Fixed Income Division. He is chairman of the Fixed Income Steering Committee and a member of the firm’s Management Committee. Arif is lead portfolio manager for the Global Government Bond High Quality Strategy. He is a vice president of T. Rowe Price Group, Inc., and T. Rowe Price International Ltd.

Sebastien Page is head of Global Multi-Asset and Chair of the Asset Allocation Steering Committee, which is responsible for management and oversight of the Multi-Asset Division. Before joining our firm Mr. Page was Executive Vice President at PIMCO.

Justin Thomson is the head of International Equity and a co-head of Global Equity. Justin is a member of the Management Committee, the chairman of the International Equity Steering Committee, and a member of the Asset Allocation and Environmental, Social, and Governance Committees. He also is the chief investment officer for International Equities.