June 2023 / MIDYEAR MARKET OUTLOOK
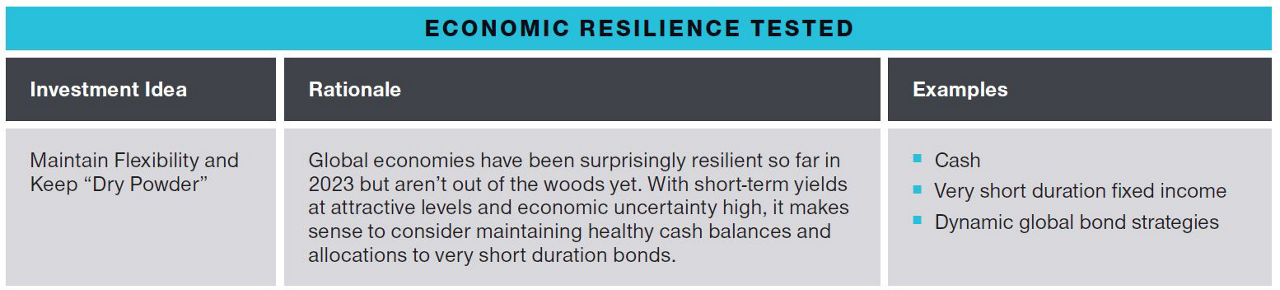
Economic Resilience Tested
2023 Midyear Market Outlook - Theme one

Economic reports in the first half of 2023 generally painted a grim picture, with many indicators posting declines similar to those seen heading into past U.S. recessions.
An inverted U.S. Treasury yield curve—with shorter‑term yields higher than longer‑term yields—is one of the warning signs that historically has signaled a downturn, Page notes. At the end of May, the yield on the three‑month Treasury bill was 188 bps higher than the yield on the 10‑year Treasury note—just below the all‑time record set earlier in the month.
But those recession warnings could be misleading, or at least incomplete, Page argues. In many cases, the sharp declines seen in such measures as purchasing managers’ indexes, consumer confidence, and the U.S. money supply have been from the inflated levels reached during the pandemic and its aftermath. “A lot of these indicators are flashing red because we’re still unwinding COVID distortions,” he says.
During the pandemic, Page notes, household savings soared as stimulus measures poured money into consumers’ bank accounts faster than they spent it. Now those balances are coming down. But they remain extremely high by historical standards, and debt service ratios are still low.
In the Fed’s most recent survey of senior bank loan officers, nearly half said they’ve tightened lending standards in the wake of the banking crisis—a level also historically associated with recessions, Page notes. But healthy consumer and corporate finances could mitigate the economic impact of tighter credit. “The most important difference now is that the balance sheets are in better shape,” he says.
Husain suspects that some financial indicators also could be sending misleading signals about the near‑term direction of central bank policy rates (Figure 2).
As of late May, Husain notes, interest rate futures markets were forecasting several Fed rate cuts before the end of 2023. He sees that as unlikely, barring a major liquidity crisis and/or an abrupt U.S. plunge into recession.
“I think the market is trying to reconcile two very different scenarios—one where the U.S. economy remains fairly strong and the Fed doesn’t cut rates, and one where things go terribly wrong and the Fed has to cut by several hundred basis points,” Husain explains. “That averages out as what’s priced into the market.”
Interest Rates May Have to Stay Higher for Longer
(Fig. 2) Central bank policy rates
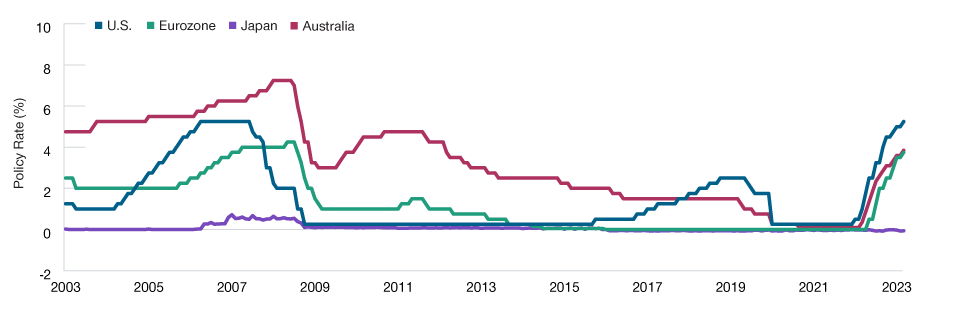
As of May 31, 2023.
U.S. = Federal Reserve fed funds upper limit. Eurozone = European Central Bank main refinancing rate. Japan = Bank of Japan overnight call rate.
Australia = Reserve Bank of Australia official cash rate.
Sources: U.S. Federal Reserve, Statistical Office of the European Communities, Cabinet Office of Japan, Reserve Bank of Australia.
Near‑term rate cuts are even more unlikely in Europe, Husain adds. In fact, he expects both the European Central Bank (ECB) and the Bank of England to raise rates several times more, despite the economic risks. “I do think the Fed and other central banks will cut rates eventually,” Husain says. “But the timing is tricky. Rates are going to remain higher for longer.”
The Bank of Japan (BoJ) remains an outlier among the key developed central banks, Husain notes, as it still is in quantitative easing mode—including its policy of capping yields on long‑term Japanese government bonds. But this could soon change, he warns.
“If the BoJ lifts its yield curve controls, it could end up being a lot more important for markets than whether the Fed hikes or cuts rates at its next meeting.”
Inflation Remains a Sticking Point
Persistent inflationary pressures remain the primary global obstacle to monetary easing, Page and Husain both say. Core inflation readings—which exclude volatile food and energy prices—remain stubbornly high (Figure 3). Service sector inflation is actually trending up, Page adds. Another energy price shock remains a risk, especially for Europe.
“U.S. inflation is probably going to get stuck at around 3%, maybe even 4%, for awhile,” Page predicts. “A 4% rate would be double the Fed’s target.”
However, a convergence of factors could choke U.S. financial liquidity in the second half, Husain suggests, perhaps leading to a shift in the Fed’s policy course.
Just as the Fed’s rate hikes have not fully worked their way through the economy, the impact of the banking crisis on credit availability also will be felt with a lag—perhaps as long as two or three quarters, Husain argues.
Meanwhile, the U.S. Treasury will need to issue an estimated USD 1.4 trillion in debt in the second half to cover deferred payments and restore cash reserves. Those reserves are held in a special account at the Fed, and cash transfers into that account must be offset elsewhere on the Fed’s balance sheet—in essence, shrinking the U.S. money supply.
Core Inflation Is Still Sticky
(Fig. 3) Consumer prices less food and energy, year‑over‑year change
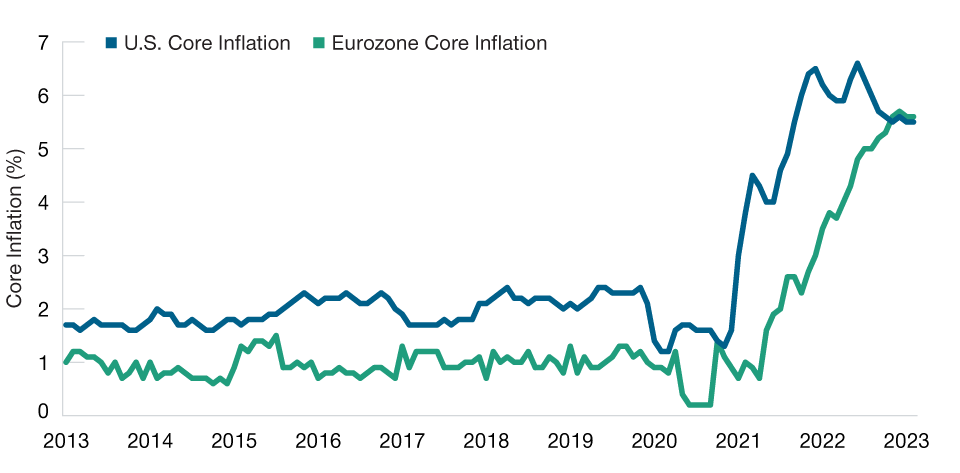
As of April 30, 2023.
Source: Bloomberg Finance L.P.
Heavy Treasury issuance, a shrinking money supply, and the lagged impact of credit tightening could deliver a triple punch to liquidity in the second half, Husain warns, potentially destabilizing markets and spilling over into the real economy.
China’s Momentum Fades While Japan Accelerates
Other major economies delivered a welcome boost to global growth in the first half, Thomson notes. Falling energy prices helped eurozone economies avoid recession, while China lifted COVID restrictions faster than expected. A weak yen helped boost Japan’s export sector.
However, much of that momentum has faded, Thomson notes. China’s economy, he says, has remained stuck in “second and third gear,” reflecting a sluggish recovery in consumer demand and oversupply in the property sector. “China needs a new growth model,” he argues.
Japan’s economic outlook, on the other hand, appears more positive. “Corporate Japan is doing rather well,” he says. “There’s been a return of pricing power.”
A Less‑Than‑Almighty U.S. Dollar
U.S. dollar strength has been a headwind for U.S. investors in global ex‑U.S. markets in recent years. But structural and cyclical factors both appear likely to curb U.S. dollar strength over the intermediate term, Thomson argues.
Cyclically, narrower interest rate differentials and tepid global economic growth should support other currencies—emerging market (EM) currencies in particular, Thomson says. “Historically, the dollar has tended to be strongest in ‘risk off’ environments and when the U.S. economy was growing very strongly,” he argues. “In a more mixed scenario, you’d expect the dollar to weaken.”
Structurally, relative valuations also favor other currencies, Thomson adds. As of the end of May, the U.S. dollar was at the 96th percentile of its 15‑year valuation range against major developed currencies,1 he notes.
For illustrative purposes only. This is not intended to be investment advice or a recommendation to take any particular investment action.
Additional Disclosures
Information has been obtained from sources believed to be reliable but J.P. Morgan does not warrant its completeness or accuracy. The index is used with permission. The Index may not be copied, used, or distributed without J.P. Morgan’s prior written approval. Copyright © 2023, J.P. Morgan Chase & Co. All rights reserved.
Source: MSCI. MSCI and its affiliates and third party sources and providers (collectively, “MSCI”) makes no express or implied warranties or representations and shall have no liability whatsoever with respect to any MSCI data contained herein. The MSCI data may not be further redistributed or used as a basis for other indices or any securities or financial products. This report is not approved, reviewed, or produced by MSCI. Historical MSCI data and analysis should not be taken as an indication or guarantee of any future performance analysis, forecast or prediction. None of the MSCI data is intended to constitute investment advice or a recommendation to make (or refrain from making) any kind of investment decision and may not be relied on as such.
Copyright © 2023, S&P Global Market Intelligence (and its affiliates, as applicable). Reproduction of any information, data or material, including ratings (“Content”) in any form is prohibited except with the prior written permission of the relevant party. Such party, its affiliates and suppliers (“Content Providers”) do not guarantee the accuracy, adequacy, completeness, timeliness or availability of any Content and are not responsible for any errors or omissions (negligent or otherwise), regardless of the cause, or for the results obtained from the use of such Content. In no event shall Content Providers be liable for any damages, costs, expenses, legal fees, or losses (including lost income or lost profit and opportunity costs) in connection with any use of the Content. A reference to a particular investment or security, a rating or any observation concerning an investment that is part of the Content is not a recommendation to buy, sell or hold such investment or security, does not address the suitability of an investment or security and should not be relied on as investment advice. Credit ratings are statements of opinions and are not statements of fact.
©2023 Morningstar, Inc. All rights reserved. The information contained herein: (1) is proprietary to Morningstar and/or its content providers; (2) may not be copied or distributed; and (3) is not warranted to be accurate, complete, or timely. Neither Morningstar nor its content providers are responsible for any damages or losses arising from any use of this information. Past performance is no guarantee of future results.
ICE Data Indices, LLC (“ICE DATA”), is used with permission. ICE DATA, ITS AFFILIATES AND THEIR RESPECTIVE THIRD-PARTY SUPPLIERS DISCLAIM ANY AND ALL WARRANTIES AND REPRESENTATIONS, EXPRESS AND/OR IMPLIED, INCLUDING ANY WARRANTIES OF MERCHANTABILITY OR FITNESS FOR A PARTICULAR PURPOSE OR USE, INCLUDING THE INDICES, INDEX DATA AND ANY DATA INCLUDED IN, RELATED TO, OR DERIVED THEREFROM. NEITHER ICE DATA, ITS AFFILIATES NOR THEIR RESPECTIVE THIRD-PARTY SUPPLIERS SHALL BE SUBJECT TO ANY DAMAGES OR LIABILITY WITH RESPECT TO THE ADEQUACY, ACCURACY, TIMELINESS OR COMPLETENESS OF THE INDICES OR THE INDEX DATA OR ANY COMPONENT THEREOF, AND THE INDICES AND INDEX DATA AND ALL COMPONENTS THEREOF ARE PROVIDED ON AN “AS IS” BASIS AND YOUR USE IS AT YOUR OWN RISK. ICE DATA, ITS AFFILIATES AND THEIR RESPECTIVE THIRD-PARTY SUPPLIERS DO NOT SPONSOR, ENDORSE, OR RECOMMEND T. ROWE PRICE OR ANY OF ITS PRODUCTS OR SERVICES.
CFA® and Chartered Financial Analyst® are registered trademarks owned by CFA Institute.
T. Rowe Price cautions that economic estimates and forward-looking statements are subject to numerous assumptions, risks, and uncertainties, which change over time. Actual outcomes could differ materially from those anticipated in estimates and forward-looking statements, and future results could differ materially from historical performance. The information presented herein is shown for illustrative, informational purposes only. Forecasts are based on subjective estimates about market environments that may never occur. The historical data used as a basis for this analysis are based on information gathered by T. Rowe Price and from third-party sources and have not been independently verified. Forward-looking statements speak only as of the date they are made, and T. Rowe Price assumes no duty to and does not undertake to update forward-looking statements.
IMPORTANT INFORMATION
This material is being furnished for general informational and/or marketing purposes only. The material does not constitute or undertake to give advice of any nature, including fiduciary investment advice, nor is it intended to serve as the primary basis for an investment decision. Prospective investors are recommended to seek independent legal, financial and tax advice before making any investment decision. T. Rowe Price group of companies including T. Rowe Price Associates, Inc. and/or its affiliates receive revenue from T. Rowe Price investment products and services. Past performance is not a reliable indicator of future performance. The value of an investment and any income from it can go down as well as up. Investors may get back less than the amount invested.
The material does not constitute a distribution, an offer, an invitation, a personal or general recommendation or solicitation to sell or buy any securities in any jurisdiction or to conduct any particular investment activity. The material has not been reviewed by any regulatory authority in any jurisdiction.
Information and opinions presented have been obtained or derived from sources believed to be reliable and current; however, we cannot guarantee the sources' accuracy or completeness. There is no guarantee that any forecasts made will come to pass. The views contained herein are as of the date noted on the material and are subject to change without notice; these views may differ from those of other T. Rowe Price group companies and/or associates. Under no circumstances should the material, in whole or in part, be copied or redistributed without consent from T. Rowe Price.
The material is not intended for use by persons in jurisdictions which prohibit or restrict the distribution of the material and in certain countries the material is provided upon specific request.
It is not intended for distribution to retail investors in any jurisdiction.
June 2023 / MIDYEAR MARKET OUTLOOK

Arif Husain is the head of Global Fixed Income and chief investment officer of the Fixed Income Division. He is chairman of the Fixed Income Steering Committee and a member of the firm’s Management Committee. Arif is lead portfolio manager for the Global Government Bond High Quality Strategy. He is a vice president of T. Rowe Price Group, Inc., and T. Rowe Price International Ltd.

Sebastien Page is head of Global Multi-Asset and Chair of the Asset Allocation Steering Committee, which is responsible for management and oversight of the Multi-Asset Division. Before joining our firm Mr. Page was Executive Vice President at PIMCO.

Justin Thomson is the head of International Equity and a co-head of Global Equity. Justin is a member of the Management Committee, the chairman of the International Equity Steering Committee, and a member of the Asset Allocation and Environmental, Social, and Governance Committees. He also is the chief investment officer for International Equities.