
Plan Health
Navigate with ease
Use the tabs across the top to navigate to different categories of data. Easily switch between plans or view an all plans aggregated view located next to the T. Rowe Price logo.

Personalized Favorites
The My Favorites category page is fully personalized by you with the ability to add, rearrange, and remove cards.
Add cards to your highlights:
- Find the card on any category page
- Click the heart button at the top right of any card
Rearrange cards:
- Click Customize in the top right of the screen
- Drag and drop each card to the desired order
Remove cards from highlights:
- Navigate to My Favorites page
- Click the heart button at the top right of any card
- Click Confirm to remove the card
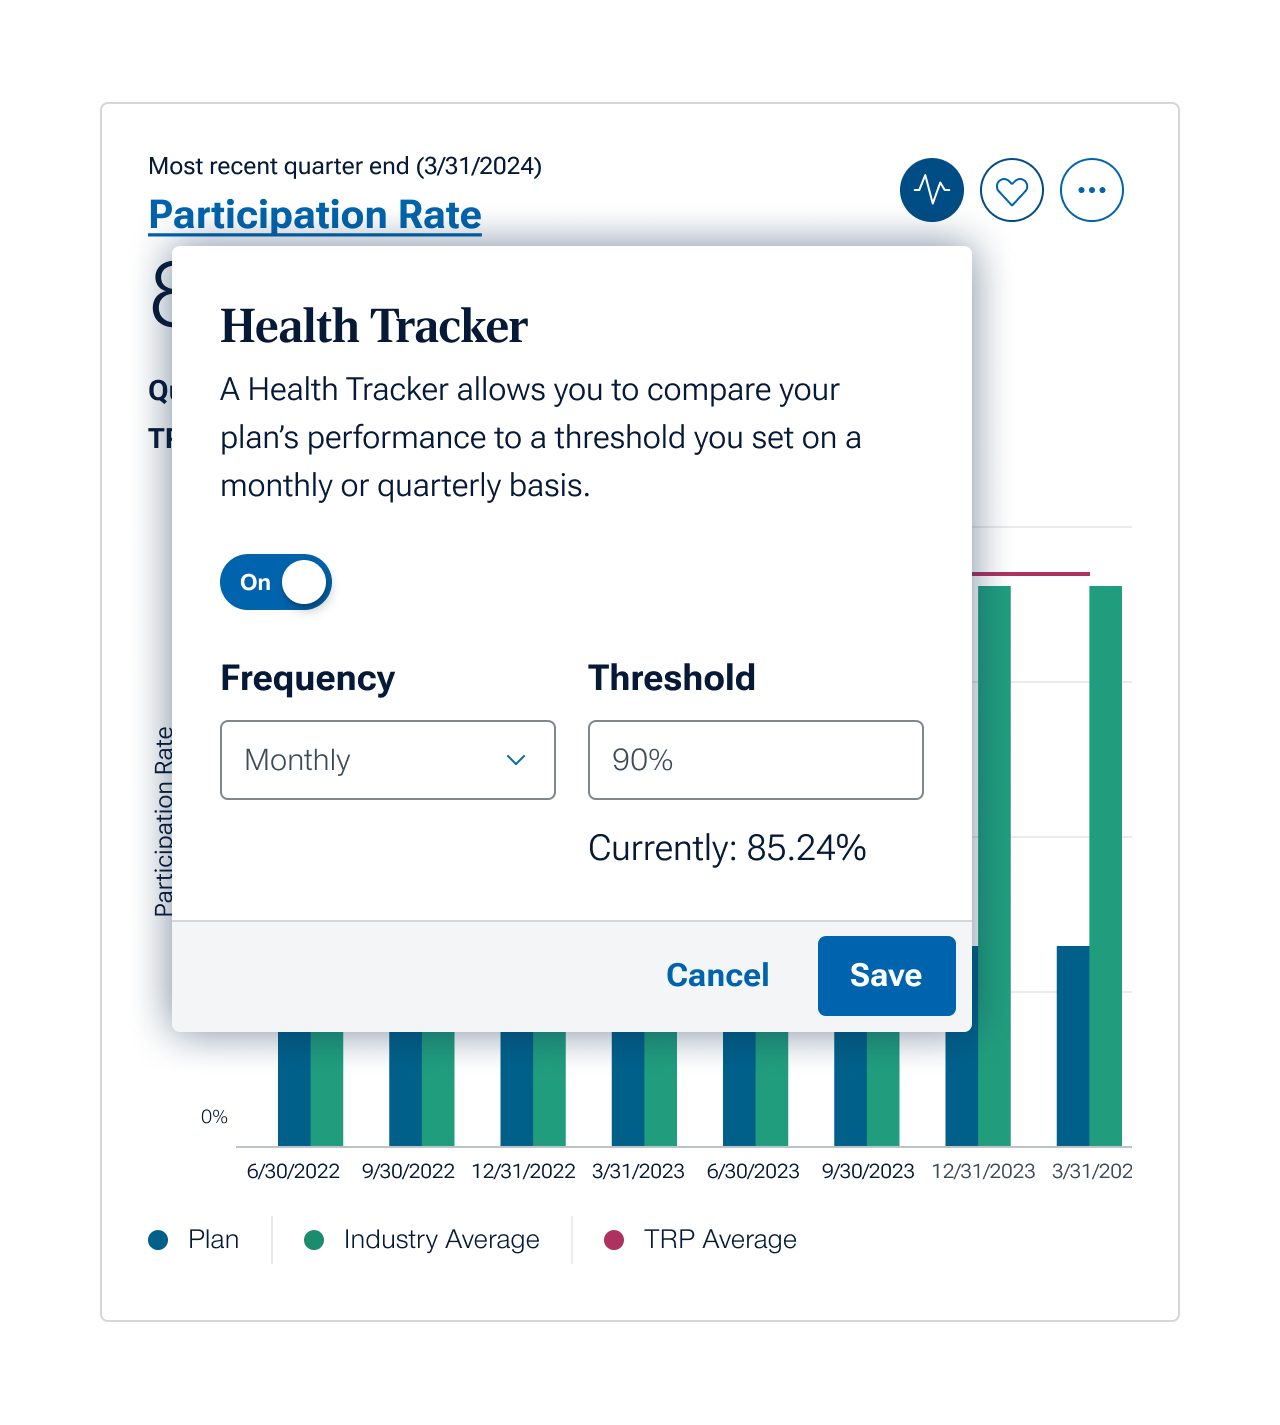
Health Tracker
Assess the strength of a given data point with our new Health Tracker. You choose a threshold for success, and we’ll track and share progress automatically.
Health Tracker is currently available for Participation Rate, Average Deferral Rate, Percentage of Participants with an Outstanding Loan and Average Confidence Number.
Set up a Health Tracker:
- Click the tracker icon ( )
- Click the on/off switch to “On”
- Select the frequency of health checks
- Select your threshold for success
- Click “Save”
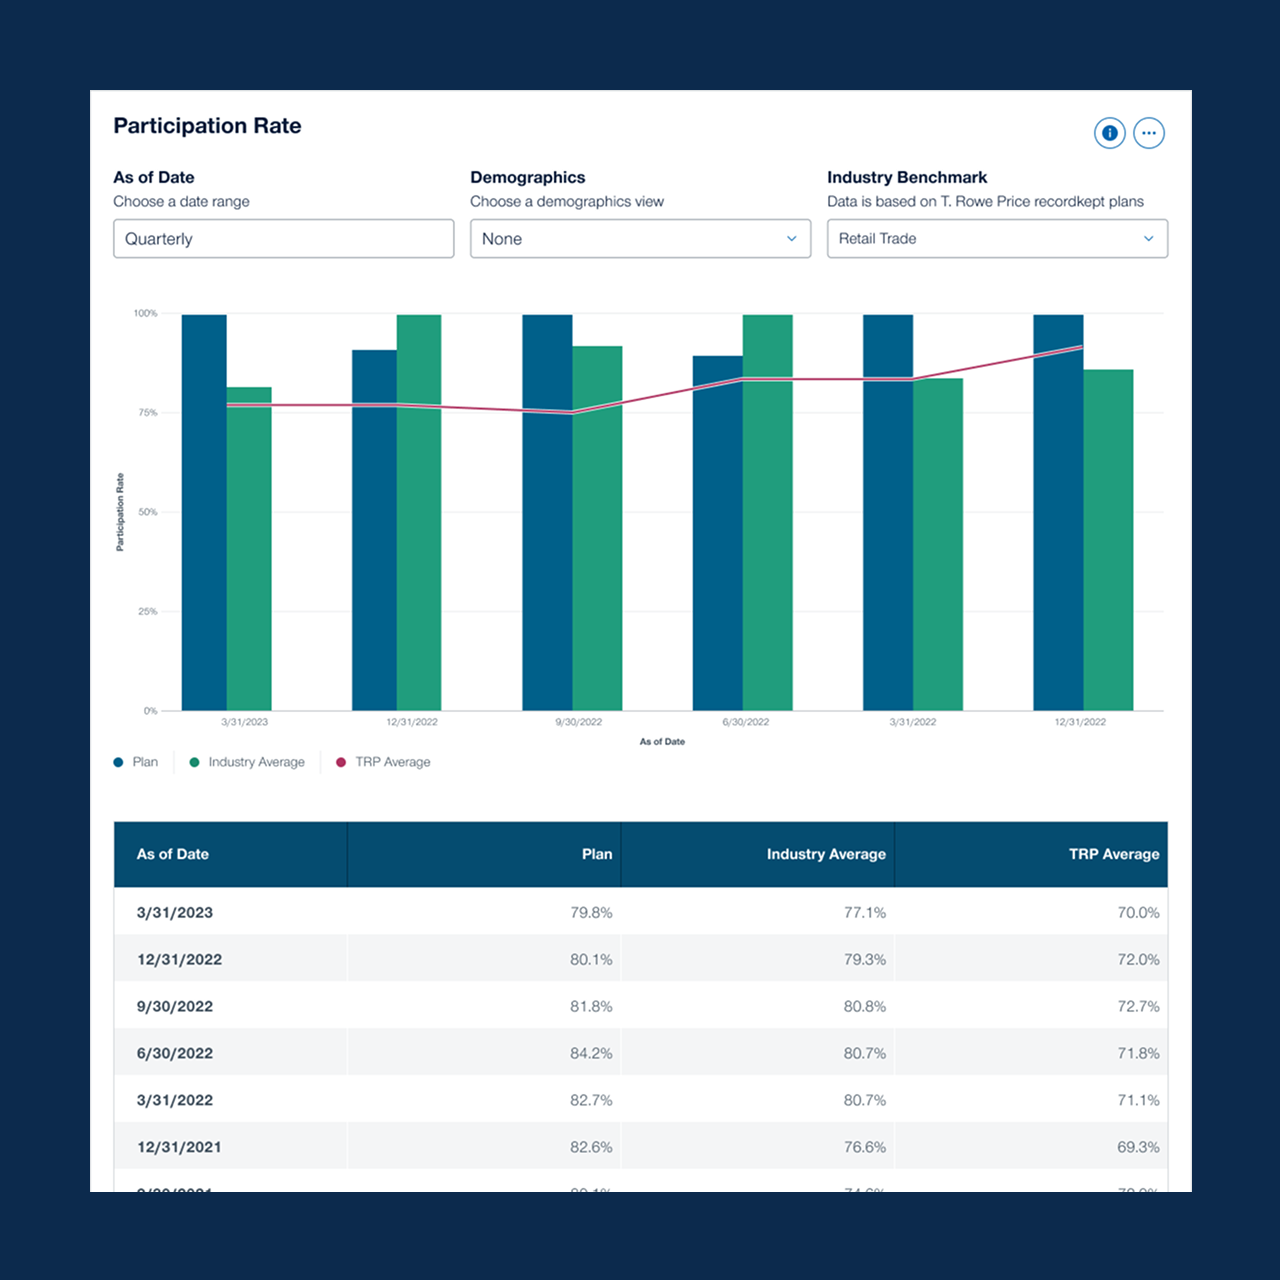
Explore every detail
You can dive deeper into metrics by analyzing for different time periods or with additional filters, such as demographics and industry benchmarks.
Learn more about any tile: Each details view allows you to explore different date ranges, filters, and data visualizations.
- Click on the title to be taken to a details view
- Choose a date range or as of date
- Choose additional filters (e.g. demographics, industry benchmark)
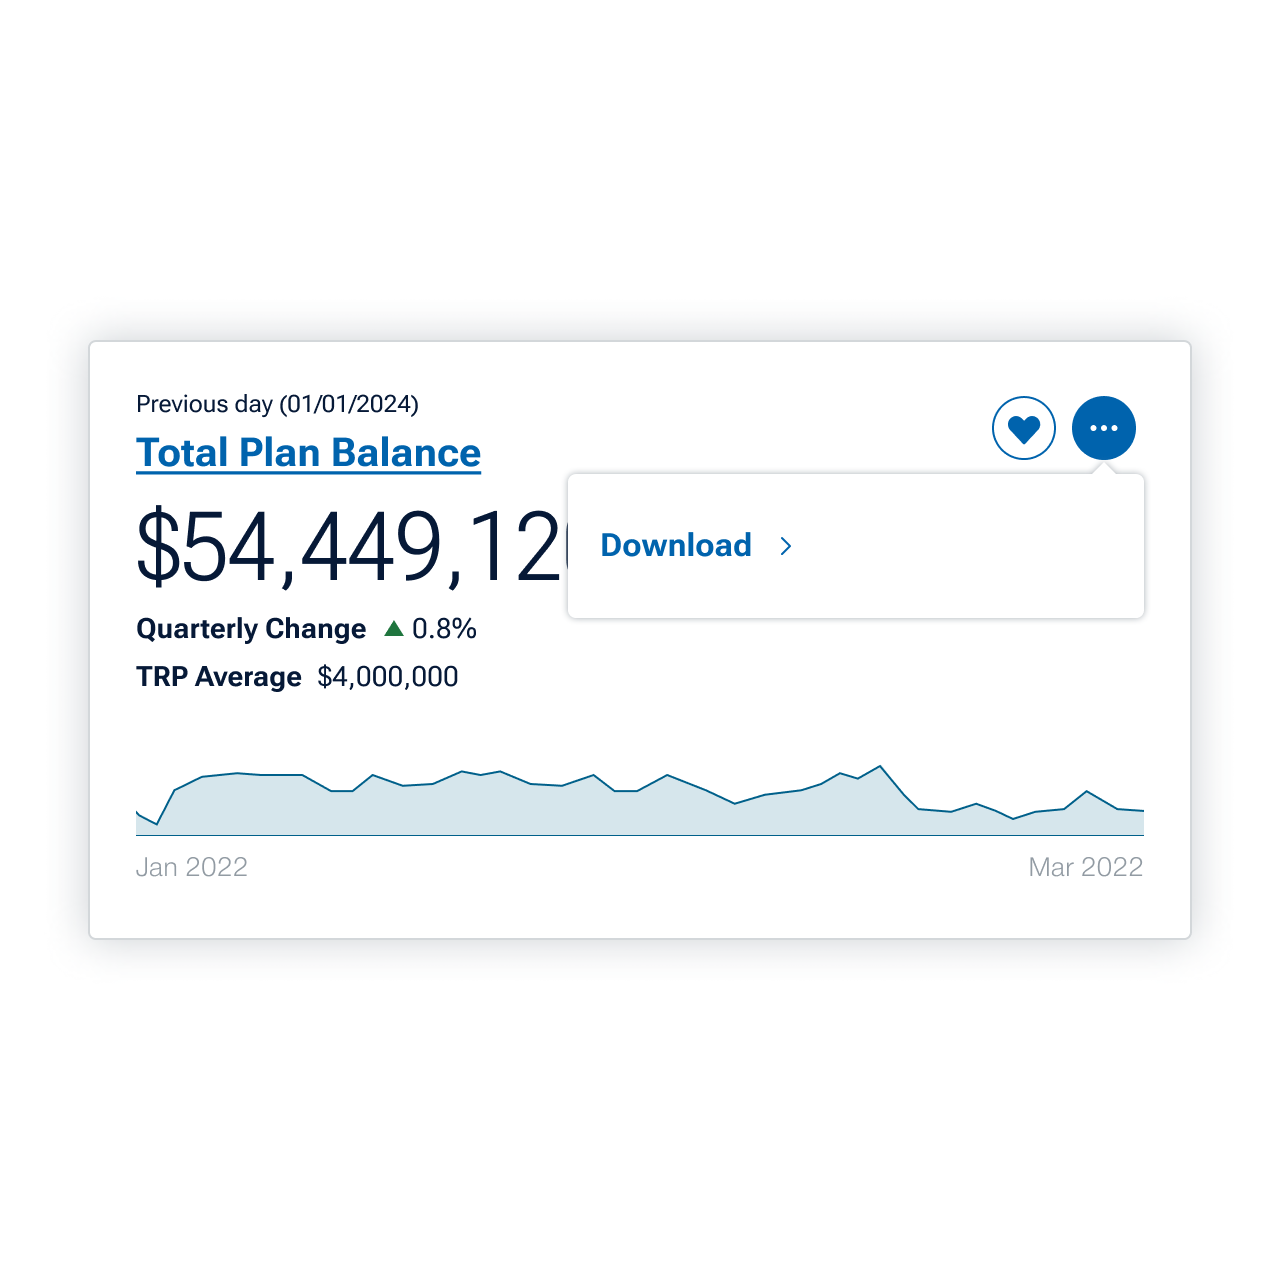
Downloading data
To download a card, click the three dots (...) button at the top right and click Download. You'll receive the data and accompanying visualization in a ready-to-present PDF.
Coming soon, you’ll have the ability to download an entire tab’s worth of data at once.

Built-in Reports
Export a Standard or Custom report directly from Plan Health.
Export a Standard report
- Click Export at the top right of the page
- Select Standard
- Choose a template or data category
- Click Preview
- Choose to download the file as a PowerPoint or PDF
Export a Custom report
- Click Export at the top right of the page
- Select Custom
- Select the data points to include in the report
- Click Preview
- Choose to download the file as a PowerPoint or PDF

Webinar: Discover Plan Metrics and Reports
When you need plan data, you need it fast. Learn how to quickly generate reports and uncover new insights in this webinar replay. You'll watch detailed tutorials on using our Plan Health and On-Demand Reporting tools.
202402-3386306
.png)