

Frontier Markets: Asia Rising
EXECUTIVE SUMMARY
Frontier Asia is increasingly becoming an important part of the frontier world, in terms of size, potentialgrowth and opportunity.
China plays an important role in the region. Encouragingly, current trends point to a favorable backdropfor Asian frontier markets as China grows and develops.
It is important to identify the best opportunity set within these markets as often index constituents donot fully represent the stocks that are central to the local growth story. Additionally, there is a strongneed to be active within these markets as there can be great dispersion, both in terms of country andsector returns.
Frontier Asia currently trades at attractive valuation levels, not only on a relative basis compared withemerging and developed markets, but also within the frontier investment universe.
Valuations may be attractive, but stock selection remains paramount. It is important to focus on qualityand stocks that will continue to deliver over the long term. However, with sufficient resources a managercan find areas of the market that can help to provide compelling risk-adjusted returns.
Within frontier markets, Asia is offering up more and more interesting opportunities. Predominately, there are four main countries that offer the size and liquidity for international investors: Sri Lanka, Vietnam, Pakistan, and Bangladesh. However, on the horizon, Cambodia, Mongolia, Myanmar and Laos are open and/or will slowly open up to investors.
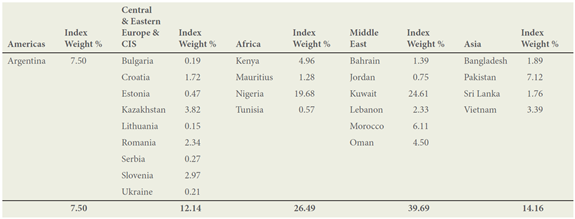
In Figure 1 (page 2), you can see how Asia has come into greater focus now that Qatar and the United Arab Emirates have moved to the MSCI Emerging Markets Index. However, the current weightings and composition of the Asian portion of the MSCI Frontier Markets Index do not appropriately represent the opportunities we are finding in these markets. This can often be the case with frontier markets; this may be for historical reasons or down to the free-float methodology MSCI employs to create its indices.
As we mentioned above, we believe that the benchmark index for the region can often be an inefficient map of the opportunity set. Some of the index constituents are companies that may be partly state-owned enterprises, which means that they are often not run for the benefit of shareholders. Meanwhile, a number of them, in our opinion, can fall down on corporate governance or liquidity standards. Additionally, as in a number of developing economies, stocks listed in the index do not always fully represent the underlying economy.
Figure 1. MSCI Frontier Markets Index:
Asia becoming an increasingly important area for frontier investors
Sources: MSCI and FactSet.
Numbers may not total 100 due to rounding.
As of August 31, 2014
Therefore, it is important to extend your search. A crucial element of any asset allocation study is the identification of the relevant opportunity set. The ability to diverge and look beyond the index can help to create added value. Searching for opportunities further down the market cap scale can also help in the pursuit of alpha. Increasing the opportunity set to include small- and mid-cap equities has many benefits. Smaller companies are often the source of new ideas that contribute to long-term GDP growth, while the sheer diversity of the companies available to investors is also very appealing. Mid-cap stocks can also offer the flexible, innovative, high-growth aspects of small-cap stocks, but with the additional benefits of proven management, established products, and greater liquidity. Generally, small- and mid-cap companies are also much better able to tap into the local growth story as they tend to have a greater domestic focus.
Of course, moving further down the market cap scale can increase risks. However, these outside index positions should, in our opinion, only ever represent a manager’s highest-conviction and most compelling investment ideas.
FINANCIALS A LARGE PART OF THE OPPORTUNITY SET
The opportunity set in Asia, as with other frontier markets, is majorly focused on the financials sector. This is primarily due to banks and financial companies predominately being the first to equitize within the marketplace. Encouragingly, financials is an area where we see a tangible difference between the emerging and developed world. Financials can, in some respects, be considered a “levered” investment linked to an underlying economy. A banking system operating within a growing economy with controlled nonperforming loans (NPLs) is likely to be a good starting point if you wish to identify growing, profitable banks—we see many such examples in the frontier world today.
The banking systems in frontier and emerging market countries have also been through a crisis in the past 20 years. Having learned from the painful experience of excess leverage and a severe bad debt cycle, lending practices have been improved in many countries, and banks, therefore, tend to operate on a more traditional basis. Most concentrate on taking deposits, making loans to consumers and to businesses, and processing transactions; this model has been supportive of profitability, if well managed
Valuations are also generally favorable. There are many banks trading at high single-digit to low double-digit levels when considering forward-looking price-to-earnings (P/E) ratios. Many frontier banks are also generating exciting, but also sustainable, return-on-equity levels. Growth of 20% annum is not uncommon, especially in Pakistan and Sri Lanka. In addition, with a macroeconomic backdrop that is becoming more positive, and a deleveraging cycle predicted to come to an end by the end of 2014, it is a great opportunity to own some exciting companies for the medium term at very attractive levels.
PUSH AND PULL WITH CHINA
China has a large effect on many frontier markets in Asia. We can probably explain this trend as being the result of two key influences—one, more of a push, and the other, more of a pull.
The push factor would be that cost inflation in China has been substantial over the past decade, and this is pushing more production and manufacturing to frontier countries. Government policies in China have led to this. We have seen minimum wage hikes in China at double-digit levels for a number of years as the government encourages wealth creation and consumption. Companies are increasingly being forced to provide better benefits, such as pensions for their workers. Meanwhile, the renminbi has also appreciated, making exports more expensive, and it has become harder and costlier to buy land.
The Chinese government is also striving for a happier, wealthier population that has a cleaner environment to live in. So, while China wishes to maintain high levels of employment and may be disappointed to lose market share to other parts of Asia, it probably accepts that this is a natural byproduct of its policies. China has been trying to offset this to some extent by moving up the value chain. So it is less interested in being the low-cost exporter of pens and t-shirts and more interested in autos, aviation, factory automation, etc.
However, it is important to recognize that what is happening has less to do with manufacturing closing down in China, and more to do with incremental investment moving elsewhere. Primarily, we have seen this in textiles/apparel and in electronics assembly. While the main manufacturing centers for companies like Luen Thai, Shenzhou International, and Pacific Textiles are still in China, they are being actively encouraged by their branded customers (Nike, Adidas, Uniqlo, Coach, etc.) to put incremental investment in Vietnam, Cambodia, and other parts of the region.
The benefits are diversification away from concentrated China risk, lower manufacturing costs (wages are approximately 50% lower in Vietnam and 75% cheaper in Cambodia), and potentially lower corporate tax rates. For some industries, governments in Southeast Asia provide tax incentives to encourage investment. Often, you will see lower export taxes to Japan, Europe, and the U.S. in many countries. In Vietnam, for example, high value‑added manufacturing industries, such as electronics and health care, pay 10% corporate tax instead of the standard 22%. Samsung Electronics recently announced plans to build a $1 billion factory in Ho Chi Minh City, taking its total investment in Vietnam to $5 billion. By 2015, Samsung expects that up to 40% of its mobile handsets will be shipped from Vietnam. Cambodia also waives corporate income tax for garment manufacturers for the first five years.
The pull factor is that many Southeast Asian nations have high rates of economic growth and large populations— large and increasingly wealthy addressable markets. Indonesia’s population is over 250 million, Thailand 70 million, Vietnam 93 million, and the Philippines over 100 million. Companies can put production closer to their customers in these new markets. The other pull factor is that companies from more mature Asian economies are seeking new growth opportunities. Companies like POSCO (a South Korean steel manufacturer) already have facilities in Indonesia and are setting up in Vietnam. Even Chinese cement and power companies are looking at opportunities outside their domestic market as demand growth at home matures.
However, there are some risks and stumbling blocks that are likely to continue to prevent a rapid withdrawal of investment from China. These include:
- Poor infrastructure (roads, rail, port, power), underdeveloped local supply chains and inefficient logistics.
- Less stable political environments.
- Rising costs—Thailand and Malaysia are already more expensive than China. Vietnam and other frontier countries will catch up. This is particularly true as these countries also move up the value chain (this has happened in Thailand and is now happening in Vietnam).
- Lower worker efficiency—Many companies have reported lower productivity in Southeast Asia partially offsetting lower wages.
- Potential language barriers.
FINANCIAL MARKETS HAVE HUGE ROOM TO GROW
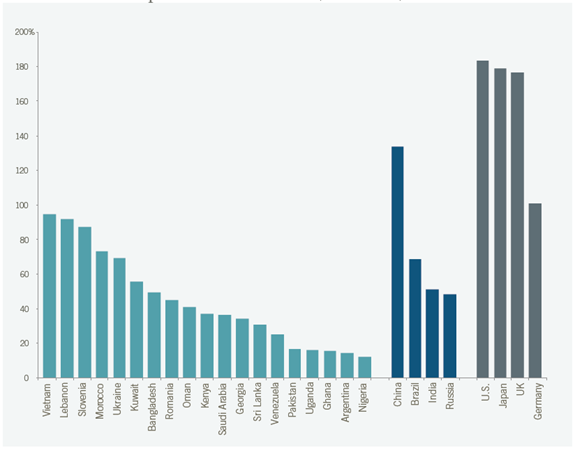
Long term, market dynamics for these markets should continue to improve. Pension reforms have yet to unleash local demand for equities, but when this happens, it should help deepen the market and remove some of the volatility created by foreign buying. The region also has a very poorly developed banking system. Total loans as a percentage of GDP are extremely low relative to both developed and emerging markets (excluding Vietnam), while mortgages and credit card debt are almost non-existent (Figure 2). We expect that future credit growth will increase as these markets evolve.
Figure 2. Give Them Credit
Domestic credit to private sector in 2012 (% of GDP)
Sources: World Bank, IMF, Demirguc-Kunt, and Klapper 2012.
WINNERS AND LOSERS
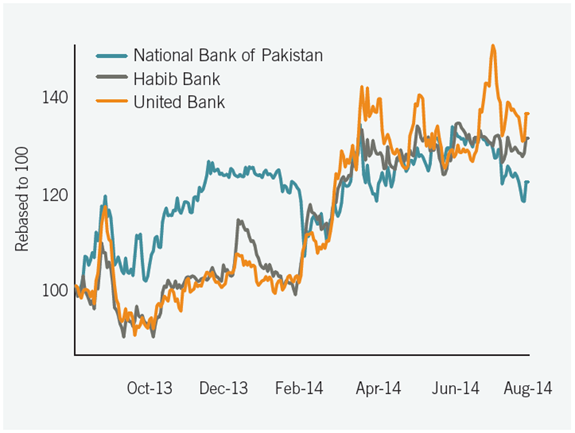
Identifying a theme or a trend, however, does not necessarily make a successful growth investment. Stock returns within the same country and industry can exhibit notable dispersion. In Figure 3, we have illustrated some examples where companies in the same sector or industry have performed in very different ways. Within the Pakistan banking sector, investing in both United Bank and Habib Bank has proved far more successful than investing in National Bank of Pakistan, which is of similar size. Where both of these banks have succeeded and where National Bank has failed has been in the execution of their investment program and strategies. Habib Bank, the largest Pakistani bank, has enjoyed a far stronger normalization of bad debt provisions than most expected, while United Bank has benefited from a pick up in credit growth and margin expansion. By contrast, National Bank of Pakistan has continued to suffer from large-scale NPLs, which has seen the share price dramatically underperform other banks within the sector.
Figure 3. The need to be active is important
Source: Bloomberg.
As of August 31, 2014
Therefore, it is extremely important to spend a great deal of your research figuring out who really is winning in these marketplaces. This will help to refine stock-picking ideas. It also highlights the importance of meeting companies face-to-face. The value of meeting company management cannot be stressed strongly enough, particularly in their home markets—visiting their stores, factories, etc.—but also visiting their competitors at the same time. This is fundamental to properly evaluate companies and their competitors and brings us back to our belief that investors should not take a broad approach to buying stocks, but instead should focus on buying individual companies that will deliver near term and also over the medium to long term.
THE ASIAN FRONT LINE
As with other frontier markets, economic growth rates in Asian frontier markets are far outstripping most emerging and developed markets. These markets are also becoming more important for frontier investors as positive demographics, low penetration levels in consumer sectors, pension reforms and an underdeveloped banking system provide a robust backdrop for investing. Additionally, with the flexibility of a broad range of investments across an increasing opportunity set, this part of the frontier world offers genuine excitement for us as experienced investors. With a focus on quality, Asian frontier markets should prove rewarding and will increasingly make a significant contribution to a frontier market portfolio.
SRI LANKA—THE JEWEL IN THE INDIAN OCEAN
Sri Lanka is one of our favorite areas of Asia. It is the only country in South Asia that is currently rated “high” on the Human Development Index, and its rating is ahead of India, Indonesia, Thailand, and even China. The World Bank’s Doing Business Report ranks Sri Lanka 54th in “Ease of starting a business”—ahead of most developing countries (Figure 4).
Notably, although Sri Lanka’s population of 20 million is relatively small; its per capita GDP, at $3,000, is much higher than India ($1,500), Bangladesh ($800) and Vietnam ($1,700), which places the nation in the same league as the Philippines ($2,600) and Indonesia ($3,600). Furthermore, long before the civil war had ended, the seeds of improving macro dynamics were already being sown. Since 2004, the authorities have managed the fiscal accounts more prudently and macro dynamics have improved as public debt levels have fallen and inflationary pressures have subsided. After peace finally returned in 2009, the macro backdrop was already favorable. As a result, economic growth has jumped and has been driven primarily by construction, mining, transport, communication, and hotels, rather than by government services—which have actually fallen. In other words, the growth acceleration has been genuine, driven by the private sector rather than stimulus-induced.
The growth acceleration has been accompanied by disinflation. Core CPI has fallen steadily over the last 10 years as continued restraint in public spending has driven inflation lower. Consistently, government sector real wages have fallen by over 20% in the past decade, even as private sector real wages have risen—another sign of fiscal restraint and private sector-driven growth. Moreover, the end of the civil war has sparked a surge in inward remittances, which now account for almost 10% of GDP. Finally, average manufacturing wages in Sri Lanka have not risen much and, therefore, remain competitive compared with those of Bangladesh and China—Sri Lanka’s two main competitors in the area of garments, its principal export item.
In absolute terms, the equity market is not expensive. Its forward P/E is 14.6x and its price-to-book is 1.8x.1 In brief, the Sri Lankan equity market now commands valuations on par with other frontier markets, but with a much better structural and cyclical backdrop. The equity market is also well diversified as no companies or sectors skew the market cap in their favor. Some of the financial stocks look particularly interesting.
Figure 4. It's easier to do business than many expect
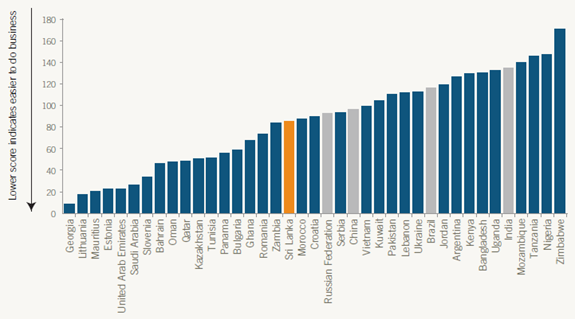
Economies are ranked on their ease of doing business, from 1 to 189. A high ranking on the ease of doing business index means the regulatory environment is more conducive to the starting and operating of a local firm. This index averages the country’s percentile rankings on 10 topics, made up of a variety of indicators, giving equal weight to each topic.
Source: World Bank.
As of June 30, 2014
1Sources: Bank of America and Merrill Lynch.
2104-US-5129
重要情報
当資料は、ティー・ロウ・プライス・アソシエイツ・インクおよびその関係会社が情報提供等の目的で作成したものを、ティー・ロウ・プライス・ジャパン株式会社が翻訳したものであり、特定の運用商品を勧誘するものではありません。また、金融商品取引法に基づく開示書類ではありません。当資料における見解等は資料作成時点のものであり、将来事前の連絡なしに変更されることがあります。当資料はティー・ロウ・プライスの書面による同意のない限り他に転載することはできません。
資料内に記載されている個別銘柄につき、売買を推奨するものでも、将来の価格の上昇または下落を示唆するものでもありません。また、当社ファンド等における保有・非保有および将来の組入れまたは売却を示唆・保証するものでもありません。投資一任契約は、値動きのある有価証券等(外貨建て資産には為替変動リスクもあります)を投資対象としているため、お客様の資産が当初の投資元本を割り込み損失が生じることがあります。
当社の運用戦略では時価資産残高に対し、一定の金額までを区切りとして最高1.265%(消費税10%込み)の逓減的報酬料率を適用いたします。また、運用報酬の他に、組入有価証券の売買委託手数料等の費用も発生しますが、運用内容等によって変動しますので、事前に上限額または合計額を表示できません。詳しくは契約締結前交付書面をご覧ください。
「T. ROWE PRICE, INVEST WITH CONFIDENCE」および大角羊のデザインは、ティー・ロウ・プライス・グループ、インクの商標または登録商標です。
ティー・ロウ・プライス・ジャパン株式会社
金融商品取引業者関東財務局長(金商)第3043号
加入協会:一般社団法人日本投資顧問業協会/一般社団法人投資信託協会
