November 2023 / INTEGRATED EQUITY
Integrated Equity Quarterly Newsletter
Understanding Market Dynamics Better With Thematic Baskets
Quarterly Factor Returns
(Fig. 1) July 1, 2023–September 29, 2023
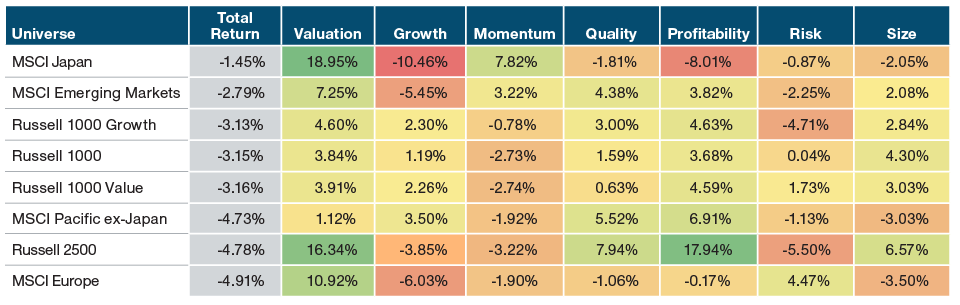
Past performance is not a reliable indicator of future performance.
Sources: Refinitiv/IDC data, Compustat, Worldscope, Russell, and MSCI. Analysis by T. Rowe Price. See Additional Disclosures. Total return data are in U.S. dollars.
Factor returns are calculated as equal-weighted quintile spreads. Please see Appendix for more details on the factors.
The third quarter of 2023 was marked by the outperformance of value and quality factors (such as quality, size, low risk, and profitability) as the market priced in the Federal Reserve’s commitment to keep interest rates “higher for longer.” There was a notable difference between valuation at the index and factor levels: While the Russell 1000 Growth Index outperformed the Russell 1000 Value Index, within each universe, the valuation factor added significant stock selection alpha. We highlight three points:
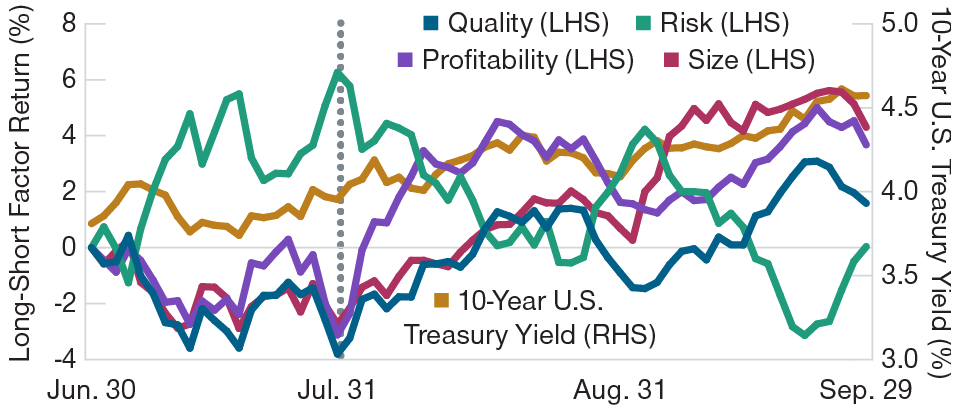
1. U.S. large-cap stocks experienced a risk rally in July, which fully reversed in a flight to quality as interest rates climbed over the rest of the quarter. In July, high risk outperformed low risk by approximately 6%, while various quality measures (such as quality, profitability, and size) underperformed as investors priced in a soft landing (Figure 2). However, from the end of July to the end of September, the 10-year U.S. Treasury yield rose from 3.97% to 4.59% as investors absorbed the Fed’s commitment to keep rates higher for longer. As a result, factor performance reversed, with high risk underperforming low risk by almost 10% and quality factors outperforming. We believe quality investing still has an attractive outlook from here: If real (inflation‑adjusted) interest rates continue rising, quality stocks, which are shorter-duration assets, should continue outperforming. However, if real rates fall, it will likely be due to economic weakening, in which case quality should also provide support.
Russell 1000 Factor Performance Vs. the 10-Year U.S. Treasury Yield
(Fig. 2) June 30, 2023–September 29, 2023
Past performance is not a reliable indicator of future performance.
Sources: Refinitiv/IDC data, Compustat, FactSet, and Russell. Analysis by T. Rowe Price. See Additional Disclosures. The Russell 2500 Index is the U.S. small- to mid-cap universe. Long represents the top quintile—benchmark return. Short represents the bottom quintile—benchmark return. Please see Appendix for more details on the factors.
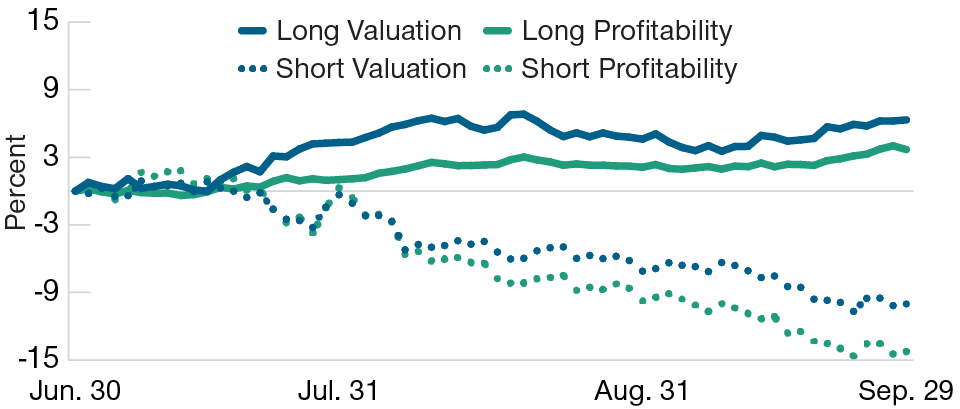
2. U.S. small-caps showed a similar flight to quality, with asymmetrically negative returns for expensive and unprofitable stocks. This quarter, the Russell 2500 Index’s cheap valuation and high profitability factors experienced abnormally positive returns (Figure 1). However, these returns were asymmetrical on the short side with expensive/low‑quality stocks particularly underperforming during the August to September period (Figure 3). This reinforces the general takeaway that rising rates are prompting investors to focus on equities with high quality and reasonable valuations; however, we point out that this was more prominent in small-caps, where we’ve written about the lowered index quality over time (e.g., there are more negative earners). This quarter’s performance is a reminder of the importance of active management and having a quality focus among small-caps.
Russell 2500 Factor Performance, Separated Into Long vs. Short Legs
(Fig. 3) June 30, 2023–September 29, 2023
Past performance is not a reliable indicator of future performance.
Sources: Refinitiv/IDC data, Compustat, FactSet, and Russell. Analysis by T. Rowe Price. See Additional Disclosures. The Russell 2500 Index is the U.S. small- to mid-cap universe. Long represents the top quintile—benchmark return. Short represents the bottom quintile—benchmark return. Please see Appendix for more details on the factors.
3. Japan was a factor outlier this quarter, as all that mattered was valuation. In some ways, Japan looked like the rest of the world, with valuation outperforming growth and negative returns to risk. However, in some ways, Japan was different—for example, the magnitude of the valuation factor’s outperformance was stark. Momentum had a positive return in Japan, while it was negative elsewhere, and quality factors were negative. We view this as a continuation of the dynamic we wrote about last quarter—that attractive valuations have been in focus following the Tokyo Stock Exchange’s directive for companies to focus on shareholder value and seek to raise price/book value ratios. This appears to be a structural change in the Japanese market that is worth following closely.
MARKET INSIGHT—WHAT WE’RE MONITORING
Thematic Investing—An Introduction
The rise of exchange-traded funds (ETFs) and data-driven investing has increased the importance of factor, thematic, or basket investing. We define a “thematic basket” as a group of stocks that tend to move together due to some common underlying exposure. Technically, traditional investment styles, such as value, growth, high dividend, or low volatility, could be considered thematic baskets, but, as the investment landscape has evolved, portfolio managers have been able to pinpoint more sophisticated themes. Examples include fundamental attributes (e.g., China exposure), targeted outcomes (e.g., inflation protection), business end markets (e.g., electric vehicles), or unforeseen events (e.g., COVID-19).
Why are thematic baskets important? We highlight four potential use cases:
- Market insight: Allow investors to understand market dynamics better (e.g., separating artificial intelligence, or AI, tailwinds from general information technology, or IT, stock performance).
- Alpha generation: Can allow investors to generate alpha when they have a differentiated, unpriced view on a given theme.
- Risk management: Allow investors to measure and manage “hidden risks” in their portfolios, such as COVID-19 exposure or indirect China exposure within U.S. companies.
- Asset allocation: As advisors focus on intelligently allocating for their clients, thematic baskets allow them to finely tune their portfolio’s desired exposures.
Taking global security as an example of one of the themes we are looking at, we developed a “global security” research basket that benefits from exposure to the rise in personal, geopolitical, and cyber risks that we see globally. Geopolitical tensions are high and rising, and increasing exposure to such companies could provide ballast as tensions turn into conflicts or as cyberattacks result in financial losses.
In this newsletter, we discuss our framework for thematic baskets using our Artificial Intelligence (AI) basket as a case study.
Thematic Baskets—Our Approach
Step 1: Theme Identification. We focus on themes that will be important to investors and are, in our view, durable and measurable. For example, stocks beginning with the letter “A,” or IT stocks in general, are not, in our view, worthwhile themes, whereas stocks benefiting from AI is a viable theme to track and understand.
Step 2: Identifying stocks that are exposed to the theme. This process requires a combination of fundamental, quantitative, and data science approaches, and the approach needs to be tailored differently for every theme. At T. Rowe Price, identifying, researching, and analyzing themes is a group effort in which we marshal resources from our fundamental research platform, our quantitative research team, and our data science team. To expand on these techniques:
- Fundamental analysis: Often the best way to identify stocks exposed to a theme is to survey fundamental analysts. This is particularly true when stocks in the same industry may have very different exposures. For example, COVID-19 exposure was initially most effectively evaluated through human judgment.
- Quantitative analysis: Another way to identify stocks exposed to a theme is through traditional quantitative techniques such as regression. A typical approach would be: (1) identify a small group of stocks exposed to a theme; (2) calculate returns for that group of stocks relative to the market; and (3) regress the entire universe of stocks against that basket’s returns to calculate betas for every stock, often limited to days where the basket has significant excess returns. This works well when the analyst can identify certain days on which the market clearly reacted to a given theme. An alternative approach would be to use supply chain data, such as revenue breakdown or customer/supplier relationships—again, these data can either be used to create the basket, or to identify a sub-basket to be used in regression.
- Data science: The third critical resource involves sophisticated data science. For example, an investment professional can apply natural language processing (NLP) to his or her firm’s internal research notes, external company descriptions, regulatory filings, annual reports, or job postings to identify stocks linked to a given theme.
Step 3: Basket construction to capture exposure to the theme. Typically, we combine the techniques for an optimal process—for example, using fundamental analysts to create an initial basket and then augmenting the basket using quantitative or data science approaches. Thematic basket construction is nuanced, so our approach is tailored to each theme. Recent thematic baskets include:
- COVID-19: We employed fundamental analysis (since many stocks shifted exposure to pandemic-related trends over time) and traditional quantitative analysis (there were clear COVID on/COVID off days in the market).
- Global Security: We employed fundamental analysis (e.g., to differentiate within the aerospace and defense industry) and data science NLP to find additional stocks exposed to the theme.
- AI: We employed data science NLP to identify a broad basket of stocks with potential exposure and collaborated with our fundamental platform to refine the basket.
Step 4: Basket analysis. It is hard to determine if a created basket of stocks successfully captures a theme, but good tests include whether the stocks make sense to a fundamental analyst, whether the pairwise correlation of stocks in the basket has increased relative to history, and whether the basket has meaningfully different returns from similar stocks.
Thematic Baskets—An AI Case Study
We now examine AI as an illustrative case study.
Step 1: We determined AI to fit all the criteria for a thematic basket—it is important to the market, cuts across industries, has driven differential returns versus otherwise similar stocks, and is measurable and durable, in our view. Our objective in forming the AI basket is twofold. First, we want to monitor the performance of AI as a theme and its impact on market returns. Second, we want to measure and track our platform’s exposures to the theme. Since we expect AI exposure to impact returns, while remaining undetected by traditional risk models, we use the thematic basket process to augment our risk management approach.
Step 2: For our AI basket, we incorporated all three techniques discussed above:
We created an initial list of candidates by analyzing holdings of AI-exposed ETFs and AI baskets from several sell-side firms.
- We broadened the potential candidate universe by using data science NLP to identify companies discussing AI‑related themes on earnings calls.
- We collaborated with our fundamental platform to refine the basket to include companies they believed were most likely to benefit from AI and augmented the basket with additional names identified by our fundamental platform.
Step 3: The AI basket construction was straightforward because there are no sub-themes and there is still significant uncertainty around how AI will play out, so we wanted to avoid false precision. As a result, we equal-weighted the basket. As a useful contrast, basket construction was more nuanced for our Global Security basket. First, we had multiple sub-themes, such as defense, cybersecurity, and food security, so we ensured meaningful exposure to each theme. Second, there were significant differences in market capitalizations within each theme (e.g., larger companies within defense than cybersecurity), so we used the square root of market caps, along with minimum and maximum constituent sizes.
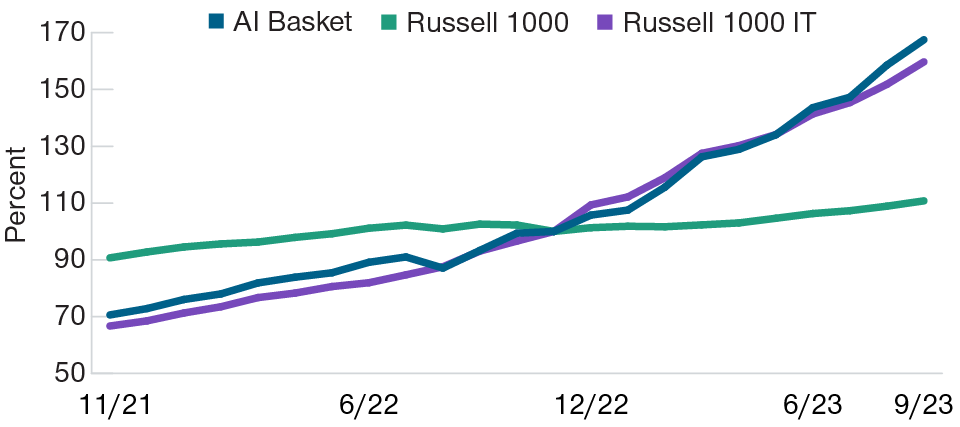
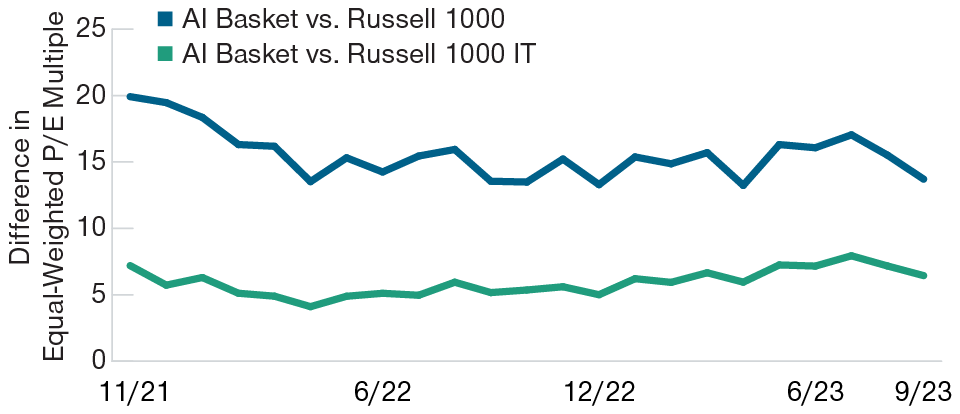
Step 4: The current AI basket has approximately 70 stocks; a representative sample is shown in Appendix A. We analyze the basket by looking at returns, earnings revisions, and valuations to compare it with the market and IT sector. During the market correction in 2022, the AI basket tracked IT very closely; however, since the release of ChatGPT on November 30, 2022, the AI basket outperformed IT by more than 25% through the end of September 2023 (Figure 4). This indicates that our basket captures stocks that were undifferentiated before ChatGPT, and well differentiated following its release. To better understand this outperformance, we analyze the changes in earnings estimate revisions (Figure 5) and P/E multiples (Figure 6). In combination, these figures show that the AI basket significantly exceeded the market return due to rising earnings forecasts and also outperformed IT through a modest combination of rising earnings forecasts and multiple expansion. Said differently, the market is implying a long-term fundamental improvement in AI-related stocks’ earnings; their ability to meet those expectations will determine their relative performance. Monitoring this basket will help in allowing us to make informed decisions.
AI Basket vs. Russell 1000 Index and Russell 1000 IT Sector
(Fig. 4) November 30, 2021–September 29, 2023
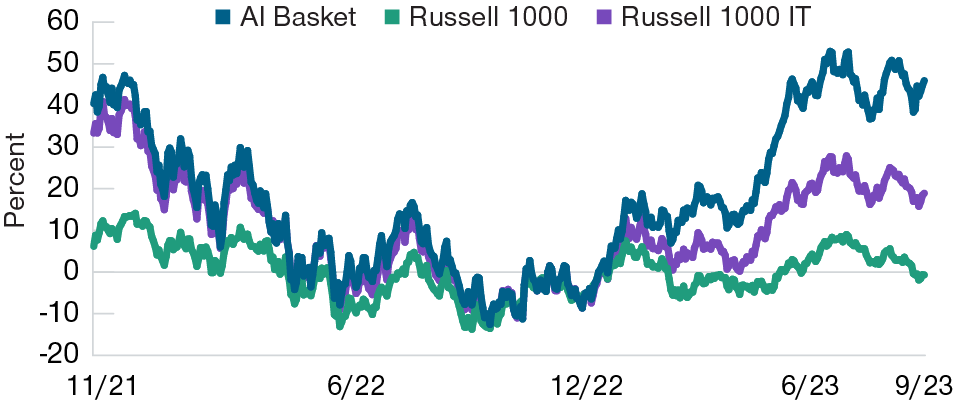
Past performance is not a reliable indicator of future performance. The AI Basket is not representative of an actual investment or portfolio and model results are
hypothetical. Actual investment results would differ, perhaps significantly. See Methodology Disclosures at the end for additional important information.
Sources: Russell, FactSet, and IDC. Analysis by T. Rowe Price. All returns are equal weighted and indexed to 0% on the 11/30/22 ChatGPT release date. The weights of AI Basket stocks are rebalanced back to equal weight every six months.
Earnings Per Share Revisions for AI Basket vs. Russell 1000 Index and Russell 1000 IT Sector
(Fig. 5) November 30, 2021–September 30, 2023
Actual outcomes may differ materially from estimates. The AI Basket is not representative of an actual investment or portfolio. Actual investment results would differ, perhaps significantly.
Sources: Russell, IDC data/Refinitiv, Thomson/IBES, and FactSet. Analysis by T. Rowe Price. Revisions for monthly changes in forward 12-month estimates, equal weighted across the relevant universe. Data are indexed to 100 on the 11/30/22 ChatGPT release date.
Difference in Forward 12-Month Price to Earnings (P/E) Multiple for AI Basket vs. Russell 1000 Index and Russell 1000 IT Sector
(Fig. 6) November 30, 2021–September 29, 2023
Actual outcomes may differ materially from estimates. The AI Basket is not representative of an actual investment or portfolio.
Sources: Russell, IDC data/Refinitiv, Thomson/IBES, and FactSet. Analysis by T. Rowe Price. Difference in multiples calculated by subtracting monthly P/E ratios based on forward 12-month earnings estimates, equal weighted across the relevant universe.
Summary
Thematic exposure evaluation is becoming more important for the investment industry in terms of understanding market returns, generating alpha, managing risk, and driving asset allocation decisions. Thematic investing can be done well or poorly, and T. Rowe Price strives to be positioned as one of the best-in-class thematic providers given our ability to integrate fundamental analysis, quantitative analysis, and data science. We lay out some of the nuanced decisions required in building thematic baskets and highlight baskets we have built under this framework, including Global Security and AI, which we believe are both relevant today.
IMPORTANT INFORMATION
This material is being furnished for general informational and/or marketing purposes only. The material does not constitute or undertake to give advice of any nature, including fiduciary investment advice, nor is it intended to serve as the primary basis for an investment decision. Prospective investors are recommended to seek independent legal, financial and tax advice before making any investment decision. T. Rowe Price group of companies including T. Rowe Price Associates, Inc. and/or its affiliates receive revenue from T. Rowe Price investment products and services. Past performance is not a reliable indicator of future performance. The value of an investment and any income from it can go down as well as up. Investors may get back less than the amount invested.
The material does not constitute a distribution, an offer, an invitation, a personal or general recommendation or solicitation to sell or buy any securities in any jurisdiction or to conduct any particular investment activity. The material has not been reviewed by any regulatory authority in any jurisdiction.
Information and opinions presented have been obtained or derived from sources believed to be reliable and current; however, we cannot guarantee the sources' accuracy or completeness. There is no guarantee that any forecasts made will come to pass. The views contained herein are as of the date noted on the material and are subject to change without notice; these views may differ from those of other T. Rowe Price group companies and/or associates. Under no circumstances should the material, in whole or in part, be copied or redistributed without consent from T. Rowe Price.
The material is not intended for use by persons in jurisdictions which prohibit or restrict the distribution of the material and in certain countries the material is provided upon specific request.
It is not intended for distribution to retail investors in any jurisdiction.
October 2023 / MULTI-ASSET INSIGHTS