Skip to content
Search
T. Rowe Price Global Equity Fund

We're on Bubble-watch. Stay active.

We're closely monitoring market indicators for risks and opportunities to support client portfolios.

Find Out More
  1. Market Bubble
  2. Bubble Watch Framework
  3. Fund At A Glance
  4. Insights

Markets are showing clear signs of bubble-like behaviour, particularly around AI enthusiasm, rising leverage, elevated expectations, and concentrated market leadership.

Despite early warning signs, there is clear near-term momentum driven by the wave of capital rushing to build out AI infrastructure and compute capacity.

As active managers we seek to balance the near-term opportunity against growing speculation and increasing market risks, and we remain thoughtfully invested with a focus on reasonably valued, durable growth companies, while continuing to avoid the most speculative parts of the market.

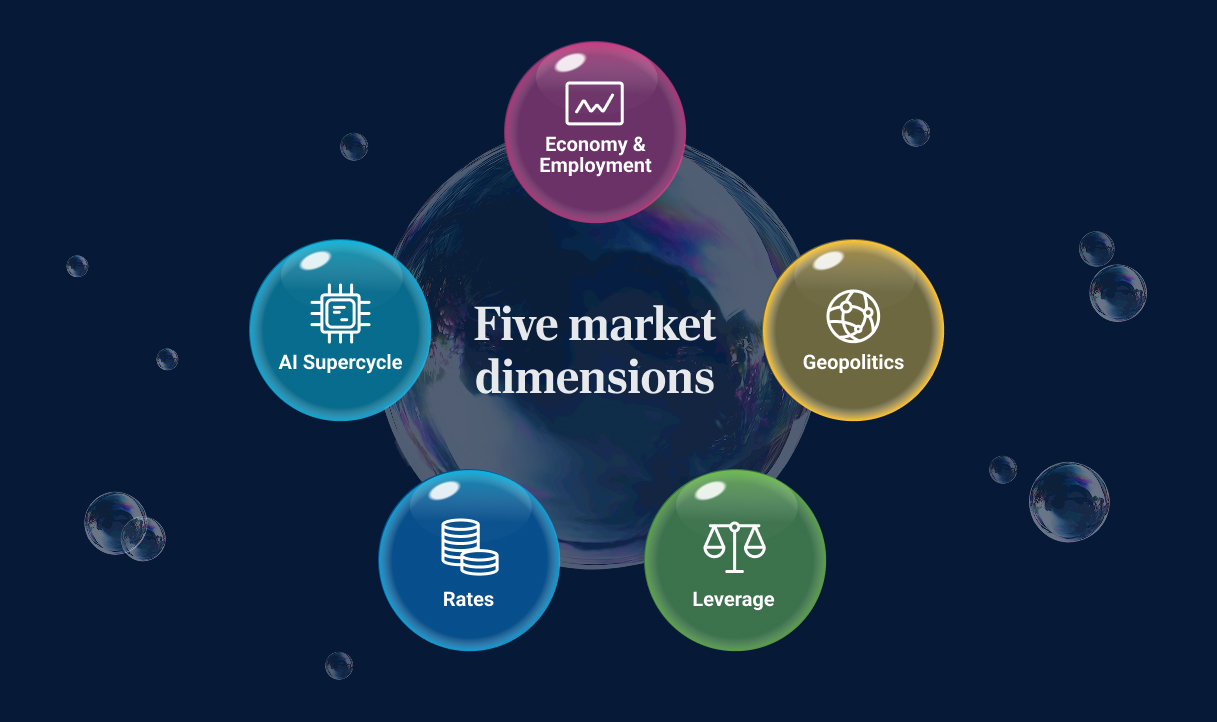
Our bubble-watch framework is one of the ways we are assessing key market risk signals across rates, the economy, AI, leverage, and geopolitics. We use this insight alongside our global research platform to actively adjust portfolio positioning, manage risk, and identify opportunities and threats as conditions change.
In a bubble-like market, we’re staying active, disciplined, and selective for our clients.

July 2026
Looking beyond the AI anxiety and market concentration

In this Ausbiz video, Sam Ruiz highlights:

  • Rising AI‑driven index concentration and extreme price moves drive investor anxiety.
  • Concern that passive investing now hard‑wires exposure to a narrow, capital‑heavy AI complex.
  • Preference for active exposure to industrials, financials, materials, energy and infrastructure plays.
View Transcript

What I know is that investors are getting very anxious now about where we sit in this AI cycle, because definitively returns have been really strong. Fundamentals and earnings are there. But what we know so far this year is that 80% plus of the total global equity index return has been driven by AI stocks. And you can fill now with, you mentioned some results last night. Micron down 10%. Meta makes an announcement kind of up 8%. These daily moves are quite unusual. And it just shows that investors are investing into the dream and hope of AI being great in the future. But the moment something changes, the moment we get a little bit disappointed, you see quite extreme price moves. And to me that just shows we're investing in something we don't know about. So there's going to be a lot more volatility. And that's what I think investors have to realize the stage of the cycle we're in now.

How do you play that then if it's an unknown isn't it.

Yeah. Well the challenge here for investors is the rest of the market is really it's growing but it's lackluster growth. So the opportunity cost of not being invested in something you mentioned Sandisk up 750%. Investors have this fear of missing out. And what we're also seeing is that investors also say, well this is almost a sure thing. The narrative is AI is amazing, AI will continue to change the world and spending will continue. So leverage and a lot of these levered ETFs are really starting to increase. And some of that is actually a little bit worrying but increasing volatility.

How do you play that. To be succinct, I think we are now more concerned about the companies spending the money, spending the free cash flow, starting to lever up their balance sheets to invest in all this infrastructure and capacity in AI. But what we know, at least in the here and now, is that money will continue to benefit a lot of the infrastructure hardware players in the space.

What about that market concentration? How much of a concern is that and that does that? Then as an investor, if you're looking to invest in the market, you need to broaden your outlook. It's not just Wall Street. I mean, you take a look. Korea for instance, just a couple of stocks which has thrown that market so high.

Yeah. Absolutely. So if you were to look at market concentration levels, we are now twice as concentrated as we were ten years earlier. So for the global index now 25% of the index is in just ten stocks. For the US index it's around 40% of that index is just in ten stocks. That concentration grows as the big AI beneficiaries are better and better and better. But if we can agree that there is more hope being placed upon an unknown future for how AI is monetized, then investors now are not getting diversification in an index. In fact, they are going to be quite heavily concentrated and exposed more than any other period of markets, to a point where those cracks start to fall. The big issue for us is those ten stocks I'm talking about have now transitioned from really durable, steady compounders that were capital light to now potentially steady compounders in the future, but are now capital heavy businesses. So the return on invested capital and the free cash flow measures we look at. Fundamentally, we think they look like less healthy businesses going forward.

Okay. So this then we're that position, Sam, where this is the advantage of having an active strategy rather than passive and following an index.

It feels like the market backdrop, we can call it a regime or something else is shifting. And if that regime is shifting, investors need to think about if that future of what the market wants to reward is different. If, I mean, God forbid, the market starts to focus on what we now call boring businesses, businesses that just benefit from the consumer or from manufacturing start to actually be in vogue again. That's something that investors are heavily underexposed to today. So it's one thing that I think the opportunity set will be broader. And investors are not going to get that in passive strategies. But it's also if we start to see cracks, not just in the AI trade but in the economy. And if this cycle is closer to ending whatever cracks it, whether it's inflation or another war oil or something like that, there's been a few concerns along the way, the impact and the volatility investors are going to feel now and passive is going to be much greater than it has been in the past. But the distinct difference here is passive will not change. So where active is going to offer investors something that they should think more about in the future is if that market regime is changing, you are locking yourself in passive effectively to the AI trade, when the market might be much broader and about something else in the future.

So, Sam, beyond the AI trade, where are you seeing the opportunity?

Right now it's in industrials. It's a little bit in financials. It's actually in some physical asset harder businesses. So areas of cost materials. We actually still think despite the moves and oil price poster potential resolution because it's not resolved yet. Um offer a lot more not just inflation protection but exposure to a supply chain that's going to have to retool in a world where energy security is much more important. So I think that while AI is becoming more physical asset heavy in a sector that was quite capital lite and about operating leverage of cloud and software and things like that. We're actually investing a little bit more in physical asset heavy parts of the market, but away from tech. So materials, utilities, a little bit of real estate are examples there.

All right. I mean, you talk about, um, I guess the infrastructure assets which are in vogue. So you see a lot of potential there then.

Uh, infrastructure in a different way. So infrastructure is, is actually our exposure to tech, where we're actually leaning more away from those mega stocks, driving the index more towards where they're spending the money. So within AI infrastructure and even you might not expect it, but AI is actually starting to dominate other sectors like industrials now that are supplying the infrastructure.

Well case in point being caterpillar for instance how well that stock's done because well it's not just earthmoving equipment. It's supplying data centers now too.

Yeah. So we own caterpillar and that's a that's a perfect example. They are selling effectively gas generators or diesel generators that are powering data centers. Because as the hyperscalers build a new, um, data center, they don't have enough capacity from the grid. So it's sort of bring your generators that were used in mines out in, you know, very remote places.

May 2026
How are we managing client portfolios through the market bubble?

In this video Associate Portfolio Manager,  Iona Dent explains:

  • Why Scott and the team believe we are in a market bubble
  • How we’re participating and staying active
  • The five key dimensions of our bubble-watch framework
  • How the team are using the framework to benefit client portfolios
View Transcript
Bubble indicators & staying active

We are somewhere in a bubble

We really believe that we are somewhere in a bubble and we would definitively call it that. And of course with bubbles you can have mid cycle pull backs.

If we look at an analogy here and I like this chart because it's actually pretty simplistic.

What we're doing here is we're just plotting the S&P cumulative return, the tech bubble versus now.

So in the Navy blue line, you see the launch of Netscape actually in August 1995.

And similarly we have the pink line, which is the launch of ChatGPT in November 2022.

And you can see quite a similar trend here, strong upward cycle.

In both instances we've had mid cycle pullbacks, so back in ‘98 and of course last year with tariffs and now this year and in the first quarter as well with concerns around the Middle East.

That said, we fundamentally believe that there is further for this market to run and why is that?

Multiple reasons we can talk through, but one is actually the monetary stimulus is still feeding through with a transmission mechanism.

We have the rate cuts coming through from last year.

Secondly, as the fiscal spend coming through and the one big beautiful bill so-called, this has been genuinely quite supportive and the US is running a deficit of 6%, which we can discuss the sustainability of that, but is giving a genuine fiscal impulse to the economy on the demand side.

In addition, we are seeing elements of speculation and frenetic moves.

We do think we're seeing indications of retail hype, meme stocks for example doing pretty well again, profitless tech performing very well last year as well.

And the top 5% of beta, the really sort of more speculative growth, these stocks doing relatively better.

Fascinating example is Allbirds, the sneaker company that you know was very trendy back in 2021 in Silicon Valley and then had its time and kind of went out of fashion and was almost written off in investors minds.

And they then said a couple of weeks ago, look, we're pivoting. We are now going to be a compute company and we're going to buy GPU's. And the share price of that company was up 600% in one day. So clearly elements of speculation here and signs of a bubble.

Don’t leave the party early

Leaving the party can be just as bad as not going. And actually, if you look back to the tech bubble and the NASDAQ performance, over 50% of the four year total NASDAQ return occurred in the final year.

So what are we doing here?

We're very fortunate to have such a broad platform of analysts who have the time and the capacity to be on the ground meeting management teams, building bottom up models and forecasts.

And what we're doing is we're focusing on participating where the fundamentals really justify that is companies where we're seeing real earnings upgrades coming through, real pricing power management teams that we trust to allocate capital effectively throughout the cycle and market share gains in this competitive environment.

So we have to navigate this responsibly. And we're very fortunate to have the the platform to be looking at all these companies in this excitement.

Our bubble-watch framework in action

What we've done is we've said, look, we need a framework to make this systematic and not emotional.

So we've studied a lot of prior bubbles to look at the conditions for bubbles and also conditions around which bubbles do end.

And there are five key points that we would draw upon here.

And as you can see on the right hand side, we have sort of we're taking the temperature on each of these.

We've got a bit of a traffic light system; green looking more promising, red high risk, a little bit more flag for concern. On interest rates, bubbles do not pop with interest rates flat or going down.

Historically, they only tend to pop when rates go up.

Now of course, US, Iran does add a little bit of nuance here.

But that said, when we look at everything coming out of the Fed and we speak to our macro analysts, they will tell you that this is a supply side shock and hiking rates is not going to change the price of oil unfortunately. That is not how the transmission mechanism works.

In addition, the Fed does have a dual mandate and it has to focus on both employment and output as well as inflation.

And so we need to be cognizant that whilst unemployment is in a very good place right now, we may ultimately see some pressures from some of the cuts being put through thanks to the productivity gains.

So right now, we're feeling neutralist on rates, a little bit worse versus the start of the year.

But on our side, we're not expecting an aggressive hiking cycle right now in the US in particular.

What about the broader economy and employment?

Of course, bubbles do tend to pop when we see recessions and that is something to watch.

But as I mentioned, actually the global economy was in an encouraging position before this kicked off.

And we don't invest in economies, we invest in companies, in bottom up stocks.

And if you look at the earnings of these companies, they're still accelerating.

We're seeing the all country world index, we're seeing high teens expectations for the next year as in EM, we're seeing higher 28% growth expected on a one year view.

So we're still seeing encouraging signs coming out of companies as they report and no imminent signs of a recession.

What about the AI super cycle?

When we look at historical bubbles, of course, when the tech price does not come through in reality, that can cause disappointment.

Scott and I have spent a fair amount of time meeting the companies this year, but also on the ground in Silicon Valley.

And what is fascinating is actually this is a piece where we feel even more constructive than at the beginning of the year.

One example is if you look at the scaling laws, the models that are coming out are only getting better and better and more powerful.

And you can see that in Mythos, for example, the release from Anthropic, where it was deemed so powerful that actually they did not want it to be yet released to the general public.

And it's being used to shore up cybersecurity for some dominant companies.

So of course, we need to watch for risk of CapEx cuts.

But actually, this week, even with the MAG 7 results, we've seen further CapEx increases.

So one to watch, but an area we still feel very good on.

What about leverage? Leverage is #1, where again, if you see excess leverage and of course, a hiking rate cycle. #2, that tends to be bad for bubbles.

Net, we want to run a lot of data on this front. And sovereign debt is a place to monitor with higher fiscal debt to GDP. But private debt is still in a very good pace.

Households have deleveraged substantially. Post to GFC.

And whilst we're seeing pockets of stress in private credit, when we really dig into it, there's nothing we see that is genuinely systemic on that front.

And then very lastly, geopolitics. As I mentioned, we are running a lot of scenario analysis here, but ultimately this is a place where we feel worse unequivocally versus the start of the year.

So that is one reason why we have pared back the beta of the portfolio at the margin from 1.13 coming into the year versus our core benchmark to 1.08 at the end of the first quarter.

Fund at a glance

Introducing the T. Rowe Price Global Equity Fund

Portfolio Manager, Scott Berg addresses the following questions: 

  1. What are the advantages of the global growth equity strategy?
  2. What characteristics are you looking for when investing in a stock?
  3. Why does active management matter?
View Transcript
Global Growth Equity Strategy Introduction with Portfolio Manager, Scott Berg

What are the advantages of the global growth equity strategy?

I think really four things.

I mean, the first one is it truly is the wholeworld in a single portfolio, and that's rarer than it sounds out there. The majority of global managers today are invested in about fifteen countries. We're in more like thirty.

The second thing is that it really is leveraging this incredible world-class research platform. It's not a small boutique of people having a global equity. It's reflecting the very best thinking of one of the deepest, most talented investment firms in the world.

The third thing is it has that durable quality growth focus. And what I like about that, it means the assets we own in general are ones where time is our friend, where with every passing year, their earnings are higher, their cash flows are higher, and we would expect them on average to be worth a bit more.

And then the last thing is that portfolio construction is done in a way that is diversified, not just across countries, but across sectors.

So we're trying to be also thoughtfully aware of things we don't know and uncertainties that are just very difficult to play out and really focus on the stock picking of the best companies within every sector and across all those countries so that we're not too beholden to any one or two big things that could go wrong.

What characteristics are you looking for when investing in a stock?

We try and fill the portfolio with durable quality growth companies and that sounds like a lot of jargon, but simplistically, the four things I really look for is, as, as we're looking at companies to put in the portfolio.

Firstly, companies that play in an attractive industry, what I call a fertile industry, where there's a large and growing market and a large and growing profit pool for all the industry participants. 

Secondly, companies that are really special, that have a true competitive advantage within that fertile industry. Companies that are taking market share overtime that leads to so many other benefits of, natural scale leverage, attracting better people, retaining better people, lower cost of capital over time.

Thirdly, I want a management team that I really trust, and particularly that I trust on capital allocation.

I think for growth investing, one of the most important things is companies that have the ability to reinvest meaningful cash at good returns over time, and capital allocation is key.

And if those first three things are true, a fertile industry, a special company, and a great management, then we look at the valuation to say, "Do we think we can make forty to sixty percent over two to three years investing in this?" And that's looking at the free cash flow yields, the price earnings.

Why does active management matter?

As an active investor, what I really love is finding things where there's inefficiency, where things are hard, and where we have a real advantage.

And I think at T. Rowe Price, the fact that we have such experience for so many years and so many people in these markets, and that there is a lot of information asymmetry, that there's a lot of emotion and a lot of fear and greed that play in those markets means it's somewhere where it's great as an active manager to add alpha.

T. Rowe Price Global Equity Fund T. Rowe Price Global Equity (Hedged) Fund

T. Rowe Price Global Equity Fund

I Class

You can get the latest information on Performance and Stock holdings here.

High conviction, global equity portfolio seeking to invest in companies with above-average and sustainable growth characteristics.

MANAGER INCEPTION
6 June 2012
BASE CURRENCY
AUD
MANAGEMENT FEE & COSTS^
0.85% p.a.
APIR CODE
ETL0071AU
BENCHMARK
MSCI All Country World Index ex Australia Net
T. Rowe Price Global Equity Fund accolades: Morningstar Gold, Lonsec Research 5 Highly Recommended, Zenith Highly Recommended, Genium 5 Highly Recommended
Fund literature
Performance Report Quarterly Report I Class PDS S Class PDS Proxy Voting Summary
Fund Profile ESG Engagement Report Carbon Footprint Report Modern Slavery Statement
Fund introduction video


Past performance is not a reliable indicator of future performance.

3 T. Rowe Price Global Equity - I Class received a Morningstar Medalist Rating™ of “Gold” as of 31 March 2026.
^ The Management Fee for the T. Rowe Price Global Equity Fund - I Class is 0.85% p.a. and the Indirect Cost is 0.00% p.a. Full details of other fees and charges are available within the Fund's Product Disclosure Statement and Reference Guide.

View Important Research House Rating Information

T. Rowe Price Global Equity (Hedged) Fund

I Class

You can get the latest information on Performance and Stock holdings here.

High conviction, global equity portfolio targeting companies with above-average, sustainable growth characteristics. Currency hedged (to AUD) to seek to reduce foreign currency-related fluctuations.

SHARE CLASS INCEPTION
15 November 2018
BASE CURRENCY
AUD
MANAGEMENT FEE & COSTS^
0.87% p.a.
APIR CODE
ETL0312AU
BENCHMARK
MSCI All Country World Index ex Australia (Hedged to AUD) Net
T. Rowe Price Global Equity (Hedged) Fund accolades: Morningstar Gold, Lonsec Research 5 Highly Recommended, Zenith Highly Recommended
Fund literature
Performance Report Quarterly Report I Class PDS S Class PDS
Fund Profile ESG Engagement Report Carbon Footprint Report Proxy Voting Summary


Past performance is not a reliable indicator of future performance.

3 T. Rowe Price Global Equity (Hedged) - I Class received a Morningstar Medalist Rating™ of “Gold” as of 31 March 2026.
^ The Management Fee for the T. Rowe Price Global Equity (Hedged) Fund - I Class is 0.87% p.a. and the Indirect Cost is 0.00% p.a. Full details of other fees and charges are available within the Fund's Product Disclosure Statement and Reference Guide.

View Important Research House Rating Information

More global equity insights

View more insights

Important Information

Available in Australia for Wholesale Clients only. Not for further distribution.

Equity Trustees Limited (“Equity Trustees”) (ABN: 46 004 031 298, AFSL: 240975), is the Responsible Entity for the T. Rowe Price Australian Unit Trusts ("the Fund").  Equity Trustees is a subsidiary of EQT Holdings Limited (ABN: 22 607 797 615), a publicly listed company on the Australian Securities Exchange (ASX: EQT).

This material has been prepared by T. Rowe Price Australia Limited ("TRPAU") (ABN: 13 620 668 895, AFSL: 503741) to provide you with general information only. In preparing this information, we did not take into account the investment objectives, financial situation or particular needs of any particular person. It is not intended to take the place of professional advice and you should not take action on specific issues in reliance on this information. Neither TRPAU, Equity Trustees nor any of its related parties, their employees or directors, provide and warranty of accuracy or reliability in relation to such information or accepts any liability to any person who relies on it.

Past performance is not a guarantee or a reliable indicator of future results. You should obtain a copy of the Product Disclosure Statement, which is available from Equity Trustees (http://www.eqt.com.au/insto) or TRPAU (http://www.troweprice.com.au), before making a decision about whether to invest in the Fund named in this material.

The Fund’s Target Market Determination is available here (http://www.eqt.com.au/trprice). It describes who this financial product is likely to be appropriate for (i.e. the target market), and any conditions around how the product can be distributed to investors. It also describes the events or circumstances where the Target Market Determination for this financial product may need to be reviewed.

202605-5528885