July 2026, Equity
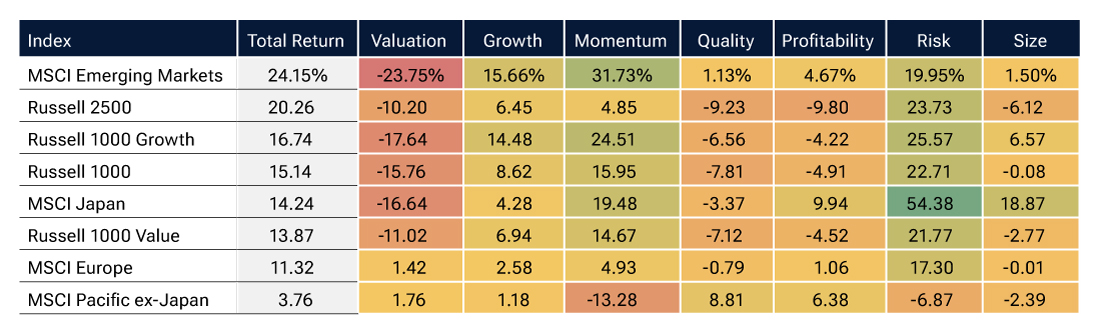
The second quarter was marked by another sustained risk‑on rally and strength in momentum stocks. Key drivers included continued enthusiasm for the artificial intelligence (AI) capital expenditure cycle and a strong earnings season, both of which seemed to supersede concerns about the U.S.‑Iran war. Valuations and quality, on the other hand, were largely detractors (Figure 1).
(Fig. 1) April 1, 2026 – June 30, 2026
Past performance is not a guarantee or a reliable indicator of future results.
Sources: Refinitiv/IDC data, Compustat, Worldscope, Russell, and MSCI. Analysis by T. Rowe Price. See Additional Disclosures for more detail on the sources used throughout this material. Total return data are in U.S. dollars. Factor returns are calculated as equal‑weighted quintile spreads. Quintiles are rebalanced daily.
Factors or factor analysis involves targeting quantifiable firm characteristics, or “factors,” that can explain differences in stock returns. Over the last 50 years, academic research has identified hundreds of factors that impact stock returns. See Appendix for calculation methodology, definitions of financial terms, and more details on the factors referenced throughout the article. The data presented in this material are for illustrative purposes only and do not represent an actual investment nor any T. Rowe Price product.
Factor performance trends were persistent in the U.S. (Figure 2A) and even more consistent with emerging markets (Figure 2B).
We see fundamental and technical reasons for this alignment in U.S. and emerging markets factor performance:
This convergence in factor performance between U.S. equities and emerging markets raises important questions for asset allocators: chiefly, whether emerging market exposure still provides the level of diversification it has in the past, and whether the AI trade going global will exacerbate any volatility, if and when expectations disappoint. Given that the MSCI Emerging Markets Index is more concentrated, it may perform like a high-beta version of the Russell 1000 and the Russell 2500 indexes.
Past performance is not a guarantee or a reliable indicator of future results.
April 1, 2026, to June 30, 2026
Sources: Refinitiv/IDC data, Compustat, FTSE/Russell, and MSCI. Analysis by T. Rowe Price. Total return data are in U.S. dollars. Factor returns are calculated as equal-weighted quintile spreads. R1000 = Russell 1000 Index; R2500 = Russell 2500 Index; emerging markets = MSCI Emerging Markets Index.
Our research has made extensive use of AI. We have found that these tools appear to add value, especially in situations where traditional quantitative models have exhibited shortcomings.
When designing analyses that incorporate large language models (LLM),1 we seek to integrate our strength in quantitative analysis with our fundamental research analysts’ deep understanding of individual companies and industries.
The significant underperformance of the quality factor and software stocks over the past year prompted us to use AI to explore two key debates in the market:
More broadly, the analyses reinforced the value of bringing both quantitative and fundamental expertise together in leveraging AI tools.
Many investment professionals have attributed the quality factor’s run of underperformance in the small‑ and mid‑cap universe to investor speculation.
We have explored alternative explanations, including technological disruption, the option‑like nature of equity valuations, and changes in market structure and market participants.2
To be clear: We believe that quality companies should outperform over a full market cycle. However, we also recognize that traditional measures of quality can and will lag, sometimes for extended periods.
Traditional quantitative measures of quality—commonly used by investment managers, risk models, and data providers—typically focus on financial characteristics that indicate whether a company has been stable and growing. Frequent inputs in quantitative quality ratings include:
Profitability—e.g., earnings and free cash flow generation;
Earnings stability—e.g., measures of historical profitability; and
Balance sheet strength—e.g., low leverage.
Fundamental investors often take a broader view of quality, incorporating assessments of a company’s industry structure, its competitive advantages, pricing power, management quality, and, increasingly, whether AI could be a tailwind or headwind to the business. Many of these qualitative attributes have been difficult to measure systematically.
LLMs help to make qualitative analyses more practical by extracting information from all manner of unstructured textual sources...
LLMs help to make qualitative analyses more practical by extracting information from all manner of unstructured textual sources, from company filings and earnings call transcripts to investment research reports.
We do not view this approach as a replacement for traditional financial metrics. Rather, the intent is to complement them with a systematic framework for evaluating qualitative aspects of business quality that have historically depended on fundamental analysts’ judgment.
To explore this opportunity, we developed an LLM quality framework that aims to assess whether a business appears to have durable earnings growth and be well positioned from a competitive standpoint. The process involved several steps:
The initial results have been encouraging. As a robustness check, the correlation between our quantitative quality score and the LLM quality score stood at 74% as of June 30, 2026.3 This level of correlation is high enough to suggest that both approaches measure a similar underlying concept, yet low enough to indicate that the information is not redundant. Put differently, the two approaches appear to capture quality through different lenses.
Consistent with this conclusion, about 79% of the Russell 2500 Index received the same quality classification from both methodologies (Figure 3).
Past performance is not a guarantee or a reliable indicator of future results.
Source: FTSE/Russell. Analysis by T. Rowe Price Integrated Equity team.
The universe analyzed comprises the companies in the Russell 2500 Index as of June 30, 2026.For our quantitative model, companies are ranked into deciles by their composite quality score.
Here, companies classified as “high quality” hailed from the top five deciles for quality score;companies classified as “low quality” were in the bottom five deciles. For our LLM framework,companies classified as “high quality” earned a quality score ranging from 6 to 10; companiesclassified as “low quality” received quality scores ranging from 1 to 5. Our composite qualityscores are updated daily and are as of June 30, 2026; our LLM quality scores are updated weeklyand are as of June 27, 2026.
*Equal‑weighted median total returns are in U.S. dollars and cover the 12 months ended June 30, 2026.
We can also use these quantitative and LLM scores to analyze the recent rally in low‑quality stocks. Looking at trailing 12‑month returns across the Russell 2500 Index, stocks that both methodologies classified as low quality outperformed stocks that both systems placed in the high‑quality bucket by 5.6% (Figure 3). More interestingly, among stocks where the two methodologies disagreed in their classifications, companies rated as high quality only by the LLM outperformed companies rated as high quality only by the quantitative model by 9.1%.
While this analysis should be viewed as preliminary, it suggests two potential conclusions:
In fact, when we asked the LLM to analyze structural differences between its view of quality and the traditional quantitative view of quality, it attributed the narrow disagreements that cropped up to:
However, there are two important caveats to our case study.
Look‑ahead bias: We do not currently have a point‑in‑time LLM quality history extending back one year. Although the model was instructed to focus on fundamental quality characteristics, its assessments may nevertheless have been influenced by knowledge of the subsequent market environment.
Potential overfitting: Both the prompt design and scoring framework were refined through multiple iterations, raising the possibility that the methodology may be tailored to the current market environment. Although the aim of this research project was to improve consistency and economic interpretability rather than maximize historical performance, additional out‑of‑sample testing will be necessary to assess the robustness and generalizability of the framework.
Nevertheless, the LLM classifications were directionally consistent with the broader observation that lower-quality stocks outperformed. We therefore believe the analysis may be informative, although the magnitude and persistence of the results require further out-of-sample testing.
Software stocks underperformed significantly over the past year, driven by various AI concerns, including outright product replacement, reduced pricing power, and lower demand for seat‑based licenses.
Is it possible to distinguish between software businesses that are relatively resilient to AI disruption and those that are more exposed?
Developing and applying an LLM framework for assessing software companies’ potential to resist AI disruption involved the following steps.
After multiple rounds of refinement, we ranked small‑ and mid‑cap software companies into quintiles based on their estimated resilience to AI disruption and examined their performance since June 30, 2025.
(Fig. 4) Twelve criteria
Criterion |
Short Explanation |
|---|---|
| Complexity: Logic Depth | Deep workflows are harder to replicate. |
| Complexity: Deterministic vs. Probabilistic | Deterministic rules are easier for AI to automate. |
| Complexity: Output Verifiability | Verifiable outputs can be safely delegated to AI. |
| Buyer Type | Enterprise sales create stickiness; consumer is most exposed. |
| Vertical Specificity | Industry-specific software has deeper moats than horizontal tools. |
| Regulatory Intensity | Regulated workflows create lock-in barriers. |
| Business Model | Seat-based is most at risk. |
| Distribution Advantage | Unique distribution / installed-base creates durable moats. |
| Data Moat | Vendor-owned proprietary data is the strongest moat. |
| Network Effect | Multi-sided platforms create compounding moats. |
| AI Strategy Maturity | Articulated strategy with disclosed adoption/monetization evidence. |
| System of Record | Authoritative source-of-truth data creates deep migration switching costs. |
Analysis by T. Rowe Price Integrated Equity team and our fundamental analysts who cover software.
During periods of software weakness—particularly the drawdown from late 2025 through early 2026—the companies identified as most resilient meaningfully outperformed those identified as least resilient (Figure 5).
Beginning in May 2026, however, the relationship reversed alongside a sharp recovery in software stocks, with the less resilient cohort rallying hardest and ultimately closing the 12 months ended June 30, 2026, ahead of the more resilient group. Even so, the pattern of the most resilient quintile leading during selloffs held consistently over the period analyzed.
Past performance is not a guarantee or a reliable indicator of future results.
June 30, 2025, to June 30, 2026.
Source: FTSE Russell. Analysis by T. Rowe Price Integrated Equity team.We used LLMs to score the Russell 2500 Index software universe against a 12‑criterion framework designed to capture potential defensibility against AI disruption (Figure 4). Each name is scored on every criterion, the scores are summed into a composite, and names are ranked into quintiles. The highest quintile comprises the software companies deemed to exhibit the strongest potential resilience to AI disruption; the lowest quintile comprises names that the model scored as most vulnerable. Median total returns for each equally weighted quintile are in U.S. dollars.
This pattern is consistent with what one might expect from a defensiveness framework. Software companies perceived as more insulated from AI disruption may help to mitigate downside during periods of elevated concern, while companies viewed as more exposed to this risk may benefit disproportionately when those worries recede.
While the observation period remains short and returns over any given window will be shaped by shifting sentiment, the early results suggest that resilience to AI disruption is becoming an increasingly important differentiator within the software sector.
Over longer investment horizons, we believe software companies with stronger competitive positioning, greater pricing power, more defensible customer relationships, and lower AI disruption risk should be better positioned to create shareholder value. We believe making these distinctions is important for small-and mid-cap investors.
LLMs have the potential to expand the set of investment questions that can be addressed systematically, particularly in areas where traditional quantitative models historically have struggled to measure qualitative business characteristics. In our experience, the most effective applications tend to arise not from fundamental or quantitative expertise but from combining the two. Incorporating insights from these two disciplines allows economic intuition and technological sophistication to enhance each other.
The examples we presented illustrate this integrated approach. Our LLM framework suggests that systematic measures of qualitative business quality may capture information that is distinct from conventional quality metrics. Similarly, our software resilience framework demonstrates how LLMs can help evaluate complex competitive dynamics that historically have depended on judgment. While both applications remain in the early stages of development and require additional validation, the initial results suggest that LLMs can provide meaningful signals that complement existing research tools.
As these technologies evolve, we believe the greatest opportunity lies not in replacing established investment processes but in extending them. By combining structured financial data with systematic analysis of unstructured information, investors may be able to measure important business characteristics that historically have been difficult to evaluate at scale. We expect integrating AI tools to become an increasingly important component of quantitative investment research.
Factors are our internally constructed metrics, defined as follows:
Valuation: Proprietary composite of valuation metrics based on earnings, sales, book value, and dividends. Specific value factor weighting may vary by region and sector.
Growth: Proprietary composite of growth metrics based on historical and forward‑looking earnings and sales growth. Factor selection and weighting vary by region and industry.
Momentum: Proprietary measure of medium‑term price momentum.
Quality: Proprietary measure of quality based on fundamental and stock price stability; balance sheet strength; and measures of profitability, capital usage, and earnings quality.
Profitability: Return on equity.
Risk: In this paper, risk is the standard deviation of trailing 12‑month returns. High‑risk stocks exhibit higher standard deviations, indicating a wider degree of variation or dispersion in their historical return.
Size: Market capitalization (positive return means larger stocks outperform smaller stocks).
Quintile spread: Also referred to as long‑short returns, a quintile spread is calculated by sorting securities based on a specific characteristic or factor criterion, dividing them into five groups (or quintiles), equal‑weighting the securities within each quintile, and then subtracting the bottom‑quintile returns (lowest 20%) from the top‑quintile returns (highest 20%).
Factors and indices cannot be invested in directly and are shown for illustrative purposes only. They do not reflect performance of actual investments nor do they reflect the reduction of fees associated with an actual investment, such as trading costs and management fees.
All investments are subject to market risk, including the possible loss of principal. Past favorable company characteristics may not persist into the future.
Investment Risks: Equities can lose value rapidly for a variety of reasons and can remain at low prices indefinitely. Growth stocks are subject to the volatility inherent in common stock investing, and their share price may fluctuate more than that of income‑oriented stocks. Small‑cap stocks have generally been more volatile in price than large‑cap stocks. Mid‑caps generally have been more volatile than stocks of large, well‑established companies. Investing in technology stocks entails specific risks, including the potential for wide variations in performance and usually wide price swings, up and down. Technology companies can be affected by, among other things, intense competition, government regulation, earnings disappointments, dependency on patent protection, and rapid obsolescence of products and services due to technological innovations or changing consumer preferences.
Jul 2026
Equity
Article
Jun 2026
Equity
Article
1 LLMs are AI models trained on vast amounts of human language and excel at categorizing and analyzing complex textual information.
2 For example, see the T. Rowe Price Integrated Equity team’s Q1 2026 paper, “How Innovation is Changing Where Investors Look for Defensive Quality.”
3 As of June 30, 2026. Source: FTSE/Russell. Analysis by T. Rowe Price Integrated Equity team.
Additional Disclosures
For U.S. investors, visit troweprice.com/glossary for definitions of financial terms.
CFA® and Chartered Financial Analyst® are registered trademarks owned by CFA Institute.
Please see vendor indices for more information, including definitions and source data: troweprice.com/marketdata.
Refinitiv, Compustat, FTSE/Russell, and MSCI do not accept any liability for any errors or omissions in the indexes or data, and hereby expressly disclaim all warranties of originality, accuracy, completeness, timeliness, merchantability and fitness for a particular purpose. No party may rely on any indexes or data contained in this communication.
Important Information
Outside of the United States, this is intended for investment professional use only. Not for further distribution.
This material is being furnished for informational and/or marketing purposes only and does not constitute an offer, recommendation, advice, or solicitation to sell or buy any security.
Prospective investors should seek independent legal, financial and tax advice before making any investment decision. T. Rowe Price group of companies including T. Rowe Price Associates, Inc. and/or its affiliates receive revenue from T. Rowe Price investment products and services.
Past performance is not a guarantee or a reliable indicator of future results. All investments involve risk, including possible loss of principal.
Information presented has been obtained from sources believed to be reliable, however, we cannot guarantee the accuracy or completeness. The views contained herein are those of the author(s), are as of July 2026, are subject to change, and may differ from the views of other T. Rowe Price Group companies and/or associates. Under no circumstances should the material, in whole or in part, be copied or redistributed without consent from T. Rowe Price.
All charts and tables are shown for illustrative purposes only. Actual future outcomes may differ materially from any estimates or forward‑looking statements provided.
The material is not intended for use by persons in jurisdictions which prohibit or restrict the distribution of the material and in certain countries the material is provided upon specific request.
Australia—Issued by T. Rowe Price Australia Limited (ABN: 13 620 668 895 and AFSL: 503741), Level 28, Governor Phillip Tower, 1 Farrer Place, Sydney NSW 2000, Australia. For Wholesale Clients only.
Canada—Issued in Canada by T. Rowe Price (Canada), Inc. T. Rowe Price (Canada), Inc.’s investment management services are only available to non‑individual Accredited Investors and non‑individual Permitted Clients as defined under National Instrument 45‑106 and National Instrument 31‑103, respectively. T. Rowe Price (Canada), Inc. enters into written delegation agreements with affiliates to provide investment management services.
DIFC—Issued in the Dubai International Financial Centre by T. Rowe Price International Ltd which is regulated by the Dubai Financial Services Authority as a Representative Office. For Professional Clients only.
EEA—This material is issued and approved by T. Rowe Price (Luxembourg) Management S.à r.l. 35 Boulevard du Prince Henri L‑1724 Luxembourg which is authorised and regulated by the Luxembourg Commission de Surveillance du Secteur Financier. For Professional Clients only.
New Zealand—Issued by T. Rowe Price Australia Limited (ABN: 13 620 668 895 and AFSL: 503741), Level 28, Governor Phillip Tower, 1 Farrer Place, Sydney NSW 2000, Australia. No Interests are offered to the public. Accordingly, the Interests may not, directly or indirectly, be offered, sold or delivered in New Zealand, nor may any offering document or advertisement in relation to any offer of the Interests be distributed in New Zealand, other than in circumstances where there is no contravention of the Financial Markets Conduct Act 2013.
Switzerland—Issued in Switzerland by T. Rowe Price (Switzerland) GmbH, Talstrasse 65, 6th Floor, 8001 Zurich, Switzerland. For Qualified Investors only.
UK—This material is issued and approved by T. Rowe Price International Ltd, Warwick Court, 5 Paternoster Square, London EC4M 7DX which is authorised and regulated by the UK Financial Conduct Authority. For Professional Clients only.
USA—Issued in the USA by T. Rowe Price Investment Services, Inc., distributor and T. Rowe Price Associates, Inc., investment adviser, 1307 Point Street, Baltimore, MD 21231, which are regulated by the Financial Industry Regulatory Authority and the U.S. Securities and Exchange Commission, respectively.
Unless otherwise indicated, this material is issued and approved by T. Rowe Price International Ltd, Warwick Court, 5 Paternoster Square, London EC4M 7DX which is authorised and regulated by the UK Financial Conduct Authority. For Professional Clients only.
© 2026 T. Rowe Price. All Rights Reserved. T. Rowe Price, INVEST WITH CONFIDENCE, the Bighorn Sheep design, and related indicators (see troweprice.com/ip) are trademarks of T. Rowe Price Group, Inc. All other trademarks are the property of their respective owners. Use does not imply endorsement, sponsorship, or affiliation of T. Rowe Price with any of the trademark owners.