February 2024 / INVESTMENT INSIGHTS
A Clear Path to Global High Yield
Today’s yields have rarely been observed over the last ten years
Why High Yield Bonds?
Durable returns over time
High yield bonds have broadly performed favorably across different market cycles. Since 1980, the high yield market has only experienced seven calendar years of negative returns. Perhaps even more impressive is that there have never been two consecutive years of negative returns in the asset class covering 40 years (Fig. 1). Following years of negative returns, the asset class usually experiences years of either outsized gains or several years of modest returns. This resilient return pattern is simply due to “bond math.” The high yield market may experience bouts of weakness, resulting in lower dollar prices, however, it still generates (high) coupons and eventually bonds are pulled to par as they near maturity, fortifying the returns recovery.
High yield bond annual returns
(Fig. 1)
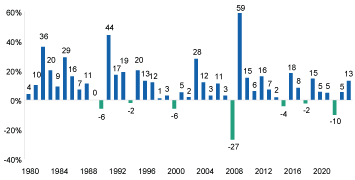
As of 31 December 2023.
Past performance is not a reliable indicator of future performance.
Source for annual returns data: J.P. Morgan Global High Yield Index. Please refer to Additional Disclosure for further source information.
Leveraged credit has generated compelling risk-adjusted returns
While return is certainly an important consideration when evaluating an asset class, volatility must also be evaluated. The Sharpe Ratio, which measures return in excess of the risk-free rate, per unit of standard deviation, can be a useful metric to compare risk-adjusted returns across asset classes. Over the last ten years, high yield bonds have had the second highest risk-adjusted returns, trailing only below- investment grade bank loans (Fig. 2). Consequently, we believe that investors have been fairly compensated for the additional performance risk when moving to below investment grade credits.
High yield has generated leading risk-adjusted returns
(Fig. 2)
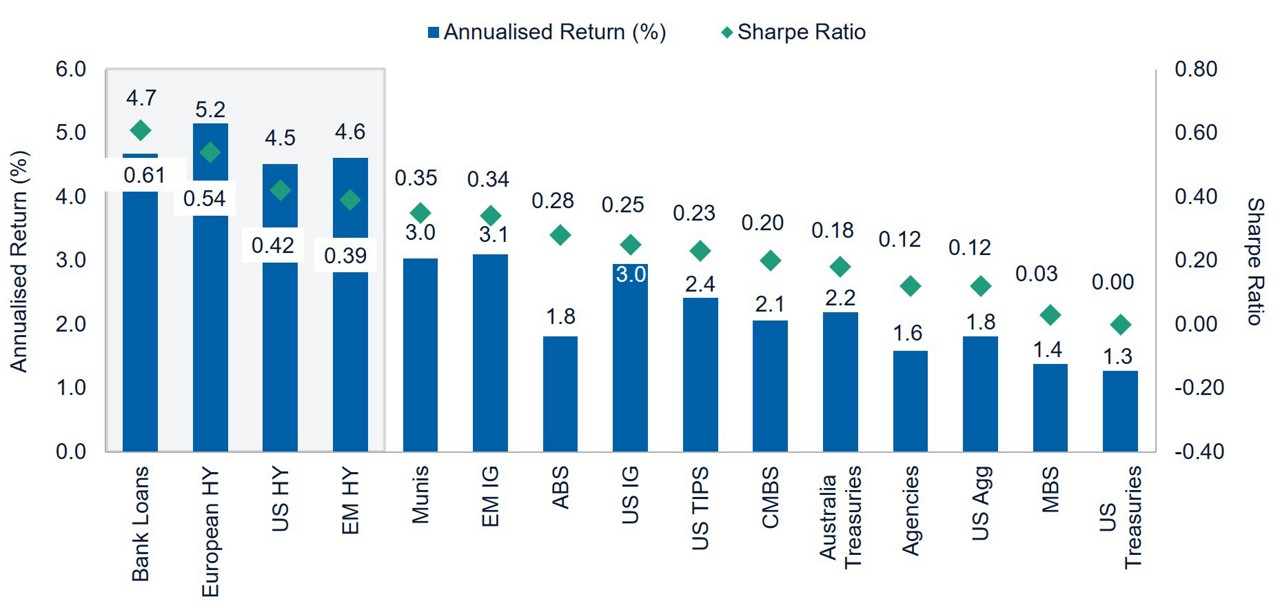
From 31 December 2013 to 31 December 2023.
Past performance is not a reliable indicator of future performance.
Sources: ICE BofA, Bloomberg Finance L.P. J.P. Morgan Chase and Morningstar Direct. Bank Loans: Morningstar LSTA Performing Loan Index; European HY: ICE BofA European Currency High Yield Constrained Excluding Subordinated Financials Index Hedged to USD; US HY: ICE BofA US High Yield Index; EM HY: J.P. Morgan Corporate Emerging Market Bond Index Broad Diversified High Yield; Munis: Bloomberg Municipal Bond Index; EM IG: J.P. Morgan Corporate Emerging Market Bond Index Broad Diversified Investment Grade; ABS: Bloomberg Asset Backed Securities Index; US IG: Bloomberg U.S. Corporate Investment Grade Bond Index; US TIPS: Bloomberg U.S. TIPS Index; CMBS: Bloomberg CMBS ERISA-Eligible Index; US Agg: Bloomberg U.S. Aggregate Bond Index; Agencies: Bloomberg U.S. Agency Bond Index; MBS: Bloomberg U.S. Mortgage Backed Securities Index; US Treasuries: Bloomberg U.S. Treasury Bond Index; Australia Treasuries: Bloomberg Australia Aggregate 300mn: Treasury USD Hedged; Risk Free Rate (for Sharpe Ratio): FTSE 3-Month Treasury Bill. Please refer to Additional Disclosure for further source information
Low default rate profile
Although the macro backdrop remains challenging for risk assets, high yield fundamentals continue to be resilient. Since the Global Financial Crisis (GFC), high yield market new issuance has been dominated by refinancings as issuers capitalised on historically low interest rates. Additionally, record capital markets activity in 2020 and 2021 (post-COVID drawdown) at cheap financing rates strengthened balance sheet liquidity and increased interest coverage metrics to peak levels. The high yield default rate marginally increased to 2.08% in December 2023 from 1.6% in June 2023 but remains well below its long-term average of 3% (Fig. 3).
High yield market default rates
(Fig. 3)
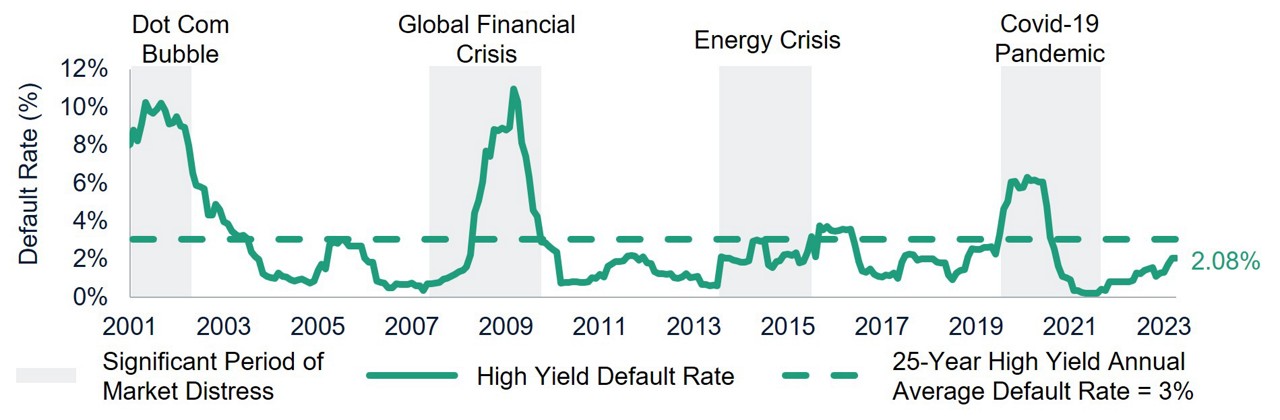
As of 31 December 2023.
Source: J.P. Morgan Chase & Co. US Default Rate, Based on Par Amount. Please refer to Additional Disclosure for further source information.
Why High Yield Bonds Now?
Evolution to a higher credit quality market
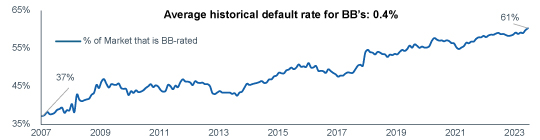
The current high yield market is drastically improved compared to the GFC in terms of credit quality. Using the Credit Suisse High Yield Index as a proxy, the high yield market has migrated up considerably in credit quality since the GFC. In 2007, only 37% of the index had at least one BB rating, today that figure is roughly 60% (Fig. 4). Partially the result of record Fallen Angel volume (US$240 billion) entering high yield in 2020, the average company in the high yield market has a larger market cap and generates more free cash flow today than prior to the GFC. Therefore, we feel the asset class is in a position of strength should the economic outlook weaken.
High yield market ratings quality “migrates up”
(Fig. 4)
As of 31 December 2023.
Source: Credit Suisse. High Yield Market is represented by the Credit Suisse High Yield Index. Please refer to Additional Disclosure for further source information.
The credit ratings are based on S&P and Moody’s ratings. A rating of “BB” represents the highest-rated high yield rating.
Today’s yields have rarely been
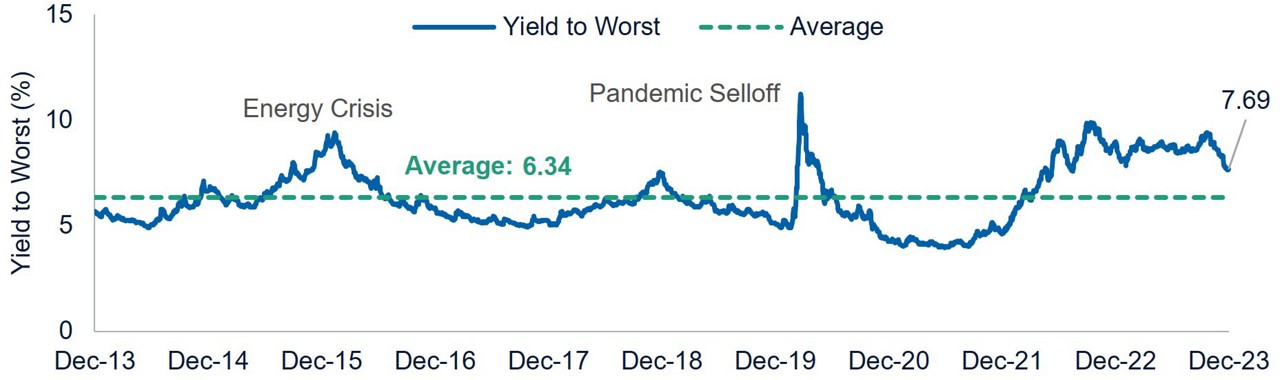
Rate and credit spread volatility since the first quarter of 2022 have resulted in attractive yields and dollar discounts not seen since the GFC attributed to unprecedented quantitative tightening and related recession fears. As of 31 December 2023, the yield to worst on the ICE BofA Global High Yield Index was almost 8%. This is well above the average level of 6.34% observed over the last ten years (Fig. 5). Considering the credit quality of the market is much higher today, the absolute yield on the asset class screens attractive, especially compared to similar dislocation levels during the Energy Crisis (2015-2016) and the Pandemic selloff where both the quality and fundamentals of the market were lower than levels observed today.
Yield to worst of the global high yield market
(Fig. 5)
From 31 December 2013 to 31 December 2023.
Past performance is not a reliable indicator of future performance.
Source: Bank of America.
Global High Yield Market represented by the ICE BofA Global High Yield Index.
Yields indicate attractive valuation
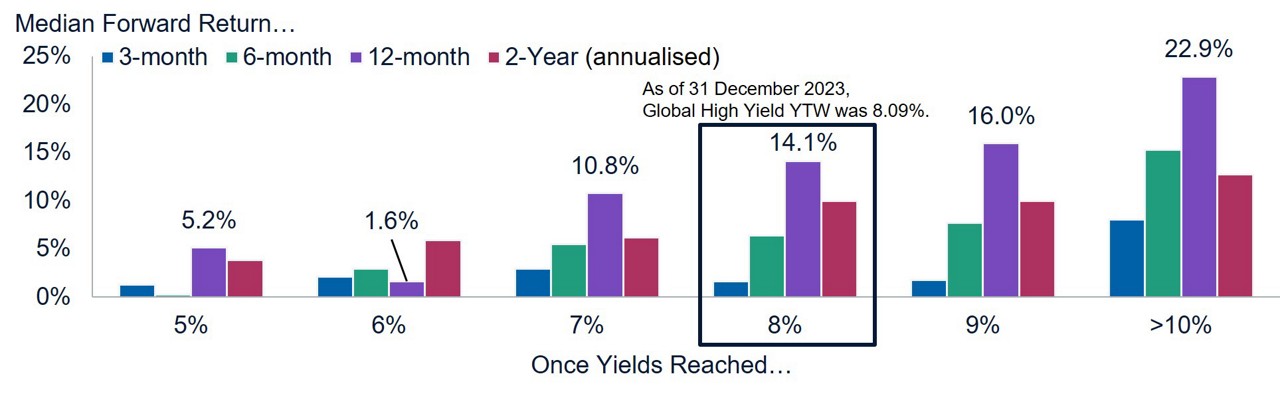
While we cannot predict future returns from current yields, we can use history as a baseline for when the high yield market had similar yield levels and what forward returns looked like. Since the GFC, the high yield market has crossed the 9% yield threshold five times. In each instance, the one year forward return picture has been in the mid-double digits range (Fig. 6). Since 2012, the median 12-month forward returns have been in double digits when yields in the market have exceeded 8%.
Historical global high yield returns once yields reached various thresholds
(Fig. 6)
From 1 January 2012 to 31 December 2023.
Past performance is not a reliable indicator of future performance.
Returns since 1 January 2012. Performance periods shown once index yields moved through the yield threshold and had not been at that level for the preceding 30 business days.
Global High Yield Market represented by the JP Morgan Global High Yield Index.
Source: JP Morgan Chase. Please refer to Additional Disclosure for further source information.
IMPORTANT INFORMATION
This material is being furnished for general informational and/or marketing purposes only. The material does not constitute or undertake to give advice of any nature, including fiduciary investment advice, nor is it intended to serve as the primary basis for an investment decision. Prospective investors are recommended to seek independent legal, financial and tax advice before making any investment decision. T. Rowe Price group of companies including T. Rowe Price Associates, Inc. and/or its affiliates receive revenue from T. Rowe Price investment products and services. Past performance is not a reliable indicator of future performance. The value of an investment and any income from it can go down as well as up. Investors may get back less than the amount invested.
The material does not constitute a distribution, an offer, an invitation, a personal or general recommendation or solicitation to sell or buy any securities in any jurisdiction or to conduct any particular investment activity. The material has not been reviewed by any regulatory authority in any jurisdiction.
Information and opinions presented have been obtained or derived from sources believed to be reliable and current; however, we cannot guarantee the sources' accuracy or completeness. There is no guarantee that any forecasts made will come to pass. The views contained herein are as of the date noted on the material and are subject to change without notice; these views may differ from those of other T. Rowe Price group companies and/or associates. Under no circumstances should the material, in whole or in part, be copied or redistributed without consent from T. Rowe Price.
The material is not intended for use by persons in jurisdictions which prohibit or restrict the distribution of the material and in certain countries the material is provided upon specific request.
It is not intended for distribution to retail investors in any jurisdiction.
26 February 2024 / INVESTMENT INSIGHTS

Mike Della Vedova is a global high yield portfolio manager in the Fixed Income Division. He is a portfolio manager for the Europe High Yield Bond Strategy and co-portfolio manager for the Global High Yield Bond and Global High Income Bond Strategies. He is a vice president of T. Rowe Price Group, Inc., and T. Rowe Price International Ltd.

Joran Laird is a global fixed income portfolio specialist covering APAC.