December 2023 / GLOBAL MARKET OUTLOOK
China: Time to revisit an unloved asset class
Key Insights
- We believe China’s muted post-COVID reopening recovery is largely cyclical in nature.
- Structural opportunities exist in a number of areas: industrial upgrading, rising consumption, and companies gaining market share via consolidation.
- We believe this downturn provides opportunities to own great Chinese businesses at attractive prices.

Chinese equities have been disappointing since early 2021, with the MSCI China Index more than halving. It has continued to underperform even as the country emerged from the pandemic late last year. Most other economies enjoyed a consumption boom following the post‑COVID reopening. However, this failed to materialize in China.
During the pandemic, the government balance sheets of many countries expanded substantially as they pushed through extensive support packages. The Chinese government, in contrast, did not provide any meaningful consumption stimulus. Instead, the country is going through a major financial deleveraging phase.
This is best reflected in China’s troubled property sector. The property supply chain contributes over 20% to China’s gross domestic product (GDP)1 . However, since the tightening process began in early 2021, property transaction volumes have declined 30%–40% from their peak and are back to levels last seen a decade ago. Property new starts have fallen 60% from the peak. This has been a major drag on the economy.
Performance
(Fig. 1) 12-month performance by region
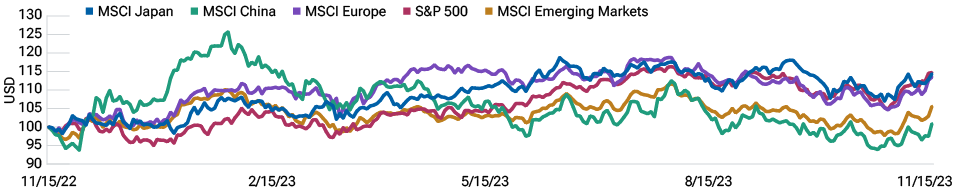
As of November 15, 2023. Past performance is not a reliable indicator of future performance. Performance is indexed to 100.
Sources: FactSet, MSCI. Total return in USD.
Deleveraging
(Fig. 2) The property sector remains depressed
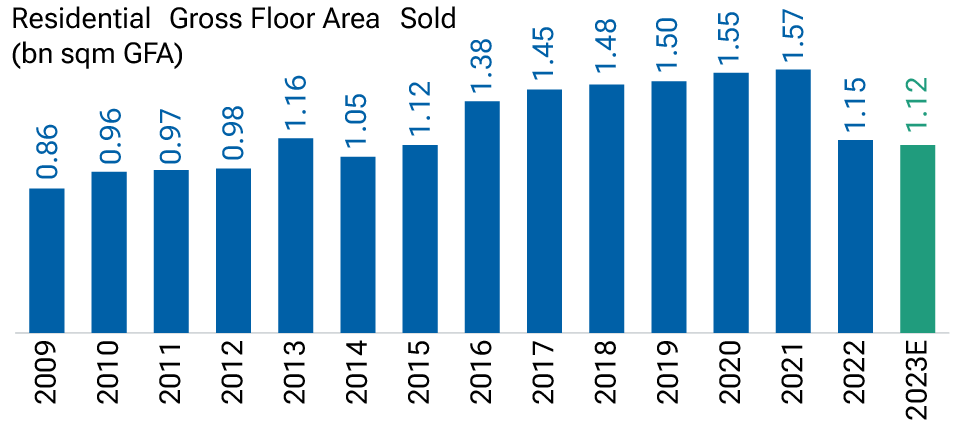
As of November 20, 2023. E=Estimated. Actual outcomes may differ materially from estimates.
Sources: Left-hand chart: Haver Analytics/China National Bureau of Statistics/Markit. Please see Additional Disclosures page for information about this Markit information. Right-hand chart: Haver Analytics/China National Bureau of Statistics.
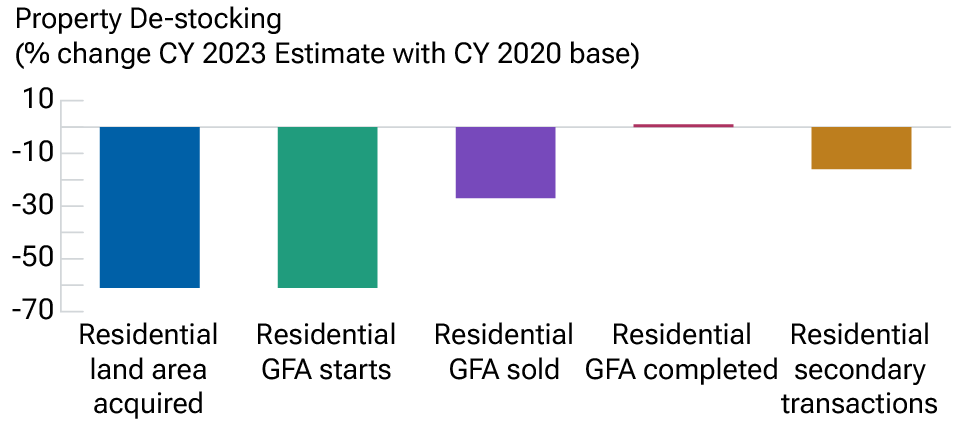
Exports, another growth engine for China during 2020–2022, have declined this year with the weaker global economic backdrop. There are also longer-term concerns resulting from the efforts of multinational corporations to diversify supply chains away from China. Since U.S.-China trade tensions started in 2018, China’s share of U.S. imports has come down from over 20% to below 15%. However, at a global level, China’s export share continued to increase as Chinese exporters made greater inroads into emerging markets.
China does undoubtedly face structural challenges, such as the high levels of leverage in the property sector and at local government level, ongoing geopolitical uncertainties, and demographic headwinds. However, to a large extent the current slowdown we are seeing is cyclical. This period is not unique from a historical perspective. Every three to four years, China has gone through mini economic cycles. The last time China experienced a large deleveraging cycle was in 2012–2015, which resulted in sharp declines in Chinese equities. This downcycle was followed by five years of strong market performance with the MSCI China Index gaining 160% during that period, outperforming major markets, including the S&P 5002 .
Structural and unique opportunities exist amid China’s economic transition
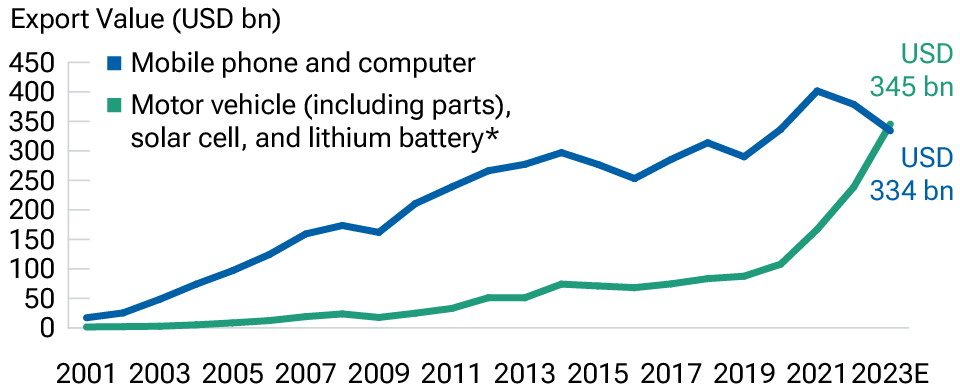
China is making rapid progress in manufacturing and moving up the value chain. China’s R&D (research & development) spending as a percentage of GDP is now higher than that of European Union countries. This has helped China achieve strong leadership positions in many fast‑emerging industries. China is well known for mobile phone and PC assembly. However, this year, China’s exports of autos and renewable energy are expected to overtake PCs and mobile phones.
Diversification
(Fig. 3) China gains export share outside the U.S.
As of June 30, 2023.
Sources: China Customs, NBS, Wind, Citi Research.
We have been here before
(Fig. 4) MSCI China Index vs. Li Keqiang Index (a mix of real economic activities in China)
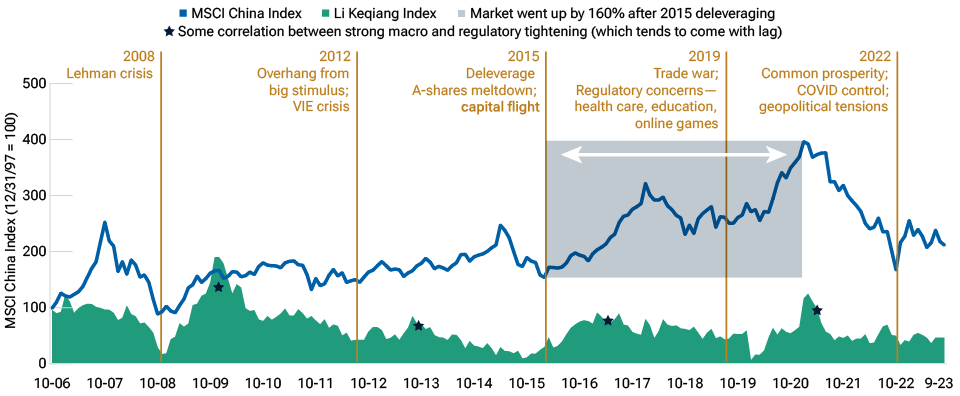
As of September 29, 2023. Past performance is not a reliable indicator of future performance.
VIE = variable interest entities.
Sources: Bloomberg Finance L.P., MSCI. Please see Additional Disclosures page for more information about this MSCI information.
China is widely expected to become the No.1 auto exporter globally in 2023. This is a huge turnaround as only three to four years ago Chinese auto original equipment manufacturers were struggling for success in their own domestic market. The EV (electric vehicle) transformation has changed the dynamic, turning Chinese automakers’ weakness in internal combustion engines into a strength in battery powertrains. This transformation doesn’t stop at autos. We have seen similar patterns playing out in construction machinery and outdoor power equipment, where Chinese firms are gaining market share on the back of electrification.
The trend toward supply chain diversification and realignment does create challenges for many Chinese industries, especially those that are highly dependent on U.S. demand or U.S. technology. However, in many emerging industries, including green tech, biotech, and mobile internet, Chinese firms have established both scale and technological leadership. While they may face uncertainties in certain developed markets, we think that their global competitiveness and footprint will continue to rise.
A byproduct of supply chain realignment is local substitution, where we have seen meaningful acceleration. China is the largest market for many products. It accounts for 60% of global demand for industrial robots, for example, and 30%–40% of analog semiconductor demand.3 Those markets used to be highly dependent on foreign suppliers. However, local leaders are now emerging and quickly narrowing the gap versus their foreign peers.
Areas of opportunity: industrial upgrade
(Fig. 5) Increased R&D spending has raised China’s competitiveness
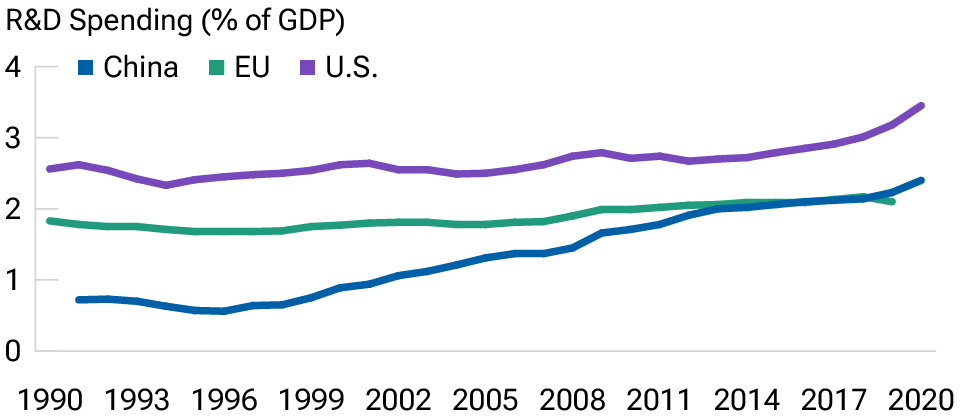
As of June 30, 2023.
* Solar cell data are not available before 2012, and lithium battery data are not available before 2020.
Sources: General Administration of Customs, Morgan Stanley Research Estimates (E).
Areas of opportunity
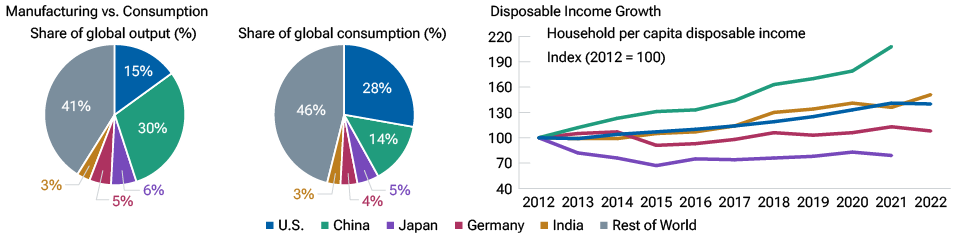
(Fig. 6) From exports to consumption
As of September 30, 2023.
Sources: World Bank, NBS, BEA, CAO, Deutsche Bundesbank, Ministry of Statistics and Programme Implementation (India), Haver Analytics, CEIC.
In many traditional industries, we’ve seen better capex discipline and industry consolidation. China has a reputation for exporting overcapacity. This may still be true for some emerging industries, but in more mature sectors, things have changed. Since the supply side reforms in 2016, capex investment in areas like coal, steel, LCD panels, beer, etc., has come down substantially, leading to improving returns and profitability for those industries. These businesses are entering into what we term the “harvest stage,” where the investment phase has passed and margins and cash flows have rebounded strongly.
While China’s consumption recovery post‑COVID is more muted than expected, the structural trend is not broken, but rather remains intact. Chinese consumers’ purchasing power has been rising. The per capita household income has more than doubled over the past 10 years. Even in a relatively weak macro environment, household income grew 6.5% year-to-date (as of September 2023). Consumption contributed 95% of China’s GDP growth in the third quarter of 2023.
China generated 30% of global industrial output but only 14% of global consumption demand. China’s consumption-to-GDP ratio is only 38% versus 50%–70% for other major economies. The geopolitical tensions today might serve to accelerate China’s transition to a more consumption‑driven economy, which we believe will help generate more balanced trade relationships in the future.
Compelling opportunities from the downturn and market inefficiencies4
Despite the muted economic backdrop, investors should focus on finding businesses that can consistently increase their earnings power. These opportunities could be found, for example, in the technology and industrials sectors which leverage the industrial upgrade and green transition. In traditional industries, including shipbuilding, offshore oil service, copper, etc., we expect improving return on invested capital driven by favorable supply/demand dynamics.
We’d also encourage investors to distinguish the index-level performance from true return potential in Chinese equities. While the MSCI China Index hasn’t done much over the past 10 years, the top 20 A-share stocks with highest foreign ownership have outperformed the index by over significantly. China remains a highly inefficient market, with retail investors accounting for around 70% of trading volume. Their average holding period is approximately 16 days. This can lead to high velocity and ample mispricing opportunities.
Another disconnect for Chinese equities is between the opportunity set and investors’ asset allocation. China has over 6,000 stocks, but only around 1% are mega‑caps with a market cap of USD 30 billion plus. However, that 1% of stocks have a weighting of over 50% in the MSCI China Index. Mainstream China funds, on average, put over half of their assets under management into just 1% of stocks. The remaining 98%–99% of the China stock universe is arguably underexplored. We believe there are tremendous alpha opportunities beyond the well-discovered large-cap consensus names.
With Chinese equities in a third consecutive year of decline, it is a test of investors’ conviction and patience. However, the prolonged downturn provides the opportunity to own some great Chinese businesses at attractive prices. It is often said that the best investment opportunities occur during the most uncomfortable periods. We believe that we are currently in such a period for Chinese equites.
Additional Disclosure
Unless otherwise noted, numbers may not total due to rounding.
T. Rowe Price cautions that economic estimates and forward-looking statements are subject to numerous assumptions, risks, and uncertainties, which change over time. Actual outcomes could differ materially from those anticipated in estimates and forward-looking statements, and future results could differ materially from any historical performance. The information presented herein is shown for illustrative, informational purposes only. Forecasts are based on subjective estimates about market environments that may never occur. Any historical data used as a basis for this analysis are based on information gathered by T. Rowe Price and from third-party sources and have not been independently verified. Forward-looking statements speak only as of the date they are made, and T. Rowe Price assumes no duty to and does not undertake to update forward-looking statements.
MSCI and its affiliates and third party sources and providers (collectively, “MSCI”) makes no express or implied warranties or representations and shall have no liability whatsoever with respect to any MSCI data contained herein. The MSCI data may not be further redistributed or used as a basis for other indices or any securities or financial products. This report is not approved, reviewed, or produced by MSCI. Historical MSCI data and analysis should not be taken as an indication or guarantee of any future performance analysis, forecast or prediction. None of the MSCI data is intended to constitute investment advice or a recommendation to make (or refrain from making) any kind of investment decision and may not be relied on as such.
IMPORTANT INFORMATION
This material is being furnished for general informational and/or marketing purposes only. The material does not constitute or undertake to give advice of any nature, including fiduciary investment advice, nor is it intended to serve as the primary basis for an investment decision. Prospective investors are recommended to seek independent legal, financial and tax advice before making any investment decision. T. Rowe Price group of companies including T. Rowe Price Associates, Inc. and/or its affiliates receive revenue from T. Rowe Price investment products and services. Past performance is not a reliable indicator of future performance. The value of an investment and any income from it can go down as well as up. Investors may get back less than the amount invested.
The material does not constitute a distribution, an offer, an invitation, a personal or general recommendation or solicitation to sell or buy any securities in any jurisdiction or to conduct any particular investment activity. The material has not been reviewed by any regulatory authority in any jurisdiction.
Information and opinions presented have been obtained or derived from sources believed to be reliable and current; however, we cannot guarantee the sources' accuracy or completeness. There is no guarantee that any forecasts made will come to pass. The views contained herein are as of the date noted on the material and are subject to change without notice; these views may differ from those of other T. Rowe Price group companies and/or associates. Under no circumstances should the material, in whole or in part, be copied or redistributed without consent from T. Rowe Price.
The material is not intended for use by persons in jurisdictions which prohibit or restrict the distribution of the material and in certain countries the material is provided upon specific request.
It is not intended for distribution to retail investors in any jurisdiction.
December 2023 / GLOBAL MARKET OUTLOOK

Wenli Zheng is the portfolio manager of the China Evolution Equity Strategy in the International Equity Division. He also co-manages the Greater China portfolio of the International Small-Cap Equity Strategy. Wenli is a vice president of T. Rowe Price Group, Inc., and T. Rowe Price Hong Kong Limited.