November 2023 / INVESTMENT INSIGHTS
As climate risks intensify, investment analysis must rise to the challenge
Addressing the challenge of integrating climate change dynamics into investment decision-making.
Any successful asset manager needs to identify and analyze large systemic changes and the corresponding risks and opportunities they could bring. These types of changes are often driven by technological advances and/or regulation. We believe climate change represents a large systemic change set to have a material impact on investment performance across geographies and asset classes. Given the complexity of climate change dynamics, blending them into investment decision‑making requires not just the capacity to derive the data and insights, but also the systems and processes to integrate them into the analysis.
At T. Rowe Price Associates, Inc., our approach combines fundamental analysis (by analysts and portfolio managers), thematic and topical research (by in-house environmental, social, and governance (ESG) specialist teams), and our proprietary Responsible Investing Indicator Model (RIIM) analysis—which includes an assessment of issuers’ net zero status. It also integrates appropriate stewardship measures that seek to align with clients’ investment objectives.
Given its materiality to investment performance, climate factors and their level of materiality are considered across our investment platform; however, the investment implications can vary depending on the client’s mandate. Most of our clients have given us a mandate to deliver financial performance—in these cases, consideration of climate factors is for the purpose of delivering better financial performance. This requires insights into how corporate and other issuers may perform under a variety of climate-related scenarios, ranging from adherence to evolving regulatory demands to their capacity to conduct business in a changing environment. More specifically, this might include how they plan an orderly transition to net zero or how they are preparing for a hotter world where physical adaptation of business activities becomes necessary.
At the other end of the spectrum, a small but growing number of clients have dual mandates that include specific sustainable objectives alongside financial performance. Their sustainable objectives might include meeting net zero or greenhouse gas (GHG) reduction targets, excluding securities linked to fossil fuel production, or voting decisions that are not predominantly driven by financial materiality. In these cases, the analysis of climate factors will be the same, but the strategy may take a different approach to stewardship and divestment.
In both cases, our analysis of climate factors is benchmarked against a 1.5°C net zero pathway. To achieve this, the base case scenario implies a 50% reduction in greenhouse gas emissions by 2030 and achieving net zero by 2050. The pathway to net zero also must be science-based, which means that offsets can only be used for hard-to-abate emissions.
The challenge of quantifying climate
For many years, we have discussed data availability as a notable headwind to analyzing climate change-related risks and opportunities. The bottom line is that data remain lagged and underreported but have been improving steadily. To evaluate an issuer’s climate change exposure, an investor needs a mix of quantitative and qualitative inputs. We believe that the Task Force on Climate-Related Financial Disclosures (TCFD) reporting standard captures the required information very comprehensively, which is why we have long advocated that our investee companies adopt this reporting standard. TCFD standards have now been absorbed by the new International Sustainability Standards Board that is gaining support from regulators around the world.
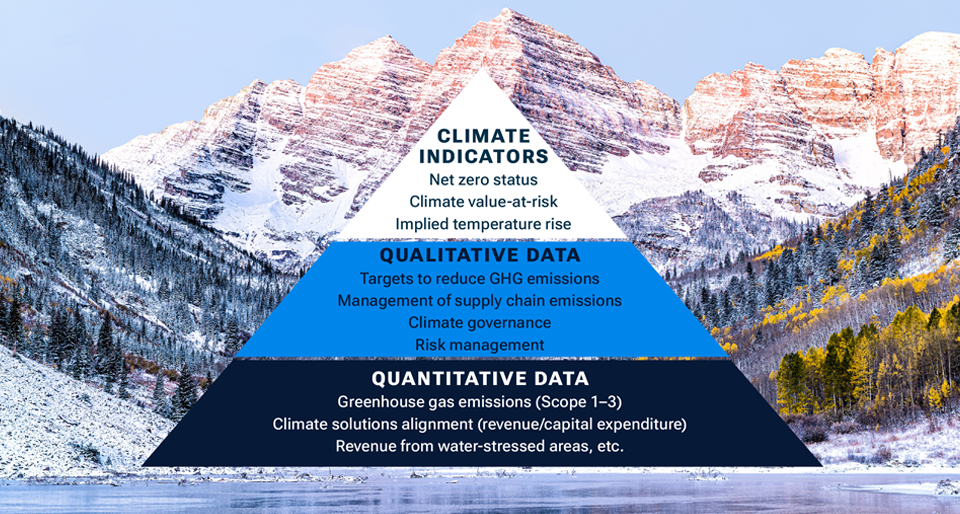
One of the most critical data inputs for climate analysis is the greenhouse gas emissions footprint of an issuer. While other data inputs are also very relevant and important, we believe that most investors view reporting of Scope 1–3 greenhouse gas emissions as the base of the climate analysis pyramid (see Chart 1). As the reporting of climate scenario metrics across portfolios is starting to become more common, we feel it is important that the end investor (i.e., our clients) understands the robustness of the underlying data. As such, we have provided a snapshot of greenhouse gas emissions data availability for the MSCI World Index, a developed market benchmark that spans geographies.
Climate analysis pyramid
(Chart 1)
Scope 1 and 2 represent the direct GHG emissions of a company. Reporting of these emissions is pretty good for the companies within the MSCI World Index. For 2021, 85% of MSCI World Index constituents reported Scope 1 and 2 greenhouse gas emissions (compared with 52% five years prior). Furthermore, high emitters are more likely to report, as 94% of the MSCI World Index’s constituents’ aggregate emissions were reported in 2021. The drop seen in reported emissions in 2022 (see Chart 2) is a function of companies having not yet reported their year-end 2022 data. With more and more regulators starting to require greenhouse gas emissions disclosure, we expect to see continued improvement in the number of companies reporting, as well as in the timeliness of reporting.
MSCI World Index total GHG
(Chart 2) Emissions—Scope 1–2
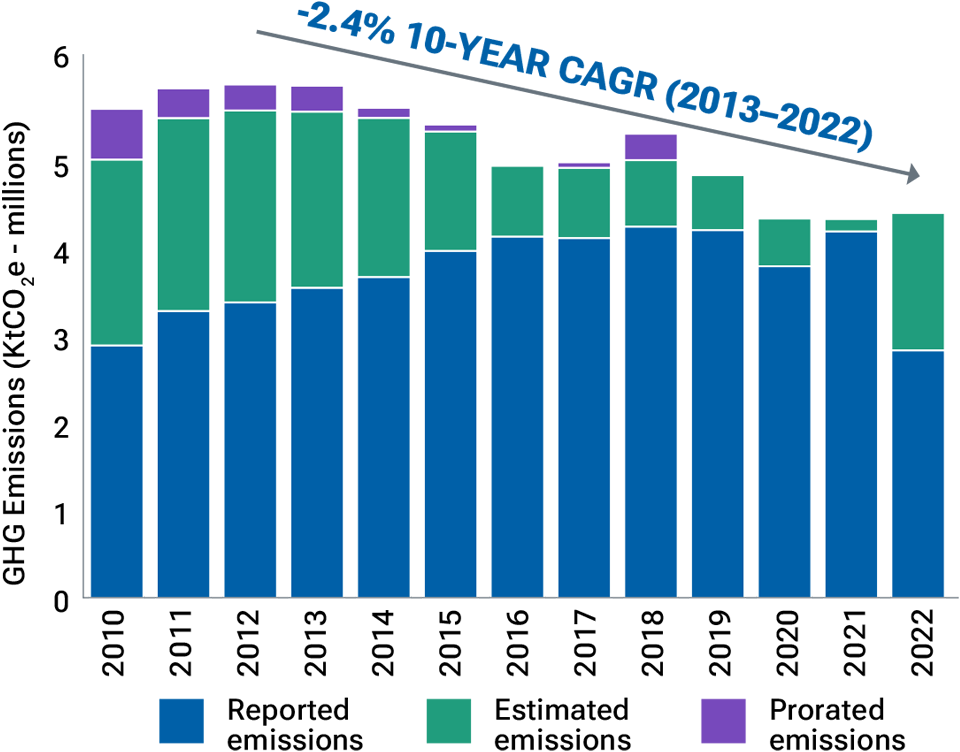
Source: Bloomberg Finance L.P. (time series includes current constituents of MSCI World Index). As of December 31, 2022. Investors cannot invest directly in an index. Please see Additional Disclosure for information about this MSCI index.
MSCI World Index total GHG
(Chart 3) Emissions vs. GHG intensity—Scope 1–2
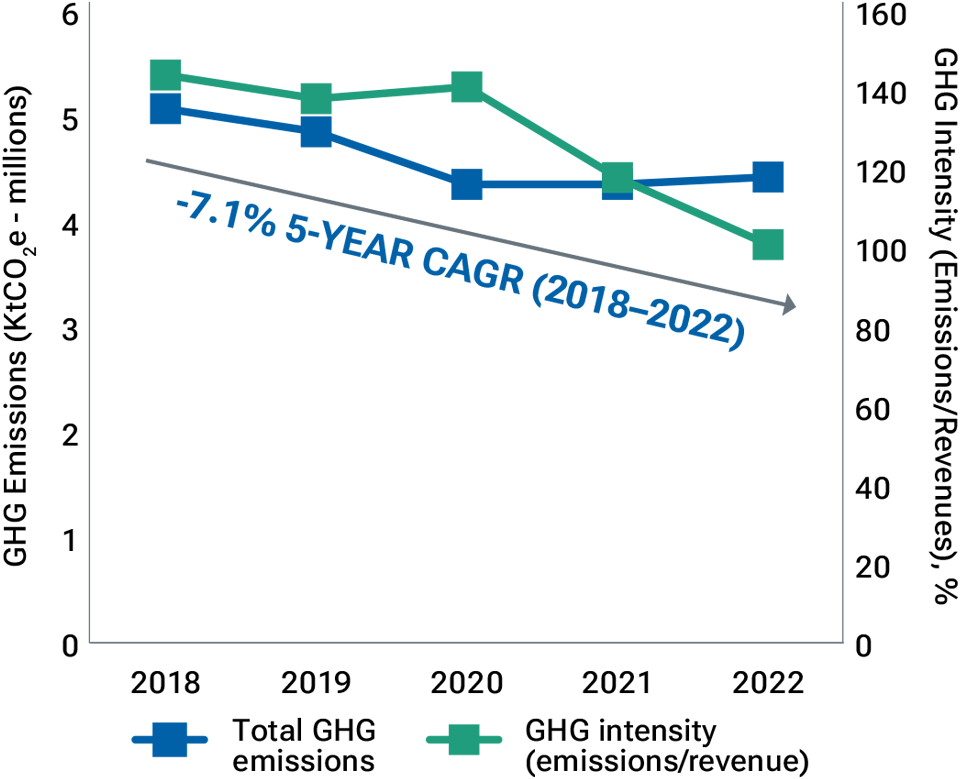
Source: Bloomberg Finance L.P. (time series includes current constituents of MSCI World Index). As of December 31, 2022. Investors cannot invest directly in an index. Please see Additional Disclosure for information about this MSCI index.
Chart 2 illustrates the aggregated GHG emissions of the current constituents of the MSCI World Index (there is no adjustment for benchmark weight). Over the past 10 years, absolute aggregated Scope 1 and 2 emissions have fallen by 2.4% CAGR,1 well short of the 7% per annum decline required to be in line with a 1.5°C pathway. However, when evaluating the MSCI World Index on an intensity basis2 using a weighted average approach, we see a decline of 7.1% CAGR over the past five years (Chart 3).
The data picture is very different when it comes to Scope 3 emissions. As these are the emissions that are not under the company’s direct control, they are more complex to measure and comprise 15 different categories—not all of which will be material to a particular issuer. Measurement typically relies on estimating standards and tools developed by organizations such as the Greenhouse Gas Protocol. These standards guide companies to put the most effort into accurately estimating the Scope 3 categories that are most relevant for their business and to use broader estimates for the other categories.3 Our own analysis takes a similar approach, and where there are enough data to analyze Scope 3 emissions, we focus on the data for the specific emissions categories deemed most relevant for each industry. Chart 4 illustrates the various categories, with the darker shading representing the categories deemed most material for each industry.
Scope 1–3 emissions materiality assessment by sector
(Chart 4)
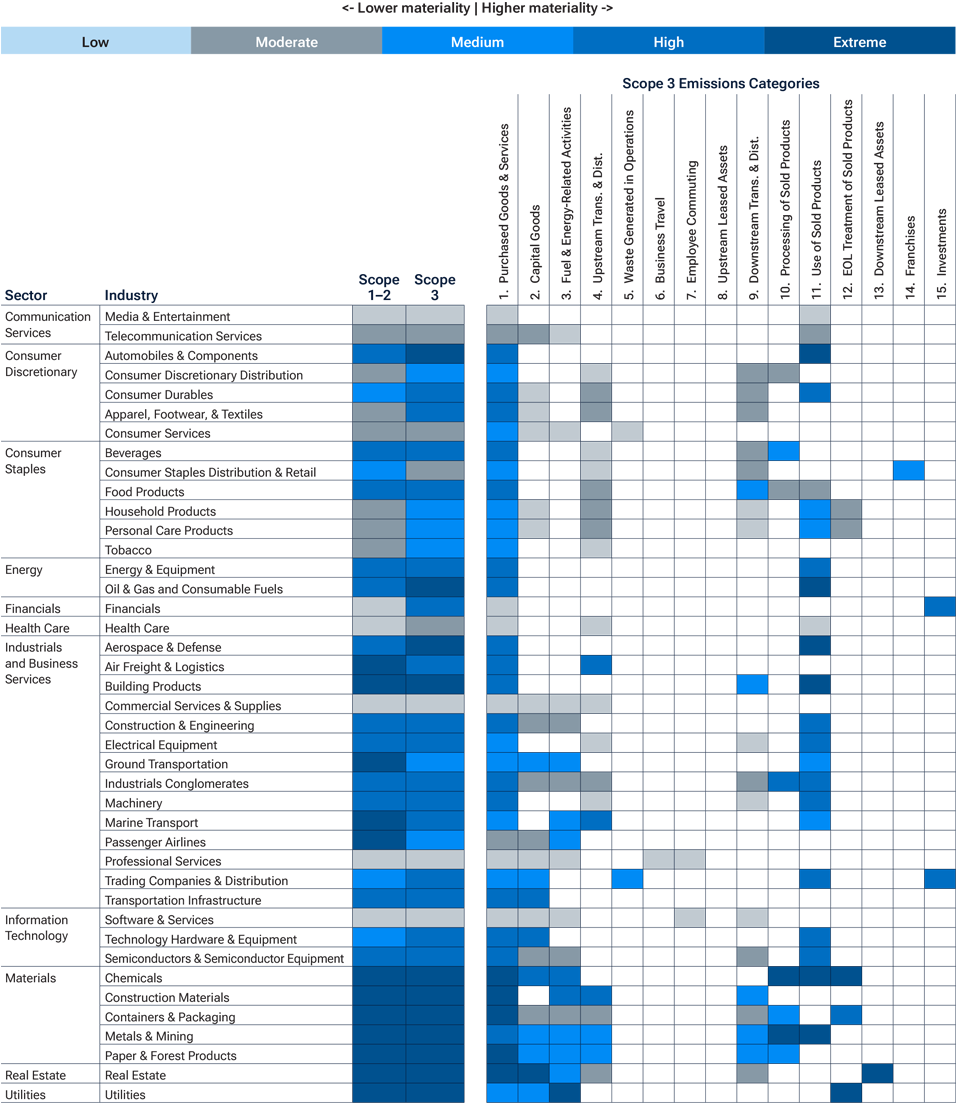
Analysis by T. Rowe Price as at March 2023. For illustrative purposes only.
Percent of companies in MSCI World Index reporting Scope 3 emissions by source
(Chart 5)
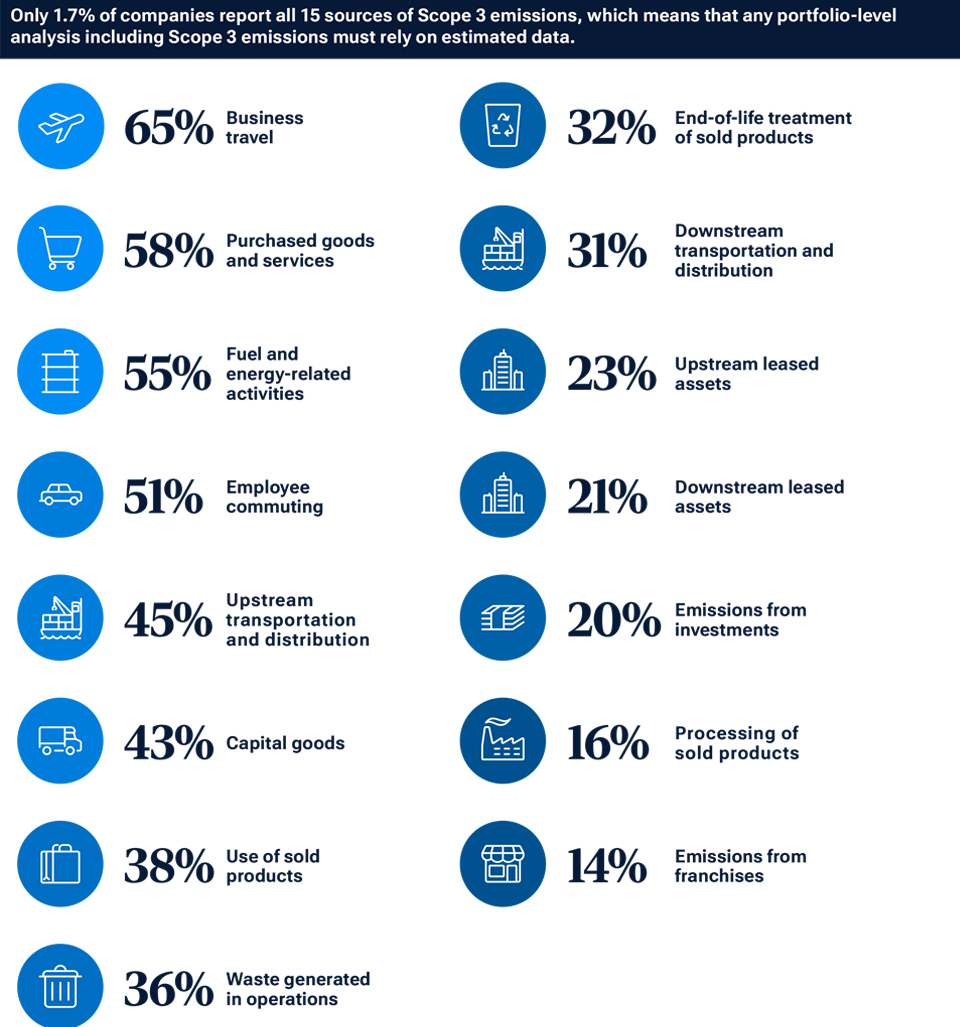
Source: Bloomberg Finance L.P. Data reflect MSCI World Index constituents’ emissions for 2021. Investors cannot invest directly in an index. Please see Additional Disclosure for information about this MSCI index.
Criteria for issuer net zero targets
(Chart 6)
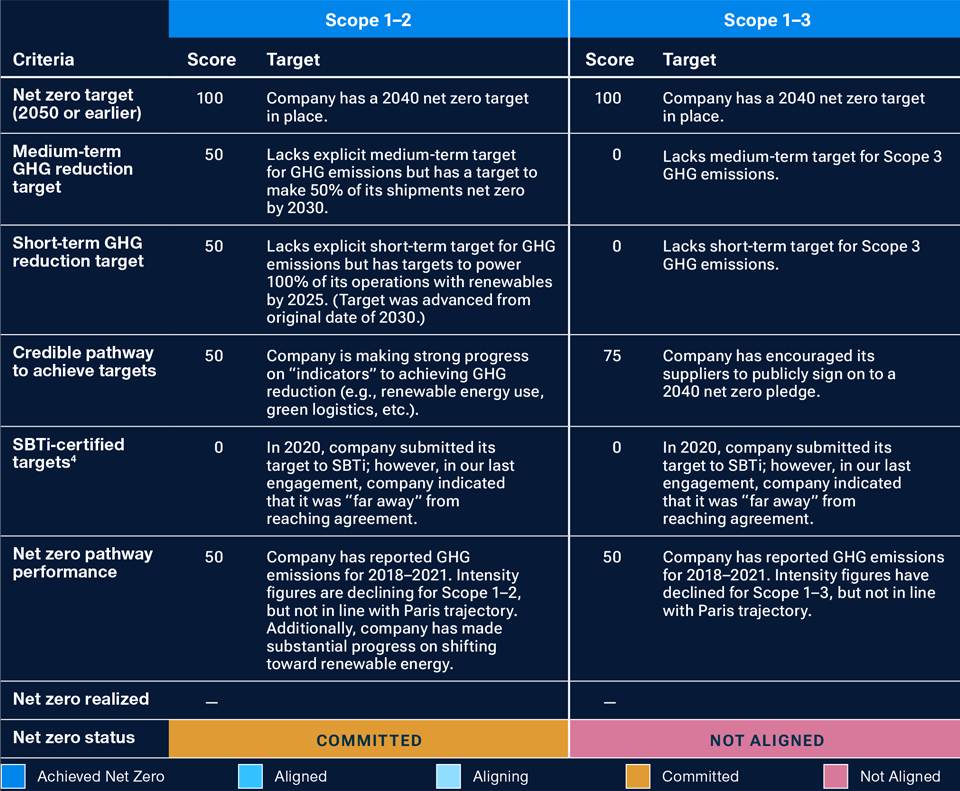
Proprietary net zero analysis as of March 2023. The T. Rowe Price Associates Responsible Investing team uses an internal scoring system in 25‑point increments from 0 to 100, with 0 being the worst and 100 being the best. For illustrative purposes only.
Evaluating net zero pathways
In assessing a company’s net zero status, we view best practice as adopting a science-based net zero target, aligned to a 1.5°C pathway that covers Scope 1–2 and the most relevant Scope 3 emissions. If a company has these targets validated by the Science Based Targets initiative (SBTi),4 it gives us confidence that it is adequately addressing its material emissions—not simply relying on carbon offsets (balancing actual emissions by investing in projects that reduce or store carbon elsewhere) when emissions should, in fact, be mitigated.
Our net zero analysis goes beyond simply identifying whether a company has a net zero target in place; it also includes a company’s short- and medium-term GHG reduction targets and a view on the credibility of its emissions trajectory. It is underpinned by the principles established by the Paris Aligned Investment Initiative Net Zero Framework. The range of targets and pathway factors we look to quantify are illustrated in Chart 6. According to our scoring system, the company in this illustration is assessed as being “committed” in its journey toward net zero for Scope 1–2, but is “not aligned” when taking into consideration Scope 3 emissions. Higher gradings are possible depending on the extent to which a company has either achieved net zero or the degree to which its emissions targets are aligned to that objective.
Our analysis culminates in a net zero profile for each issuer, providing essential climate information for our investment analysts and portfolio managers to evaluate. A sample profile and data inputs are illustrated in Chart 7.
Illustrative net zero profile and data inputs
(Chart 7)
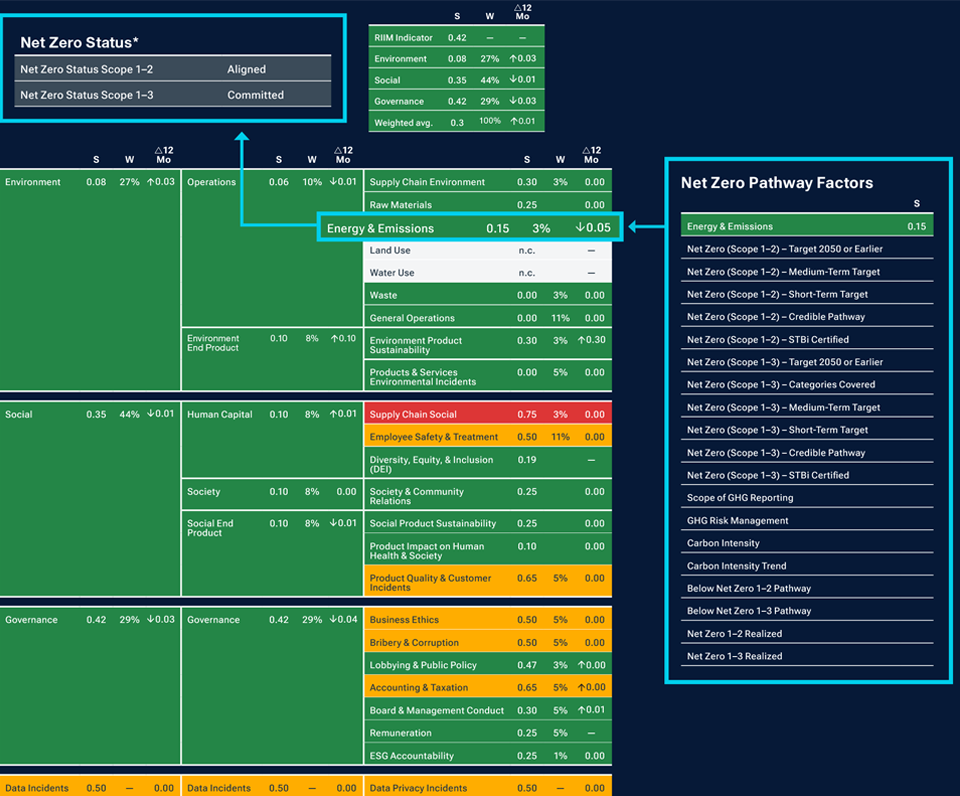
Source: T. Rowe Price as at March 2023. For illustrative purposes only. Green indicates no/few flags, orange indicates medium flags, and red indicates
high flags.
S=Score; W=Weight; Δ12 Mo=12-Month change.
*Scope 1 (direct emissions from owned or controlled sources); Scope 2
(indirect emissions from the generation of purchased electricity, steam,
or cooling); Scope 3 (all other indirect emissions).
Conclusion
Ultimately, the imperative to embed analysis of climate-related data into investment decision-making continues to intensify. The systemic challenge posed by climate change means that we need to understand and evaluate the financial risks and opportunities it creates for the issuers we may invest in on behalf of our clients. For some clients, the requirement goes beyond the need to achieve financial performance, as they target distinct sustainability objectives that govern how we construct and manage their portfolio. And while the challenges around climate data are not insignificant, the good news is that there is progress, and our platform has robust systems and processes in place to accommodate it.
Additional Disclosure
MSCI MSCI and its affiliates and third party sources and providers (collectively, “MSCI”) makes no express or implied warranties or representations and shall have no liability whatsoever with respect to any MSCI data contained herein. The MSCI data may not be further redistributed or used as a basis for other indices or any securities or financial products. This report is not approved, reviewed, or produced by MSCI. Historical MSCI data and analysis should not be taken as an indication or guarantee of any future performance analysis, forecast or prediction. None of the MSCI data is intended to constitute investment advice or a recommendation to make (or refrain from making) any kind of investment decision and may not be relied on as such.
IMPORTANT INFORMATION
This material is being furnished for general informational and/or marketing purposes only. The material does not constitute or undertake to give advice of any nature, including fiduciary investment advice, nor is it intended to serve as the primary basis for an investment decision. Prospective investors are recommended to seek independent legal, financial and tax advice before making any investment decision. T. Rowe Price group of companies including T. Rowe Price Associates, Inc. and/or its affiliates receive revenue from T. Rowe Price investment products and services. Past performance is not a reliable indicator of future performance. The value of an investment and any income from it can go down as well as up. Investors may get back less than the amount invested.
The material does not constitute a distribution, an offer, an invitation, a personal or general recommendation or solicitation to sell or buy any securities in any jurisdiction or to conduct any particular investment activity. The material has not been reviewed by any regulatory authority in any jurisdiction.
Information and opinions presented have been obtained or derived from sources believed to be reliable and current; however, we cannot guarantee the sources' accuracy or completeness. There is no guarantee that any forecasts made will come to pass. The views contained herein are as of the date noted on the material and are subject to change without notice; these views may differ from those of other T. Rowe Price group companies and/or associates. Under no circumstances should the material, in whole or in part, be copied or redistributed without consent from T. Rowe Price.
The material is not intended for use by persons in jurisdictions which prohibit or restrict the distribution of the material and in certain countries the material is provided upon specific request.
It is not intended for distribution to retail investors in any jurisdiction.
November 2023 / GLOBAL FIXED INCOME

Maria Elena Drew is a director of research for Responsible Investing at T. Rowe Price. In her current role she leads the Responsible Investing team, which serves as specialists for incorporating environmental and social considerations into the firm’s research process. Maria is on the Investment Advisory Committees of the Emerging Europe Equity, Emerging Markets Discovery Equity, Global Growth Equity, Global Value Equity, International Value Equity, Latin American Equity, and Asia ex-Japan Equity Strategies. In addition, she is a vice president of T. Rowe Price Group, Inc., T. Rowe Price International Ltd, and T. Rowe Price Global Funds.