October 2023 / RETIREMENT INSIGHTS
Active Management Has Benefited Our Target Date Funds
Discipline has brought long‑term rewards for clients.
Key Insights
- T. Rowe Price examined 11 of our U.S. Retirement Funds (RFs) with at least 10‑year records to quantify the value added by our active management approach.1
- On average, the 11 funds outperformed their benchmarks in 96% of rolling five‑year periods and in every rolling 10‑year period since inception, net of fees.
- T. Rowe Price seeks to add value for clients at multiple levels, including glide path design, long‑term diversification, and our active management approach.
- We believe our active management approach―including tactical allocation and active management of the underlying strategies―can enhance retirement outcomes.
To demonstrate that T. Rowe Price’s target date investment process historically has created value for our clients, we conducted a rigorous study of the performance of all of our RFs that had at least 10‑year track records as of December 31, 2022 (Figure 1). These 11 RFs held nearly all (approximately 96%) of the RF assets managed by the firm as of that date.2
(Fig. 1) Retirement Funds Included in Our Performance Study
| Fund | Inception Date |
|---|---|
| Retirement 2005 Fund | 2/27/2004 |
| Retirement 2010 Fund | 9/30/2002 |
| Retirement 2015 Fund | 2/27/2004 |
| Retirement 2020 Fund | 9/30/2002 |
| Retirement 2025 Fund | 2/27/2004 |
| Retirement 2030 Fund | 9/30/2002 |
| Retirement 2035 Fund | 2/27/2004 |
| Retirement 2040 Fund | 9/30/2002 |
| Retirement 2045 Fund | 5/31/2005 |
| Retirement 2050 Fund | 12/29/2006 |
| Retirement 2055 Fund | 12/29/2006 |
Source: T. Rowe Price.
We examined fund performance at three different levels to quantify the following:
- The value added by T. Rowe Price’s tactical allocation process. Returns were calculated using each underlying fund’s style-specific benchmark.3
- The value added by security selection. Excess returns—net of fees and other costs—were calculated for the underlying funds in each RF relative to each underlying fund’s style benchmark. These fund‑level returns were then aggregated to show the total excess returns achieved by each RF.
- The total value added by T. Rowe Price’s implementation. RF returns were compared with a family of target date indexes created by Standard & Poor’s, which reflect “consensus” strategic asset allocations and glide paths for the industry as a whole based on an annual survey of reported portfolio holdings.
For each level of fund performance, two measures were calculated:
- Active success rates: The percentage of total rolling periods in which the RF added value at the performance level being measured.
- Excess returns: The value added by each RF at the performance level being measured. Excess returns were calculated for each rolling period and then averaged across all the periods in each time frame.
T. Rowe Price believes strongly that longer time horizons provide the most meaningful measures of target date implementation, as they smooth out the effects of shorter‑term factors that can produce a distorted picture of relative performance. Accordingly, our analysis focused primarily on performance over rolling 5- and 10‑year periods, rolled monthly.4
To provide a summary of the effectiveness of T. Rowe Price’s target date process, we also calculated performance averages for all 11 RFs across all three levels of our analysis (total value added, tactical allocation, and security selection). To account for the differing longevity of each RF, these averages were time weighted—the results are based on the percentage of the total performance periods in each time frame provided by each RF.
Study Results
(Fig. 2 and Fig. 3) Time‑Weighted Average Active Success Rates for T. Rowe Price Retirement Funds
Fund Inceptions Through December 31, 2022

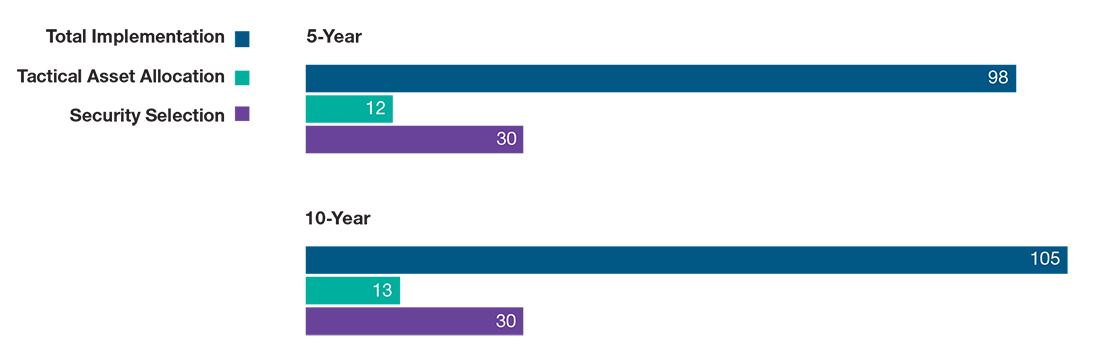
Time‑Weighted Average Annualized Value Added (in Basis Points) for T. Rowe Price Retirement Funds
Fund Inceptions Through December 31, 2022
Fund Inceptions Through December 31, 2022
Sources: Standard & Poor’s, Russell, MSCI, Bloomberg Index Services Limited,
J.P. Morgan, Credit Suisse (see Additional Disclosures), and T. Rowe Price.
Data analysis by T. Rowe Price.
Note that past performance data throughout this material are not reliable indicators of future performance.
By and large, the time‑weighted averages reflect the same results as for the individual Retirement Funds: The total value added by T. Rowe Price’s implementation and the contributions made by tactical asset allocation and security selection were all positive and relatively stable across different time periods (Figures 2 and 3).
Individual performance results for the 11 RFs in our study also were strongly positive across both 5‑ and 10‑year time frames:
- Tactical asset allocation: The performance contribution from tactical allocation was positive in 100% of rolling 10-year periods for all 11 RFs. Active success rates were strongly positive across five‑year rolling periods (averaging 84%). Value added was positive across all time frames (Figure 4).
- Security selection: Active success rates were positive in 84% or more of all rolling 10-year periods for nine of the 11 RFs and strongly positive (averaging 81%) across five‑year rolling periods. Excess returns were positive across all time frames for all RFs (Figure 5).
- Total implementation: Active success rates were positive in 100% of rolling 10-year periods for every RF and averaged 96% across five‑year rolling time periods. Annualized excess returns were consistently positive across all time frames for all RFs (Figure 6).
(Fig. 4) Active Success Rates and Average Value Added by Tactical Allocation
Active Success Rates
| Rolling Periods | ||
|---|---|---|
| Fund | 5‑Year | 10‑Year |
| Retirement 2005 Fund | 83% | 100% |
| Retirement 2010 Fund | 87 | 100 |
| Retirement 2015 Fund | 87 | 100 |
| Retirement 2020 Fund | 85 | 100 |
| Retirement 2025 Fund | 85 | 100 |
| Retirement 2030 Fund | 87 | 100 |
| Retirement 2035 Fund | 84 | 100 |
| Retirement 2040 Fund | 86 | 100 |
| Retirement 2045 Fund | 82 | 100 |
| Retirement 2050 Fund | 80 | 100 |
| Retirement 2055 Fund | 78 | 100 |
Source: T. Rowe Price.
Average Annualized Value Added (Basis Points)
| Rolling Periods | ||
|---|---|---|
| Fund | 5‑Year | 10‑Year |
| Retirement 2005 Fund | 14 | 15 |
| Retirement 2010 Fund | 16 | 16 |
| Retirement 2015 Fund | 15 | 15 |
| Retirement 2020 Fund | 16 | 16 |
| Retirement 2025 Fund | 13 | 14 |
| Retirement 2030 Fund | 14 | 14 |
| Retirement 2035 Fund | 10 | 12 |
| Retirement 2040 Fund | 10 | 11 |
| Retirement 2045 Fund | 8 | 9 |
| Retirement 2050 Fund | 8 | 8 |
| Retirement 2055 Fund | 7 | 7 |
Source: T. Rowe Price.
(Fig. 5) Active Success Rates and Average Value Added by Security Selection
Active Success Rates
| Rolling Periods | ||
|---|---|---|
| Fund | 5‑Year | 10‑Year |
| Retirement 2005 Fund | 49% | 64% |
| Retirement 2010 Fund | 53 | 73 |
| Retirement 2015 Fund | 73 | 84 |
| Retirement 2020 Fund | 80 | 91 |
| Retirement 2025 Fund | 90 | 93 |
| Retirement 2030 Fund | 88 | 94 |
| Retirement 2035 Fund | 92 | 93 |
| Retirement 2040 Fund | 90 | 94 |
| Retirement 2045 Fund | 93 | 91 |
| Retirement 2050 Fund | 92 | 89 |
| Retirement 2055 Fund | 92 | 89 |
Sources: Standard & Poor’s, Russell, MSCI, Bloomberg Index Services Limited, J.P. Morgan, Credit Suisse (see Additional Disclosures), and T. Rowe Price. Data analysis by T. Rowe Price.
Average Annualized Value Added (Basis Points)
| Rolling Periods | ||
|---|---|---|
| Fund | 5‑Year | 10‑Year |
| Retirement 2005 Fund | 12 | 10 |
| Retirement 2010 Fund | 11 | 13 |
| Retirement 2015 Fund | 19 | 18 |
| Retirement 2020 Fund | 23 | 26 |
| Retirement 2025 Fund | 32 | 31 |
| Retirement 2030 Fund | 34 | 37 |
| Retirement 2035 Fund | 42 | 42 |
| Retirement 2040 Fund | 40 | 43 |
| Retirement 2045 Fund | 43 | 43 |
| Retirement 2050 Fund | 39 | 39 |
| Retirement 2055 Fund | 39 | 39 |
Sources: Standard & Poor’s, Russell, MSCI, Bloomberg Index Services Limited, J.P. Morgan, Credit Suisse (see Additional Disclosures), and T. Rowe Price. Data analysis by T. Rowe Price.
(Fig. 6) Active Success Rates and Average Value Added by Total Implementation
Active Success Rates
| Rolling Periods | ||
|---|---|---|
| Fund | 5‑Year | 10‑Year |
| Retirement 2005 Fund | 97% | 100% |
| Retirement 2010 Fund | 93 | 100 |
| Retirement 2015 Fund | 95 | 100 |
| Retirement 2020 Fund | 93 | 100 |
| Retirement 2025 Fund | 94 | 100 |
| Retirement 2030 Fund | 95 | 100 |
| Retirement 2035 Fund | 98 | 100 |
| Retirement 2040 Fund | 97 | 100 |
| Retirement 2045 Fund | 100 | 100 |
| Retirement 2050 Fund | 100 | 100 |
| Retirement 2055 Fund | 99 | 100 |
Sources: Standard & Poor’s (see Additional Disclosures) and T. Rowe Price. Data analysis by T. Rowe Price.
Average Annualized Value Added (Basis Points)
| Rolling Periods | ||
|---|---|---|
| Fund | 5‑Year | 10‑Year |
| Retirement 2005 Fund | 112 | 120 |
| Retirement 2010 Fund | 93 | 101 |
| Retirement 2015 Fund | 91 | 98 |
| Retirement 2020 Fund | 99 | 107 |
| Retirement 2025 Fund | 100 | 108 |
| Retirement 2030 Fund | 105 | 114 |
| Retirement 2035 Fund | 105 | 112 |
| Retirement 2040 Fund | 100 | 109 |
| Retirement 2045 Fund | 106 | 103 |
| Retirement 2050 Fund | 89 | 88 |
| Retirement 2055 Fund | 61 | 65 |
Sources: Standard & Poor’s (see Additional Disclosures) and T. Rowe Price. Data analysis by T. Rowe Price.
Benefits for Investors
The excess returns historically achieved by T. Rowe Price’s Retirement Funds may seem modest compared with the absolute returns that investors typically have been able to achieve on diversified asset portfolios over longer periods. However, compounded over time, even a small improvement in returns can make a significant difference in ending portfolio values.
Take, for example, the experience of the T. Rowe Price Retirement 2030 Fund. From its inception on September 30, 2002, through December 31, 2022, the fund outperformed the S&P Target Date 2030 Index by 1.03 percentage points, annualized. If an investor had invested USD 100,000 in the Retirement 2030 Fund at inception, by the end of 2022 his or her portfolio could have been worth over USD 90,000 more than the same amount invested in a hypothetical portfolio that earned the same return as the S&P Target Date 2030 Index (Figure 7).
(Fig. 7) Example of the Benefits of T. Rowe Price’s Active Management Approach
Portfolio Growth Potential Relative to the S&P Target Date 2030 Index

September 30, 2002, Through December 31, 2022
Sources: Standard & Poor’s (see Additional Disclosures) and T. Rowe Price. Data analysis by T. Rowe Price
Current performance may be higher or lower than the quoted past performance, which cannot guarantee future results. Share price, principal value, and return will vary, and you may have a gain or loss when you sell your shares. Average annual total return figures include changes in principal value, reinvested dividends, and capital gain distributions. To obtain the most recent month‑end performance, please visit our website or contact a T. Rowe Price representative at 1‑800‑225‑5132.
A USD 90,000 difference in ending portfolio values could be significant for some retirement investors. In our example, the investor who invested in the Retirement 2030 Fund would be able to withdraw an additional USD 4,505 per year over a 20‑year retirement time horizon compared with the investor who invested in a hypothetical portfolio that tracked the performance of the S&P Target Date 2030 Index—assuming no further portfolio growth after retirement (Figure 8). For some retirees, that USD 4,505 difference could have a meaningful impact on living standards.
(Fig. 8) Potential Postretirement Annual Spending Amounts
Income From a USD 100,000 Investment*

September 30, 2002, Through December 31, 2022
*Assumes no further portfolio growth after retirement.
Sources: Standard & Poor’s (see Additional Disclosures) and T. Rowe Price. Data analysis by T. Rowe Price.
Our Approach to Active Management
T. Rowe Price’s target date process seeks to improve outcomes for our target date clients at multiple levels—via glide path design, long‑term diversification, tactical asset allocation, and our active management approach. We believe the value added by our target date implementation can meaningfully enhance retirement outcomes for investors.
Bottom‑up fundamental research is at the core of how we manage the underlying strategies in our target date funds. That means that over 550 of our investment professionals go out in the field to uncover opportunities. They study them firsthand. And use those insights to help give our clients an investment edge.5
Our target date managers, backed by our committee of asset allocation experts from across multi‑asset, equity, and fixed income, seek to get ahead of change by identifying attractive near‑term asset valuations and using prudent tactical allocation adjustments to take advantage of those potential opportunities.
Experience has been a critical component of our success as well. We’ve managed investments through all kinds of markets, and our professionals average 22 years in the industry and 17 years with T. Rowe Price.6 Significantly, many of our analysts go on to become portfolio managers, which we believe creates a strong foundation on behalf of our clients.

Additional Disclosures
“Bloomberg®,” the Bloomberg U.S. Aggregate Bond Index and the Bloomberg U.S. 1–5 Year Treasury TIPS Index are service marks of Bloomberg Finance L.P. and its affiliates, including Bloomberg Index Services Limited (“BISL”), the administrator of the index (collectively, “Bloomberg”) and have been licensed for use for certain purposes by T. Rowe Price Investment Services, Inc. Bloomberg is not affiliated with T. Rowe Price Investment Services, Inc., and Bloomberg does not approve, endorse, review, or recommend the T. Rowe Price Retirement Funds. Bloomberg does not guarantee the timeliness, accurateness, or completeness of any data or information relating to the T. Rowe Price Retirement Funds.
Copyright © 1997–2023 CREDIT SUISSE GROUP AG and/or its affiliates. All rights reserved.
Information has been obtained from sources believed to be reliable, but J.P. Morgan does not warrant its completeness or accuracy. The index is used with permission. The Index may not be copied, used, or distributed without J.P. Morgan’s prior written approval. Copyright © 2023, J.P. Morgan Chase & Co. All rights reserved.
MSCI and its affiliates and third‑party sources and providers (collectively, “MSCI”) makes no express or implied warranties or representations and shall have no liability whatsoever with respect to any MSCI data contained herein. The MSCI data may not be further redistributed or used as a basis for other indices or any securities or financial products. This report is not approved, reviewed, or produced by MSCI. Historical MSCI data and analysis should not be taken as an indication or guarantee of any future performance analysis, forecast or prediction. None of the MSCI data is intended to constitute investment advice or a recommendation to make (or refrain from making) any kind of investment decision and may not be relied on as such.
London Stock Exchange Group plc and its group undertakings (collectively, the “LSE Group”). © LSE Group 2023. FTSE Russell is a trading name of certain of the LSE Group companies. Russell® is a trade mark of the relevant LSE Group companies and is used by any other LSE Group company under license. All rights in the FTSE Russell indexes or data vest in the relevant LSE Group company which owns the index or the data. Neither LSE Group nor its licensors accept any liability for any errors or omissions in the indexes or data and no party may rely on any indexes or data contained in this communication. No further distribution of data from the LSE Group is permitted without the relevant LSE Group company’s express written consent. The LSE Group does not promote, sponsor or endorse the content of this communication.
The S&P 500 Index and the S&P Target Date indexes are products of S&P Dow Jones Indices LLC, a division of S&P Global, or its affiliates (“SPDJI”), and have been licensed for use by T. Rowe Price. Standard & Poor’s® and S&P® are registered trademarks of Standard & Poor’s Financial Services LLC, a division of S&P Global (“S&P”); Dow Jones® is a registered trademark of Dow Jones Trademark Holdings LLC (“Dow Jones”). T. Rowe Price’s product is not sponsored, endorsed, sold or promoted by SPDJI, Dow Jones, S&P or their respective affiliates, and none of such parties make any representation regarding the advisability of investing in such product nor do they have any liability for any errors, omissions, or interruptions of the S&P 500 Index or the S&P Target Date indexes.
Important Information
Call 1‑800‑225‑5132 to request a prospectus or summary prospectus; each includes investment objectives, risks, fees, expenses, and other information that you should read and consider carefully before investing.
The principal value of the Retirement Funds is not guaranteed at any time, including at or after the target date, which is the approximate year an investor plans to retire (assumed to be age 65) and likely stop making new investments in the fund. If an investor plans to retire significantly earlier or later than age 65, the funds may not be an appropriate investment even if the investor is retiring on or near the target date. The fundsʼ allocations among a broad range of underlying T. Rowe Price stock and bond funds will change over time. The funds emphasize potential capital appreciation during the early phases of retirement asset accumulation, balance the need for appreciation with the need for income as retirement approaches, and focus on supporting an income stream over a long‑term postretirement withdrawal horizon. The funds are not designed for a lump‑sum redemption at the target date and do not guarantee a particular level of income. The funds maintain a substantial allocation to equities both prior to and after the target date, which can result in greater volatility over shorter time horizons.
This material is provided for informational purposes only and is not intended to be investment advice or a recommendation to take any particular investment action. The views contained herein are those of the authors as of September 2023 and are subject to change without notice; these views may differ from those of other T. Rowe Price associates.
This information is not intended to reflect a current or past recommendation concerning investments, investment strategies, or account types, advice of any kind, or a solicitation of an offer to buy or sell any securities or investment services. The opinions and commentary provided do not take into account the investment objectives or financial situation of any particular investor or class of investor. Please consider your own circumstances before making an investment decision.
Information contained herein is based upon sources we consider to be reliable; we do not, however, guarantee its accuracy.
Past performance is not a reliable indicator of future performance. All investments are subject to market risk, including the possible loss of principal. All charts and tables are shown for illustrative purposes only.
T. Rowe Price Investment Services, Inc.
© 2023 T. Rowe Price. All rights reserved. T. Rowe Price, INVEST WITH CONFIDENCE, and the Bighorn Sheep design are, collectively and/or apart, trademarks of T. Rowe Price Group, Inc.
October 2023 / TARGET DATE SOLUTIONS