
May 2022 / RETIREMENT INSIGHTS
Strategic Investing Has Benefited Our Target Dates
Discipline has brought long‑term rewards for clients.
Key Insights
- T. Rowe Price examined 11 of our U.S. Retirement Funds (RFs) with at least 10‑year records to quantify the value added by our active management approach.1
- On average, the 11 funds outperformed their benchmarks in 96% of rolling five‑year periods and in every rolling 10‑year period since inception, net of fees.
- T. Rowe Price seeks to add value for clients at multiple levels, including glide path design, long‑term diversification, and our active management approach.
- We believe our active management approach―including tactical allocation and active management of the underlying strategies―can enhance retirement outcomes.
(Fig. 1) Retirement Funds Included in Our Performance Study

To demonstrate that T. Rowe Price’s target date investment process historically has created value for our clients, we conducted a rigorous study of the performance of all of our RFs that had at least 10‑year track records as of December 31, 2022 (Figure 1). These 11 RFs held nearly all (approximately 96%) of the RF assets managed by the firm as of that date.2
We examined fund performance at three different levels to quantify the following:
- The value added by T. Rowe Price’s tactical allocation process. Returns were calculated using each underlying fund’s style-specific benchmark.3
- The value added by security selection. Excess returns—net of fees and other costs—were calculated for the underlying funds in each RF relative to each underlying fund’s style benchmark. These fund‑level returns were then aggregated to show the total excess returns achieved by each RF.
- The total value added by T. Rowe Price’s implementation. RF returns were compared with a family of target date indexes created by Standard & Poor’s, which reflect “consensus” strategic asset allocations and glide paths for the industry as a whole based on an annual survey of reported portfolio holdings.
For each level of fund performance, two measures were calculated:
- Active success rates: The percentage of total rolling periods in which the RF added value at the performance level being measured.
- Excess returns: The value added by each RF at the performance level being measured. Excess returns were calculated for each rolling period and then averaged across all the periods in each time frame.
T. Rowe Price believes strongly that longer time horizons provide the most meaningful measures of target date implementation, as they smooth out the effects of shorter‑term factors that can produce a distorted picture of relative performance. Accordingly, our analysis focused primarily on performance over rolling 5- and 10‑year periods, rolled monthly.4
To provide a summary of the effectiveness of T. Rowe Price’s target date process, we also calculated performance averages for all 11 RFs across all three levels of our analysis (total value added, tactical allocation, and security selection). To account for the differing longevity of each RF, these averages were time weighted—the results are based on the percentage of the total performance periods in each time frame provided by each RF.
Study Results
By and large, the time‑weighted averages reflect the same results as for the individual Retirement Funds: The total value added by T. Rowe Price’s implementation and the contributions made by tactical asset allocation and security selection were all positive and relatively stable across different time periods (Figures 2 and 3).
(Fig. 2 and Fig. 3) Time‑Weighted Average Active Success Rates for T. Rowe Price Retirement Funds
Fund Inceptions Through December 31, 2021

Time‑Weighted Average Annualized Value Added (in Basis Points) for T. Rowe Price Retirement Funds
Fund Inceptions Through December 31, 2021
Fund Inceptions Through December 31, 2021
Sources: Standard & Poor’s, Russell, MSCI, Bloomberg Index Services Limited,
J.P. Morgan, Credit Suisse (see Additional Disclosures), and T. Rowe Price.
Data analysis by T. Rowe Price.
Note that past performance data throughout this material are not reliable indicators of future performance.
Individual performance results for the 11 RFs in our study also were strongly positive across both 5‑ and 10‑year time frames:
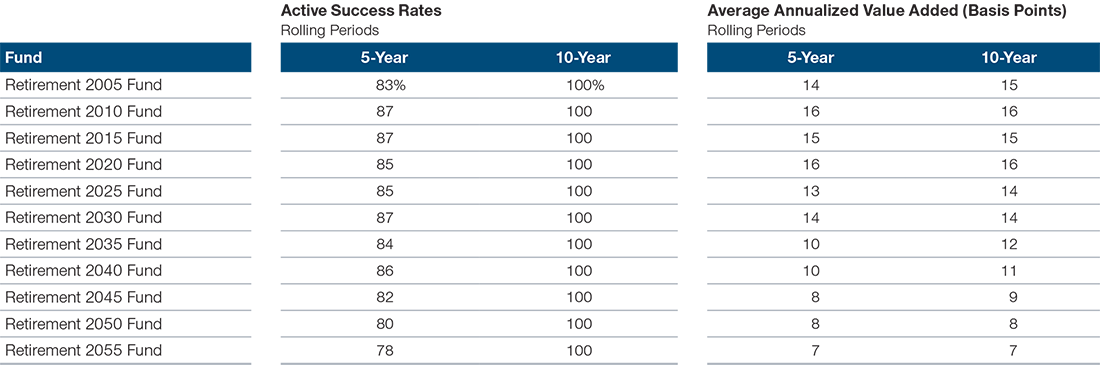
- Tactical asset allocation: The performance contribution from tactical allocation was positive in 100% of rolling 10-year periods for all 11 RFs. Active success rates were strongly positive across five‑year rolling periods (averaging 84%). Value added was positive across all time frames (Figure 4).
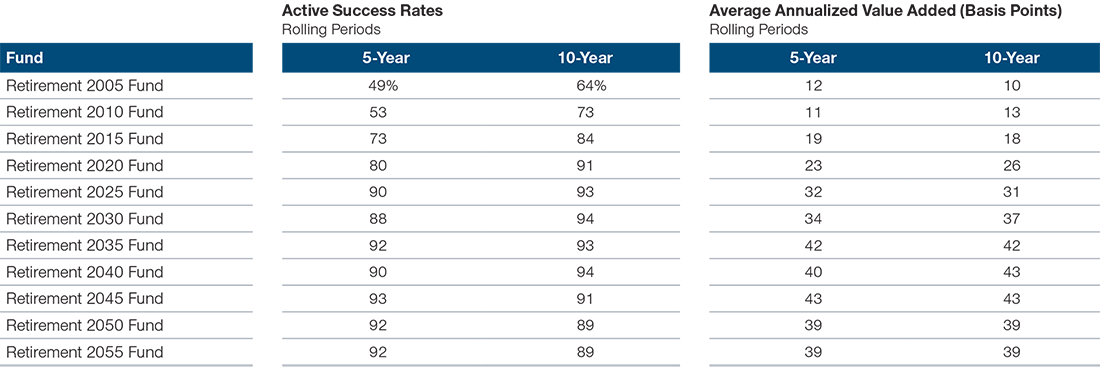
- Security selection: Active success rates were positive in 84% or more of all rolling 10-year periods for nine of the 11 RFs and strongly positive (averaging 81%) across five‑year rolling periods. Excess returns were positive across all time frames for all RFs (Figure 5).
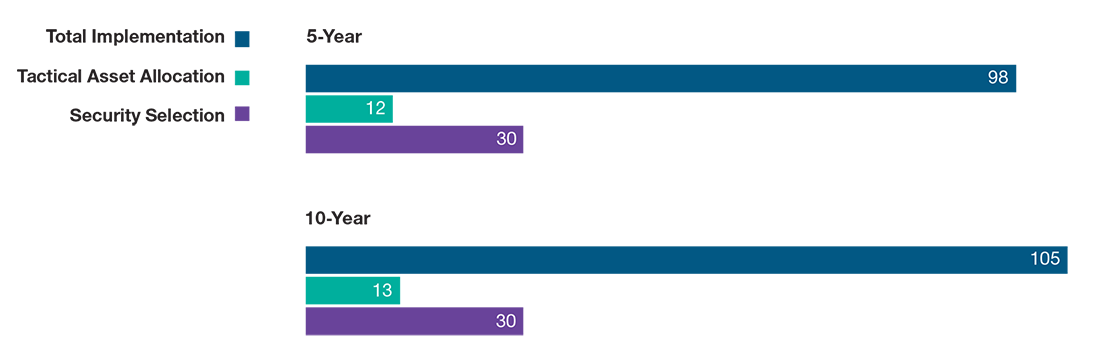
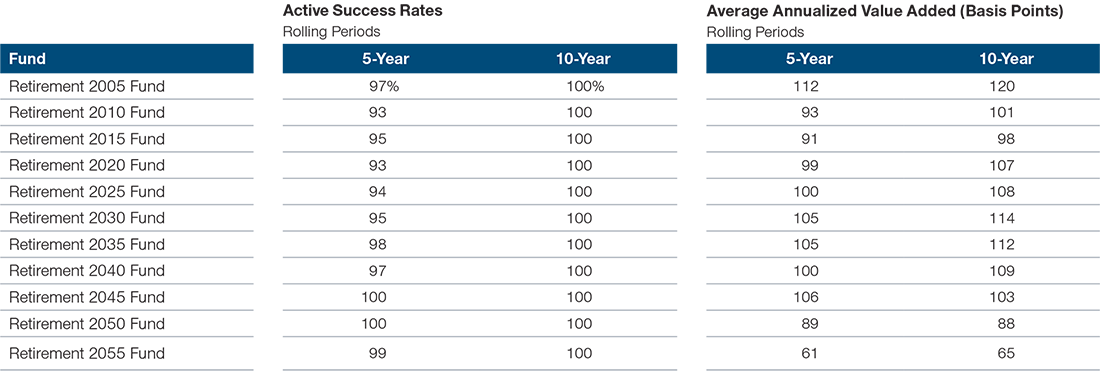
- Total implementation: Active success rates were positive in 100% of rolling 10-year periods for every RF and averaged 96% across five‑year rolling time periods. Annualized excess returns were consistently positive across all time frames for all RFs (Figure 6).
(Fig. 4) Active Success Rates and Average Value Added by Tactical Allocation
Fund Inceptions Through December 31, 2021
Active Success Rates
Rolling Periods
Average Annualized Value Added (Basis Points)
Rolling Periods
Source: T. Rowe Price.
(Fig. 5) Active Success Rates and Average Value Added by Security Selection
Fund Inceptions Through December 31, 2021
Active Success Rates
Rolling Periods
Average Annualized Value Added (Basis Points)
Rolling Periods
Sources: Standard & Poor’s, Russell, MSCI, Bloomberg Index Services Limited, J.P. Morgan, Credit Suisse (see Additional Disclosures), and T. Rowe Price. Data analysis by T. Rowe Price.
(Fig. 6) Active Success Rates and Average Value Added by Total Implementation
Fund Inceptions Through December 31, 2021
Active Success Rates
Rolling Periods
Average Annualized Value Added (Basis Points)
Rolling Periods
Sources: Standard & Poor’s (see Additional Disclosures) and T. Rowe Price. Data analysis by T. Rowe Price.
Benefits for Investors
The excess returns historically achieved by T. Rowe Price’s Retirement Funds may seem modest compared with the absolute returns that investors typically have been able to achieve on diversified asset portfolios over longer periods. However, compounded over time, even a small improvement in returns can make a significant difference in ending portfolio values.
Take, for example, the experience of the T. Rowe Price Retirement 2030 Fund. From its inception on September 30, 2002, through December 31, 2022, the fund outperformed the S&P Target Date 2030 Index by 1.03 percentage points, annualized. If an investor had invested USD 100,000 in the Retirement 2030 Fund at inception, by the end of 2022 his or her portfolio could have been worth over USD 90,000 more than the same amount invested in a hypothetical portfolio that earned the same return as the S&P Target Date 2030 Index (Figure 7).
(Fig. 7) Example of the Benefits of T. Rowe Price’s Strategic Investing Approach
Portfolio Growth Potential Relative to the S&P Target Date 2030 Index

September 30, 2002, Through December 31, 2021
Sources: Standard & Poor’s (see Additional Disclosures) and T. Rowe Price. Data analysis by T. Rowe Price
Current performance may be higher or lower than the quoted past performance, which cannot guarantee future results. Share price, principal value, and return will vary, and you may have a gain or loss when you sell your shares. Average annual total return figures include changes in principal value, reinvested dividends, and capital gain distributions. To obtain the most recent month‑end performance, please visit our website or contact a T. Rowe Price representative at 1‑800‑225‑5132.
A USD 90,000 difference in ending portfolio values could be significant for some retirement investors. In our example, the investor who invested in the Retirement 2030 Fund would be able to withdraw an additional USD 4,505 per year over a 20‑year retirement time horizon compared with the investor who invested in a hypothetical portfolio that tracked the performance of the S&P Target Date 2030 Index—assuming no further portfolio growth after retirement (Figure 8). For some retirees, that USD 4,505 difference could have a meaningful impact on living standards.
(Fig. 8) Potential Postretirement Annual Spending Amounts
Income From a USD 100,000 Investment*

September 30, 2002, Through December 31, 2021
*Assumes no further portfolio growth after retirement.
Sources: Standard & Poor’s (see Additional Disclosures) and T. Rowe Price. Data analysis by T. Rowe Price.
Our Approach to Active Management
T. Rowe Price’s target date process seeks to improve outcomes for our target date clients at multiple levels—via glide path design, long‑term diversification, tactical asset allocation, and our active management approach. We believe the value added by our target date implementation can meaningfully enhance retirement outcomes for investors.
Bottom‑up fundamental research is at the core of how we manage the underlying strategies in our target date funds. That means that over 550 of our investment professionals go out in the field to uncover opportunities. They study them firsthand. And use those insights to help give our clients an investment edge.5
Our target date managers, backed by our committee of asset allocation experts from across multi‑asset, equity, and fixed income, seek to get ahead of change by identifying attractive near‑term asset valuations and using prudent tactical allocation adjustments to take advantage of those potential opportunities.
Experience has been a critical component of our success as well. We’ve managed investments through all kinds of markets, and our professionals average 22 years in the industry and 17 years with T. Rowe Price.6 Significantly, many of our analysts go on to become portfolio managers, which we believe creates a strong foundation on behalf of our clients.

Important Information
This material is being furnished for general informational and/or marketing purposes only. The material does not constitute or undertake to give advice of any nature, including fiduciary investment advice. Prospective investors are recommended to seek independent legal, financial and tax advice before making any investment decision. T. Rowe Price group of companies including T. Rowe Price Associates, Inc. and/or its affiliates receive revenue from T. Rowe Price investment products and services. Past performance is no guarantee or a reliable indicator of future results.. The value of an investment and any income from it can go down as well as up. Investors may get back less than the amount invested.
The material does not constitute a distribution, an offer, an invitation, a personal or general recommendation or solicitation to sell or buy any securities in any jurisdiction or to conduct any particular investment activity. The material has not been reviewed by any regulatory authority in any jurisdiction.
Information and opinions presented have been obtained or derived from sources believed to be reliable and current; however, we cannot guarantee the sources’ accuracy or completeness. There is no guarantee that any forecasts made will come to pass. The views contained herein are as of the date written and are subject to change without notice; these views may differ from those of other T. Rowe Price group companies and/or associates. Under no circumstances should the material, in whole or in part, be copied or redistributed without consent from T. Rowe Price.
The material is not intended for use by persons in jurisdictions which prohibit or restrict the distribution of the material and in certain countries the material is provided upon specific request. It is not intended for distribution to retail investors in any jurisdiction.
USA—Issued in the USA by T. Rowe Price Associates, Inc., 100 East Pratt Street, Baltimore, MD, 21202, which is regulated by the U.S. Securities and Exchange Commission. For Institutional Investors only.
© 2024 T. Rowe Price. All Rights Reserved. T. ROWE PRICE, INVEST WITH CONFIDENCE, and the Bighorn Sheep design are, collectively and/or apart, trademarks of T. Rowe Price Group, Inc.