
Role of high yield
Comparing high yield to other asset classes
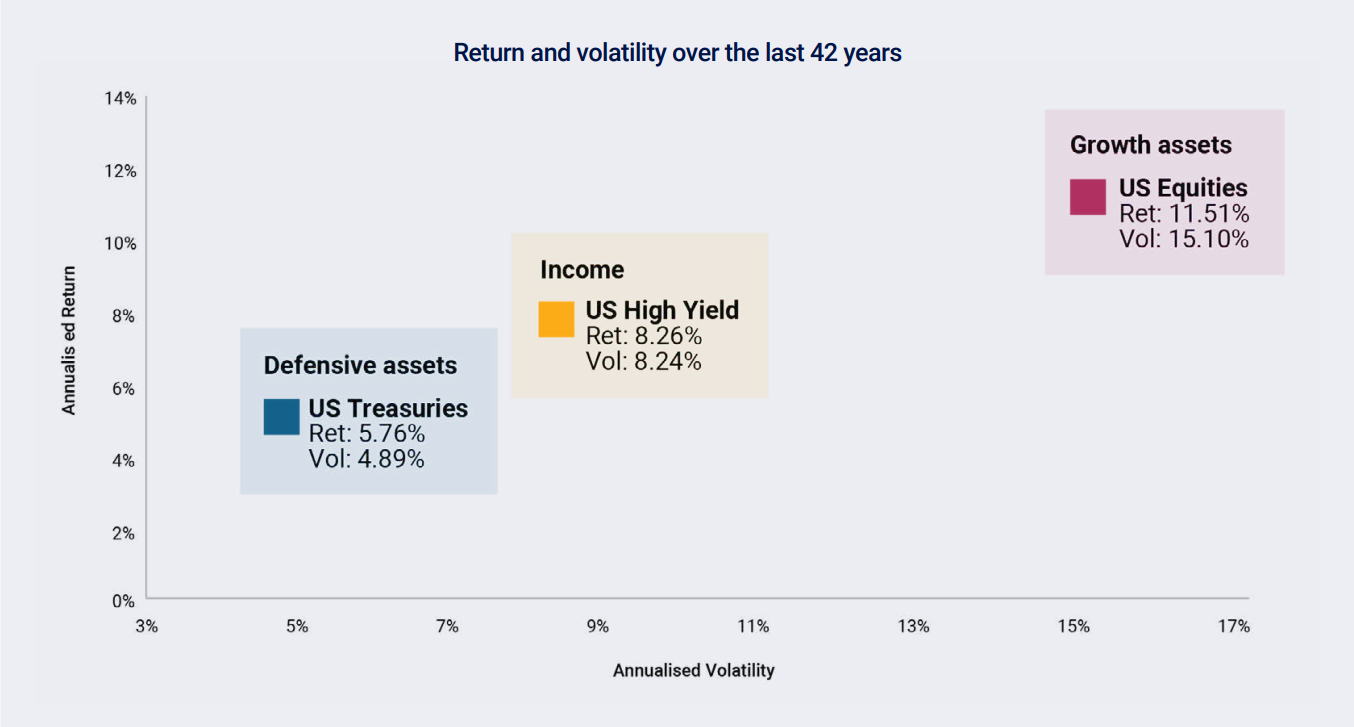
See how high yield stacks up from a risk and return, and volatility perspective

Transcript
Hi, I’m Jennifer Poon from the T. Rowe Price Fixed Income team, and in this video, we’ll look at where high yield fits in the broader investment landscape.
Understanding where high yield sits on the risk and return spectrum is important – because it’s what makes high yield such a unique asset class.
It doesn’t behave like government bonds, and it’s not quite like equities either. Instead, it fills an important gap – offering more income and return potential than government bonds, with less volatility than equities.
Let’s look at the numbers US high yield has delivered an average annual return of around 8.2% since 1983.
To put that into context:
- That’s about 2.5% more than US Treasuries
- And roughly 3% less than US equities over the same period.
Since 1983, US high yield has had an average volatility of around 8.3%. That's about 3% more than US treasuries and roughly 7% less than US equities, half the volatility of US equities, over the same period.
So while it's certainly not as stable as government bonds, it's also significantly less volatile than equities.
So from a return perspective, high yield historically sits right in the middle – bridging the gap between bonds and equities.
And that’s what gives it such a valuable role in portfolio construction – particularly for investors looking to enhance income without going all the way into equities.
For more information on this exciting asset class, speak to your financial adviser.
Key takeaways
1. It fills an important gap
High yield sits between government bonds and equities, historically offered higher returns than government bonds with less volatility than equities.
Past performance is not a guarantee or a reliable indicator of future results.
From 1 July 1983 until 30 June 2025. US Treasuries represented by the Bloomberg US Treasury Index, US high yield by the Bloomberg US Corporate High Yield Bond Index, US equities by S&P500 Index.
2. Superior risk-adjusted returns
Historically, high yield has delivered better returns for the level of risk taken compared to both government bonds and equities over the long term.
3. Portfolio solution
Can serve a valuable role for investors seeking return enhancement without full equity exposure.
Read the complete story

Complete the learning and short quiz to earn CPD points.
New to high yield terms?
Get quick definitions of key concepts to help you navigate the high yield education hub with confidence.
Continue your learning
items Introduction to high yield
Why global high yield?
Looking for income opportunities? This exciting asset class could be a compelling option
 Introduction to high yield
High yield is all around us...
You could be surprised by some familiar names
 High yield returns
Understanding high yield bond returns
The power of the compounding coupon
 High yield returns
It's all in the name... High yield
Breaking down a high yield bond
 Role of high yield
Correlations
It behaves more like equities than traditional bonds
 Role of high yield
More ups than downs
See how it's performed during times of market stress

Portfolio construction
Where does global high yield fit in your portfolio?
 Risks
Risks
The importance of avoiding defaults
How active management can make a big difference
 Risks
Risks
Risks of high yield
Things to consider before investing

T. Rowe Price Global High Income Fund
Exciting companies.
Compelling incomes.
Current yield
7.08%*
*As of 30 September 2025. Past performance is not a guarantee or a reliable indicator of future results. The current yield of the fund reflects the market-weighted average of coupon divided by price per security.
Risks
Fixed income securities are subject to credit risk, liquidity risk, call risk, and interest-rate risk. As interest rates rise, bond prices generally fall. Investments in high yield bonds involve greater risk of price volatility, illiquidity, and default than higher-rated debt securities.
Additional Disclosures
S&P and Bloomberg do not accept any liability for any errors or omissions in the indexes or data, and hereby expressly disclaim all warranties of originality, accuracy, completeness timeliness, merchantability and fitness for a particular purpose. No party may rely on any indexes or data contained in this communication. Visit https://www.troweprice.com/en/au/market-data-disclosures for additional legal notices & disclaimers.
202508-4771180