1 June 2021 / TARGET DATE SOLUTIONS
T. Rowe Price's Glide-Path Design Framework
An investment and behavioral solution.
Key Insights
- Behavioral preferences and objectives are as critical to the glide‑path design process as capital market assumptions and participant demographics.
- The robustness of our framework stems from realistic modeling of the economic environment, participant behavior, and plan sponsor and participant preferences.
- Our primary goal is to balance the trade‑off between limiting portfolio variability and supporting retirement consumption for all the participants in a plan.
Glide‑path design happens at the intersection of financial and behavioral economics. This is because retirement outcomes depend not only on investment returns, but also on the saving and spending behaviors and attitudes of investors. Therefore, an effective approach to life‑cycle investing must rely on a deep understanding of markets and investor behavior, including how both factors evolve and interact over extended time horizons and a wide range of market and economic cycles.
In order to properly assess the impact and interaction of these elements, T. Rowe Price employs a structural model for glide‑path design and evaluation. The primary benefit of our model is the consistency of our approach.
We recognize that while individuals may be skillful at using intuition and judgment to solve complex problems, they may not be as effective at applying these skills consistently or on a broad scale. By contrast, our structural model allows us to apply our insights consistently across the range of glide‑path problems that we seek to solve.
Our evaluation framework is based on a utility model that incorporates key variables of glide‑path design and provides a consistent mechanism for assessing different potential outcomes based on varying assumptions about plan sponsor and participant preferences and objectives.
Key Design Factors
The first step in understanding how we apply our framework is to understand the primary factors that can influence glide‑path design.
A Consistent Model for Assessing Potential Outcomes
(Fig. 1) Key factors influencing glide‑path design
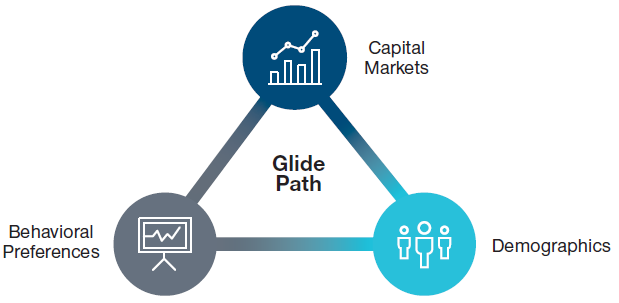
Source: T. Rowe Price.
There are three categories of relevant factors (Figure 1). Capital markets and demographics are assumptions about asset class returns and the funded status of the investors for whom the glide path is being designed. Behavioral preferences capture biases and goals pertaining to risk, avoiding wealth depletion, time horizon, and consumption.
- Capital markets: These are assumptions about expected future asset class returns, which are informed by economic variables such as growth, inflation, and interest rates.
- Demographics: Demographic assumptions are crucial to modeling projected investor cash flows, such as income, savings, and expenditures. Our model includes variables such as earnings (which are dependent on career progression and the state of the economy), income‑dependent savings rates, employer‑match formulas, and expected Social Security benefits, as well as mortality rates and behaviorally representative patterns of retirement spending.
- Behavioral preferences: Behavioral preferences determine how investors rank and compare investment decisions and outcomes. These preferences reflect investors’ attitudes toward uncertainty, wealth depletion, and the timing of consumption.
Modeling behavioral preferences allows us to intuitively capture investors’ unique tastes, construct objective criteria, and apply a consistent investment evaluation process across a variety of retirement goals and expectations. Our framework focuses on two categories of behavioral preferences: innate preferences and objective preferences.
Innate Preferences
Innate preferences are those ingrained for a chosen individual, which cannot be easily changed and are not objectives to be set. In our model, we assume two innate preferences: the degree of risk aversion and the degree of wealth depletion aversion.
- Risk aversion describes an individual’s willingness to trade a level of expected consumption for its greater certainty. More risk‑averse investors typically are willing to forgo some potential income in exchange for a higher likelihood of attaining a more modest income goal.
- Wealth depletion aversion captures an individual’s willingness to forgo current consumption in order to try to maintain their current wealth. This inclination to try to preserve wealth is not entirely driven by the need to fund future consumption. Rather, greater wealth is its own distinct source of satisfaction in our model.
Academic research suggests that investors’ risk aversion is inherent and does not change over their lifetimes. Given the challenges in correctly eliciting risk aversion preferences1 and our goal of representing diverse participant populations,2 we model risk aversion not as an oversimplifying single parameter but as a distribution of potential values. This allows us to consider a range of potential investor preferences in our decision‑making process.
Aversion to wealth depletion is the other key innate preference parameter in our framework. An investor with no aversion to wealth depletion and a known retirement horizon typically would be expected to consume all their wealth over their lifetime. However, empirical research has shown that many retirees decumulate assets slowly, if at all.3 Potential explanations for such behavior are worries about longevity risk, a desire to self‑insure against possible medical and long‑term care expenses, a bequest motive, or a general difficulty in transitioning to “decumulation mode.”
The depletion aversion parameter explicitly characterizes this observed penchant for liquidity. Furthermore, it seeks to prevent the hypothetical participants in our model from “blindly running into a brick wall” and depleting all their wealth, which can happen under naive spending rules.
Risk aversion significantly influences the level and shape of the designed glide path. Unsurprisingly, higher risk aversion tends to cause the glide path to shift downward—i.e., the desired equity allocation tends to decline (Figure 2).
Higher Risk Aversion Tends to Cause the Desired Glide Path to Shift Downward
(Fig. 2) Impact of risk aversion
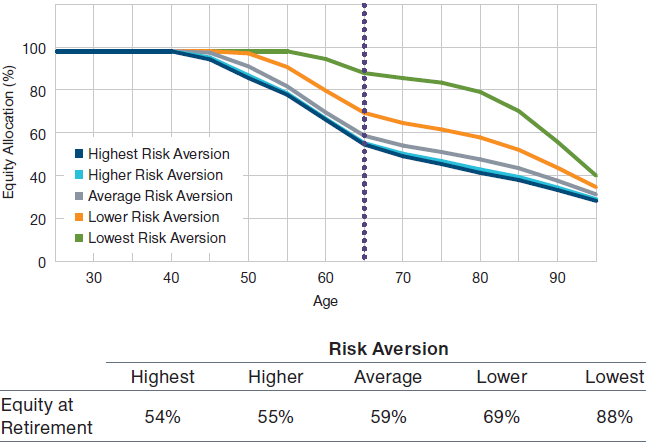
Source: T. Rowe Price.
For illustrative purposes only. Not representative of an actual investment or T. Rowe Price product. Thisis not intended to be investment advice or a recommendation to take any particular investment action.This analysis contains information derived from a Monte Carlo Simulation. See Additional Disclosures formore information.
Greater depletion aversion tends to lead to less aggressive decumulation of wealth through retirement. Because it lowers postretirement spending levels and, thus, raises the funded status, a greater wealth depletion aversion also can result in a relatively lower equity glide path, all other things being equal.

IMPORTANT INFORMATION
This material is being furnished for general informational purposes only. The material does not constitute or undertake to give advice of any nature, including fiduciary investment advice, and prospective investors are recommended to seek independent legal, financial and tax advice before making any investment decision. T. Rowe Price group of companies including T. Rowe Price Associates, Inc. and/or its affiliates receive revenue from T. Rowe Price investment products and services. Past performance is not a reliable indicator of future performance. The value of an investment and any income from it can go down as well as up. Investors may get back less than the amount invested.
The material does not constitute a distribution, an offer, an invitation, a personal or general recommendation or solicitation to sell or buy any securities in any jurisdiction or to conduct any particular investment activity. The material has not been reviewed by any regulatory authority in any jurisdiction.
Information and opinions presented have been obtained or derived from sources believed to be reliable and current; however, we cannot guarantee the sources' accuracy or completeness. There is no guarantee that any forecasts made will come to pass. The views contained herein are as of the date noted on the material and are subject to change without notice; these views may differ from those of other T. Rowe Price group companies and/or associates. Under no circumstances should the material, in whole or in part, be copied or redistributed without consent from T. Rowe Price.
The material is not intended for use by persons in jurisdictions which prohibit or restrict the distribution of the material and in certain countries the material is provided upon specific request.
It is not intended for distribution to retail investors in any jurisdiction.
USA—Issued in the USA by T. Rowe Price Associates, Inc., 100 East Pratt Street, Baltimore, MD, 21202, which is regulated by the U.S. Securities and Exchange Commission. For Institutional Investors only.
© 2023 T. Rowe Price. All rights reserved. T. ROWE PRICE, INVEST WITH CONFIDENCE, and the bighorn sheep design are, collectively and/or apart, trademarks or registered trademarks of T. Rowe Price Group, Inc.
1 June 2021 / U.S. FIXED INCOME