
April 2022 / MARKETS & ECONOMY
Volatility Spikes May Not Be Good Sell Signals
Better for investors to stay calm in times of market turbulence.
Key Insights
- Since 2000, extreme share price movements due to ‘black swan’ events have occurred more frequently, creating a problem of ‘fat tail risks’ for investors.
- For longer-term investors, keeping calm and sitting tight may be a good option when market volatility spikes, as happened after Russia invaded Ukraine.
- We showed that 18-month returns tended to be above average following a spike in volatility due – there is a natural tendency for markets to rebound.
Recently, stock market volatility has spiked as a result of the Russia-Ukraine conflict, the subsequent sanctions from western countries, elevated inflation levels, the tightening of central bank monetary policies, and the Chinese ADR panic sell-off. In this note we consider what actions investors might take to mitigate the risk to their portfolios. For longer term investors, keeping calm and sitting tight may be their best option.
Black Swan Events Show Up More Often in Headline News
Theoretically, if daily equity returns follow a normal distribution, then a 3.35 sigma (standard deviation) daily price movement is an outcome or event that should only occur around once in every decade. In the history of the S&P 500 Index, however, days of 3.35 sigma price movements have occurred more often than a normal return distribution would suggest. (Figure 1). This feature of equity returns is sometimes referred to as the problem of ‘fat tails’ or extreme outcomes facing equity investors. Extreme events occur more often than many investors might expect.
S&P 500: Number of Extreme Daily Price Changes By Decade
(Fig. 1) Average of 3.35 Sigma Daily Price Changes

Period: 01/01/1950 – 12/31/2021.
Sources: Haver Analytics/Bloomberg Finance L.P. Analysis by T. Rowe Price. We took an expanding window of historical daily returns data for the S&P 500 from 1928 (constructed from the S&P 90 index prior to inception of the S&P 500 in March 1957) to the start of each decade in order to calculate daily return z‐scores for that decade. We prefer this methodology to one in which the 3.35 sigma return threshold is held constant throughout the period covered by Figure 1 since an expanding window does not allow future, unknown returns to be used in the calculation of the number of tail risk events per decade.
Figure 1 also shows that extreme share price movements have occurred more frequently since the year 2000 than might have expected based on the entire post-war history of such events. This increase in frequency reflects a succession of extreme events including the 2000/2001 IT bubble, the global financial crisis in 2007/2008 followed by the great recession, the Fed’s ‘taper tantrum’ in 2013, and most recently, the coronavirus pandemic that began in 2020. Investors who have based their portfolio construction on a normal distribution assumption need to quickly revisit their processes to include fat tails. The increase in the number of extreme outcomes naturally raises the question “What can, or should, investors do to lower the risk of their portfolios during these now more frequent periods of market stress or turbulence?
It Pays to Stay Invested During Stress Periods
To help answer the question of what should investors do when volatility spikes, we looked at the history of daily price changes in the S&P 500 over the past thirty plus years (since 1990). We first divided the observations of daily S&P returns into two groups: 1) Days with heightened implied volatility levels, as measured by the VIX index.1 We chose 30 as the VIX threshold since it represents the 90th percentile for the period, and 2) Other days, when the VIX fell below the chosen threshold.
VIX: A ‘Greed & Fear’ Gauge for Equity Investors
(Fig. 2) Daily observations and 90th percentile threshold (1 Jan 1990 to 15 Mar 2022)
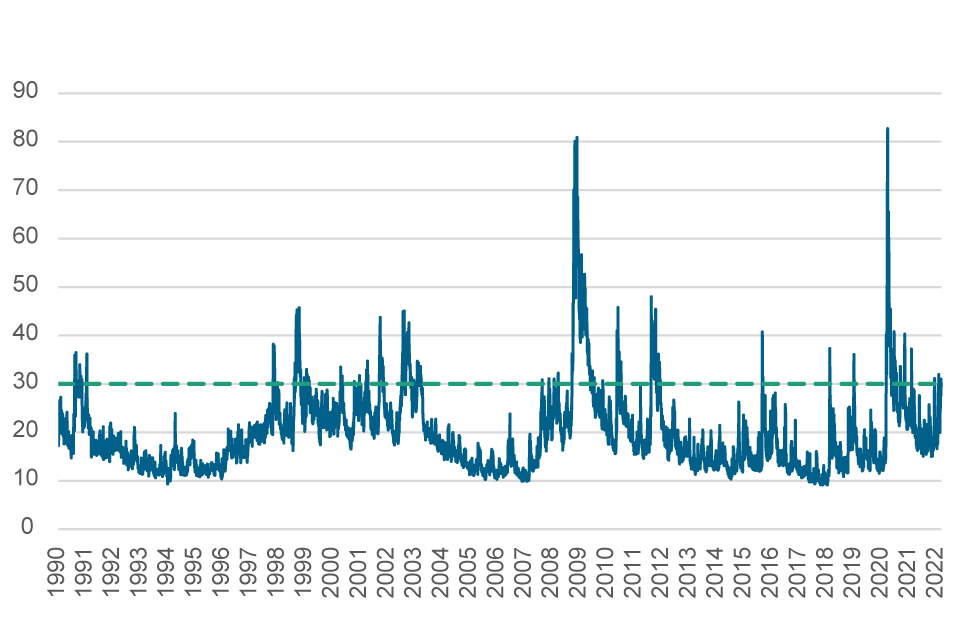
As of March 15, 2022.
Sources: Haver Analytics/Bloomberg Finance L.P. Analysis by T. Rowe Price.
Cumulative S&P 500 Index Returns Over 18-months Based on VIX
(Fig. 3) Conditioned by starting level of VIX less than or greater than 30.
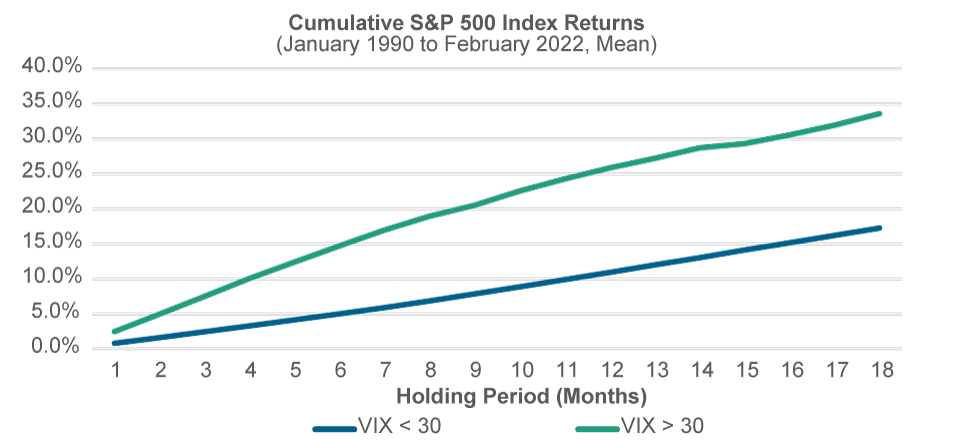
Past performance is not a reliable indicator of future performance.
As of March 15, 2022.
Sources: Haver Analytics/Bloomberg Finance L.P. Analysis by T. Rowe Price.
Next, we analyzed the cumulative returns of the S&P 500 index over a subsequent period of up to 18 months, conditioned on the starting level of VIX. The results of this calculation are shown in Figure 3. For this historic period, the cumulative 18-month return when the starting level of VIX was above 30 (90th percentile) has on average been around double the return for periods when the starting point for VIX was below 30. Moreover, the probability of achieving a positive cumulative return over a 12-month period was over 90% when the starting point for VIX was above 30, while the probability was closer to 80% when the starting point for VIX was below 30 (Fig. 4).
Probability of Achieving a Positive 12-month Return Based on VIX
(Fig. 4) Conditioned by starting level of VIX less than 30, or greater than 30.
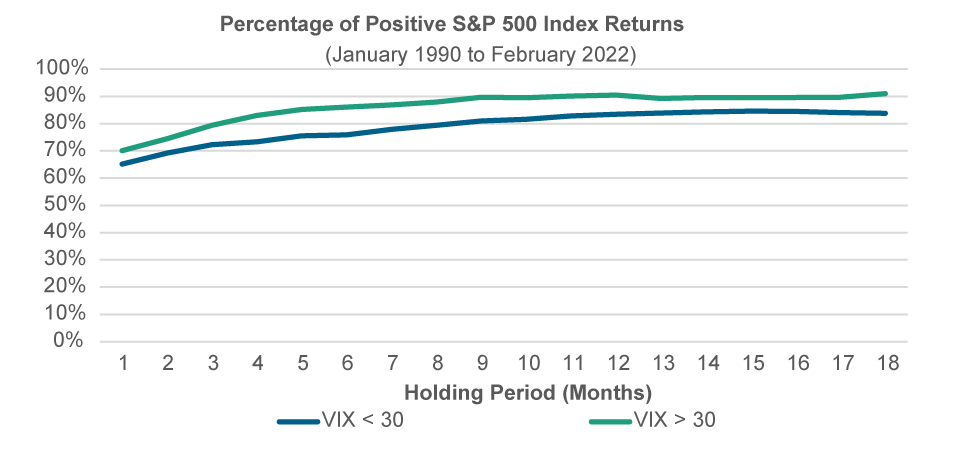
Past performance is not a reliable indicator of future performance.
As of March 15, 2022.
Sources: Haver Analytics/Bloomberg Finance L.P. Analysis by T. Rowe Price.
Our analysis suggested that spikes in volatility did not make good sell signals. Returns tended to be above average in the 18 months following a spike in volatility since there is a natural tendency for markets to rebound, having become oversold during the correction. In our view, investors need to stay disciplined and not sell in a panic close to a market bottom. Those that do so often succeed only in locking in their losses. Market timing is always difficult, even more so in periods of extreme stress and turbulence. An investor who sells and moves into cash may be late to re-enter the market. From another angle, periods with heightened volatility can potentially provide good longer-term entry points for investors, summed up in the phrase “Be greedy when others are fearful.”
As mentioned in the introduction, it was the geopolitical tensions in eastern Europe following Russia’s invasion of Ukraine that was one of the major factors behind the recent market turbulence. Does it pay to invest in periods when geopolitical tensions escalate? To answer this question, we employed a Geopolitical Risk Index (GPR) that was developed by Dario Caldara and Matteo Lacoviello at the Federal Reserve Board. Their GPR Index reflects the results of an automated text-search of the electronic archives of 10 newspapers, starting in 1985 and is shown in Figure 5.
Federal Reserve Board (FRB) Geopolitical Risk Index
(Fig. 5) Daily observations and 90th percentile (1 January 1985 to 15 March 2022)
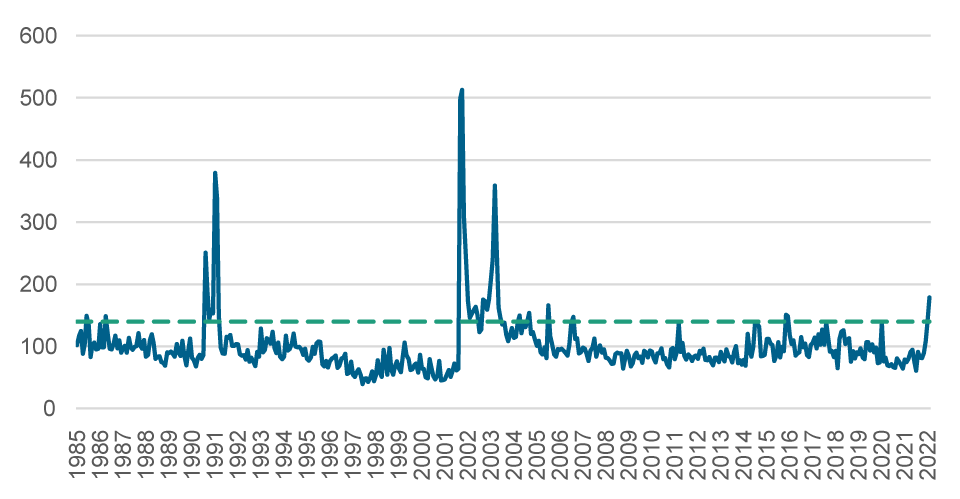
As of March 15, 2022.
Sources: Federal Reserve Board. Analysis by T. Rowe Price.
Cumulative S&P 500 Index Returns Over 18-months & FRB Geopolitical Risk Index (GPR)
(Fig. 6) Conditioned by FRB Geopolitical Risk Index less or greater than 140.
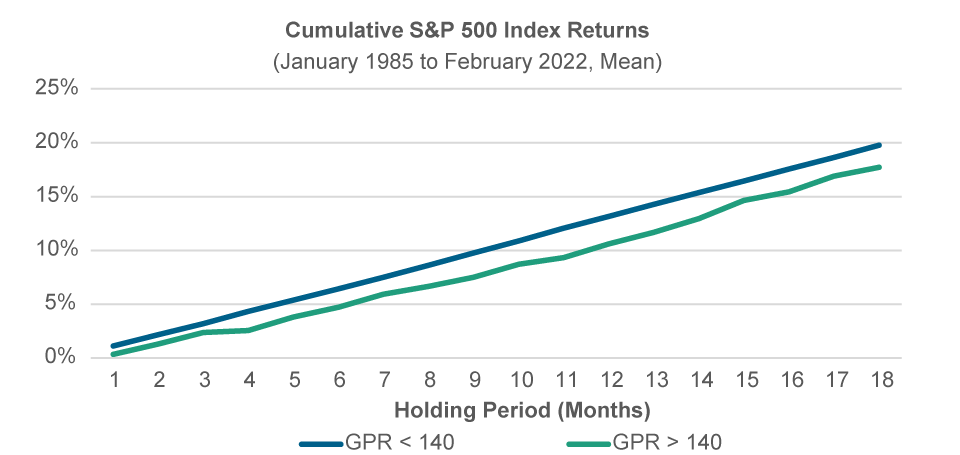
Past performance is not a reliable indicator of future performance.
As of March 15, 2022.
Sources: Federal Reserve Board. Analysis by T. Rowe Price.
Similar to the treatment of the VIX analysis, we picked 140 as the threshold to partition the history as it represents the 90th percentile. However, on repeating the analysis of Figures 3 and 4 above, we didn’t find historical evidence that heightened geopolitical risks can lead to strong forward returns. Thus, in our view, investors should pay more attention to surges in market implied volatility (VIX) rather than to geopolitical risks on a standalone basis, reflected by the volume of media discussions of Russia/Ukraine. We believe that the reason why periods with heightened geopolitical risk do not as a rule provide good entry points for investors is that few of us have an edge on the duration and severity of geopolitical developments, so it might not be wise to use a gauge of geopolitical risk as a market timing signal.
When Investing, Time Is Your Friend
While investors often tend to evaluate their financial success over a relatively short time frame, such as quarterly or annually, in practice their real investment horizon is typically much longer than that. As an investor, once you extend your time horizon to match your financial plan, then your potential deviation from the median outcome is likely to be reduced significantly. This is illustrated by Figure 7 which shows the 1-, 3-, 10- and 20-year average and median returns for the S&P 500, together with their standard deviation (represented by the height of the box), and extreme values (represented the vertical line). Merely extending the investment horizon from twelve months to three years is seen to reduce the uncertainty of future returns significantly. Longer investment horizons reduced volatility in investment outcomes.
Over Longer Investment Horizons Return Uncertainty Diminished
(Fig. 7) Average return (horizontal line) and median return (x) by holding period.Box equals +/- one standard deviation. Vertical line represents minimum andmaximum return.
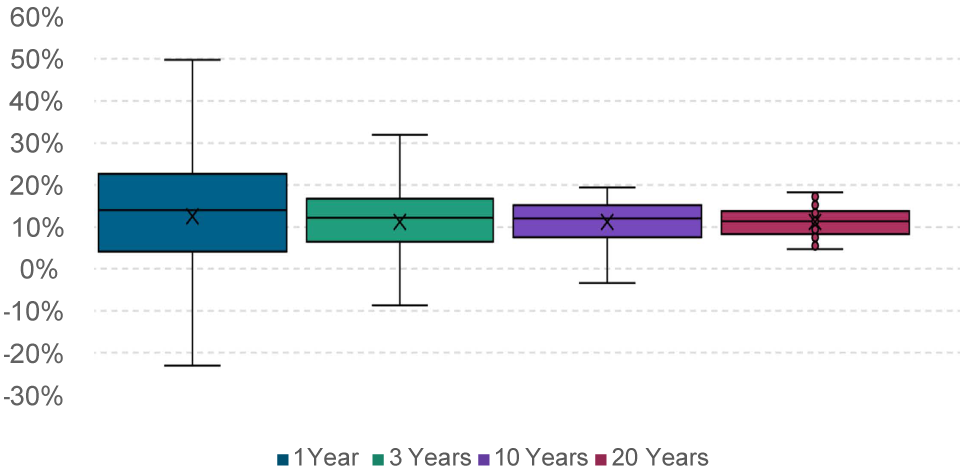
Past performance is not a reliable indicator of future performance.
As of March 15, 2022.
Sources: Haver Analytics/Bloomberg Finance L.P. Analysis by T. Rowe Price.
Finally, even when we focus on worst- case scenarios as measured by the Value at Risk at the 95% confidence level over various time periods (Figure 8), we can see that the risk of losing money via a large drawdown diminished as the investment horizon was lengthened.
Risk of Losing Money Diminished With The Length of The Investment Horizon
(Fig. 8) S&P 500 95% Value-at-Risk (VaR) by Holding Period (in months)
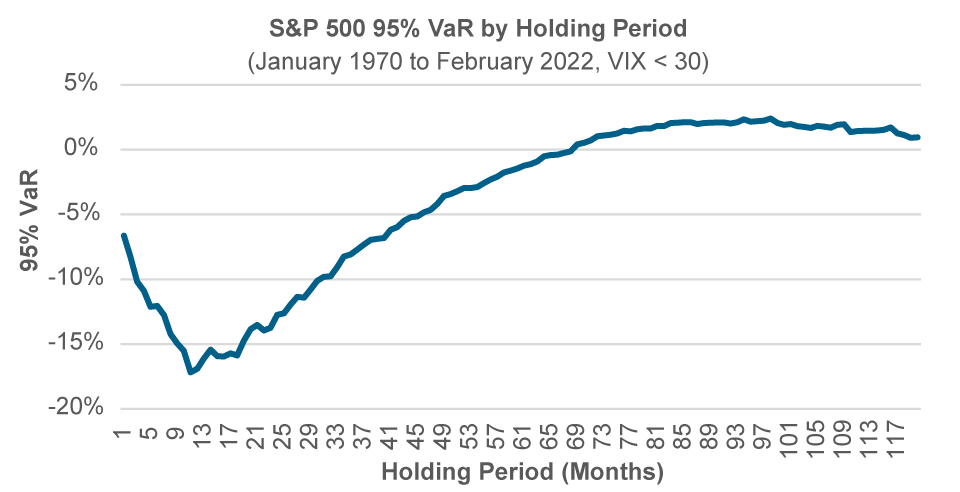
As of March 15, 2022.
Sources: Haver Analytics/Bloomberg Finance L.P. Analysis by T. Rowe Price.
Concluding Thoughts
We are living in a world with extreme outcomes arising frequently from multiple sources: worldwide healthcare crises, rising geopolitical and social tensions, deglobalization and hardening of spheres of interest, increasing wealth inequality, tightening monetary and fiscal policies, and elevated inflation pressures.
Earlier we asked the question “What should investors do to lower the risk of their portfolios during periods of market stress?” Our answer based on the above analysis is that for investors who can afford to take a longer-term view, sitting tight and waiting for the market turbulence to pass may be a good option. Rather than succumb to the temptation to engage in market timing with all its potential difficulties and pitfalls, a commitment to positive ‘inaction’ may be preferable. Remember that short-term events tend to have only a small impact on long-term returns. So we believe maintaining a strategic equity allocation rather than rushing to sell during each short-term market decline may be a better way to achieve long- term portfolio objectives.
Additional Disclosures
Bloomberg®” and Bloomberg Indices are service marks of Bloomberg Finance L.P. and its affiliates, including Bloomberg Index Services Limited (“BISL”), the administrator of the index (collectively, “Bloomberg”) and have been licensed for use for certain purposes by T. Rowe Price. Bloomberg is not affiliated with T. Rowe Price, and Bloomberg does not approve, endorse, review, or recommend this product. Bloomberg does not guarantee the timeliness, accurateness, or completeness of any data or information relating to this product.
The S&P 500 Index is a product of S&P Dow Jones Indices LLC, a division of S&P Global, or its affiliates (“SPDJI”), and has been licensed for use by T. Rowe Price. Standard & Poor’s® and S&P® are registered trademarks of Standard & Poor’s Financial Services LLC, a division of S&P Global (“S&P”); Dow Jones® is a registered trademark of Dow Jones Trademark Holdings LLC (“Dow Jones”). This product is not sponsored, endorsed, sold or promoted by SPDJI, Dow Jones, S&P, their respective affiliates, and none of such parties make any representation regarding the advisability of investing in such product(s) nor do they have any liability for any errors, omissions, or interruptions of the S&P 500 Index.
Important Information:
Where securities are mentioned, the specific securities identified and described are for informational purposes only and do not represent recommendations.
This material is being furnished for general informational purposes only. The material does not constitute or undertake to give advice of any nature, including fiduciary investment advice, nor is it intended to serve as the primary basis for an investment decision. Prospective investors are recommended to seek independent legal, financial and tax advice before making any investment decision. T. Rowe Price group of companies including T. Rowe Price Associates, Inc. and/or its affiliates receive revenue from T. Rowe Price investment products and services. Past performance is not a reliable indicator of future performance. The value of an investment and any income from it can go down as well as up. Investors may get back less than the amount invested.
The material does not constitute a distribution, an offer, an invitation, a personal or general recommendation or solicitation to sell or buy any securities in any jurisdiction or to conduct any particular investment activity. The material has not been reviewed by any regulatory authority in any jurisdiction.
Information and opinions presented have been obtained or derived from sources believed to be reliable and current; however, we cannot guarantee the sources’ accuracy or completeness. There is no guarantee that any forecasts made will come to pass. The views contained herein are as of the date written and are subject to change without notice; these views may differ from those of other T. Rowe Price group companies and/or associates. Under no circumstances should the material, in whole or in part, be copied or redistributed without consent from T. Rowe Price.
The material is not intended for use by persons in jurisdictions which prohibit or restrict the distribution of the material and in certain countries the material is provided upon specific request.
It is not intended for distribution to retail investors in any jurisdiction.
This material is only for investment professionals that are eligible to access the T. Rowe Price Asia Regional Institutional Website. Not for further distribution.
© 2024 T. Rowe Price. All Rights Reserved. T. ROWE PRICE, INVEST WITH CONFIDENCE, and the Bighorn Sheep design are, collectively and/or apart, trademarks of T. Rowe Price Group, Inc.