
April 2022 / INVESTMENT INSIGHTS
Three Harbingers Point to a U.S. Recession
History suggests it may not be imminent, however.
Key Insights
- Three important indicators tell us that a U.S. recession is probably on its way—but history suggests it may not arrive for a while yet.
- Investors should consider positioning their portfolios for a more volatile environment and dynamically adjusting them as conditions change.
- It may also be prudent to plan for a future recession that may be different from previous ones, while considering creative ways to mitigate downside risk.
When the U.S. sneezes, the world catches a cold. This old saying captures the risk of a U.S. recession to global financial markets. A recession in the world’s largest economy, which also happens to house the world’s biggest equity and fixed income markets, will impact investors wherever they are.
Contemplating more persistent elevated inflation, major central banks such as the U.S. Federal Reserve have begun to tighten monetary policy. As this has occurred while a major war is being waged in Europe, investors are increasingly worried about a recession. To determine whether this concern is justified, we have examined three measures that have, in the past, been reliable indicators of recessions in the U.S.: a surging oil price, the Fed hiking its policy rate, and inversion of the Treasury yield curve. Let’s take each of these in turn.
Three Classic Harbingers of a U.S. Recession
All are currently in evidence
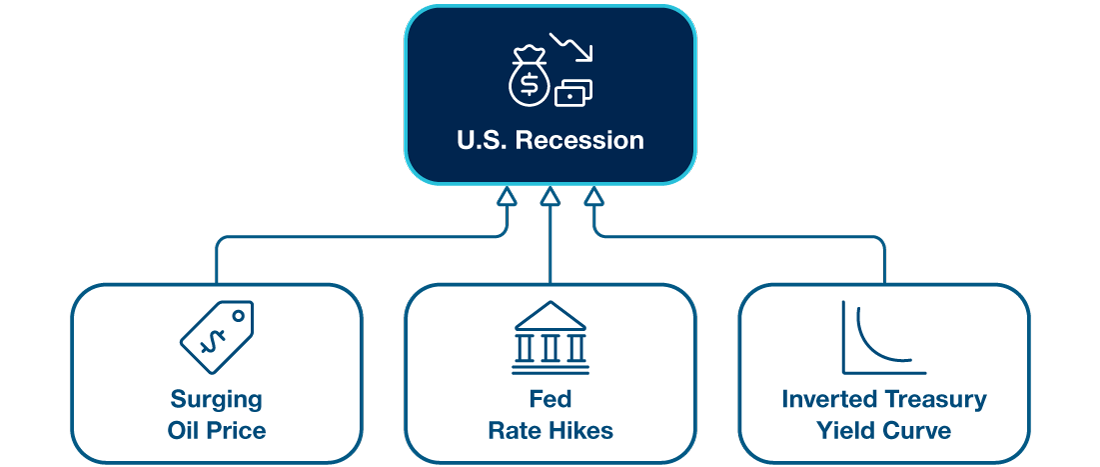
For Illustrative Purposes Only.
1. Surging Oil Price
Nearly every U.S. recession since the mid‑1970s has been preceded by a sharp rise in oil prices. These days, the world economy is less dependent on oil and uses fossil fuel more efficiently, but the oil price still matters greatly to firms and individuals because it impacts prices in so many other areas, such as manufacturing, consumer goods, transportation, household energy bills, and car fuel (to name but a few). A higher oil price leaves consumers with less discretionary income. It may also lead to inflationary pressures and tighter monetary policy, which could result in an economic slowdown.
Finally, surging oil prices influence expectations, both for inflation and economic conditions more broadly. Much of what happens in the economy depends on what people expect to happen.
A spike in the oil price has preceded five of the six U.S. recessions since 1976, ignoring spikes occurring once a recession has begun (Figure 1). In fact, there have been relatively few sharp rises in oil prices that have not been followed by recession in the subsequent few years. As the global economy reopened following the coronavirus pandemic, the price of oil began to rise in October 2020 and surged again after Russia invaded Ukraine in February 2022.
Oil Price Spikes Have Been a Reliable Predictor of U.S. Recessions
(Fig. 1) Five of the past six recessions have been preceded by surging prices
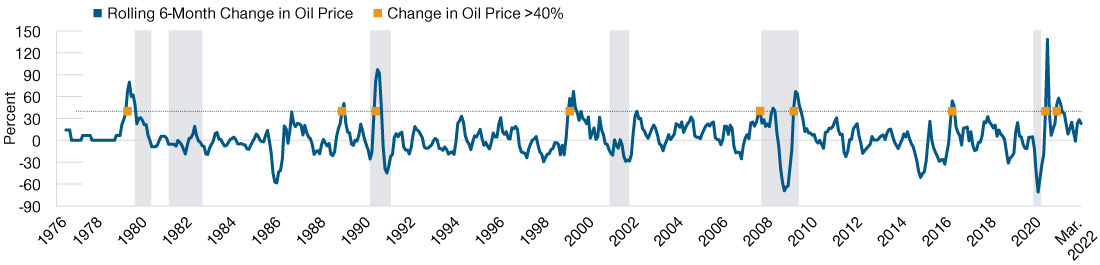
As of March 31, 2022.
Past performance is not a reliable indicator of future performance.
Sources: National Bureau of Economic Research (NBER), Energy Information Administration/Chicago Mercantile Exchange/Haver Analytics, Federal Reserve,
Board of Governors of the Federal Reserve System (U.S.), analysis by T. Rowe Price. Percentage change in spot West Texas Intermediate (WTI) oil price over rolling six months in U.S. dollars. The gray‑shaded areas represent U.S. recessions, as dated by NBER. June 1976 through March 2022. See Appendix:Methodology and Data, for additional information on the analysis.
2. Rising Fed Funds Rate
Economic expansions do not die of old age—the Fed kills them. When tightening monetary policy, the Fed aims to slow economic growth to tame inflation but not so much to topple the economy into recession. The aim is to engineer a soft landing—a gradual slowdown in economic activity that helps curb surging prices while keeping the labor market buoyant and the economy expanding.
In reality, a soft landing is difficult to achieve, not the least because Fed policy is only one of many factors affecting the U.S. economy. For example, for the current bout of inflation to fade, supply bottlenecks that emerged after the worst of the pandemic must ease. To succeed, the Fed needs to be both good and lucky.
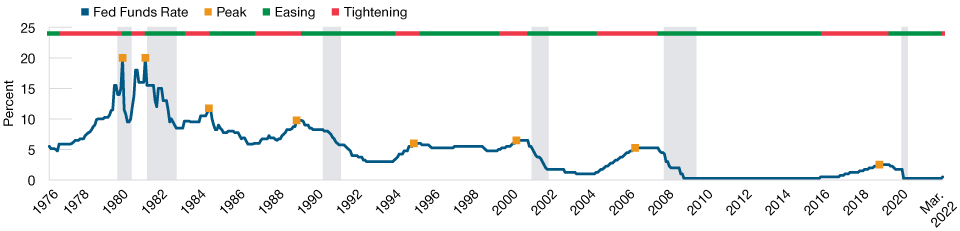
Since 1976, the Fed has only twice succeeded in hiking rates without pushing the U.S. economy into a recession in the following couple of years—in 1983 and 1994 (Figure 2). Only time will tell whether the Fed’s latest hiking cycle will succeed in combating inflation without a recession—or if a recession will be needed to kill inflation.
Fed Funds Rate Hikes Have Usually Resulted in a U.S. Recession
(Fig. 2) Six out of the past eight hikes have followed this pattern
As of March 31, 2022.
Past performance is not a reliable indicator of future performance.
Sources: Federal Reserve, National Bureau of Economic Research (NBER), analysis by T. Rowe Price. Federal Funds Target Rate—Upper Bound.
The gray‑shaded areas represent U.S. recessions, as dated by NBER. June 1976 through March 2022. See Appendix: Methodology and Data, for additional information on the analysis.
3. Inverting Slope of the Yield Curve
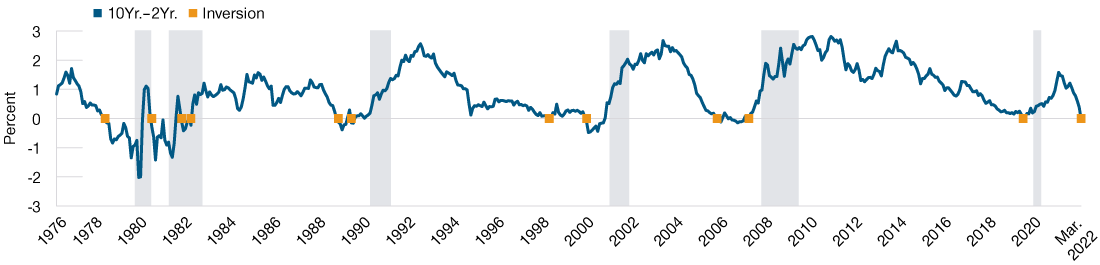
The slope of the yield curve (U.S. Treasury 10‑year yield less two‑year yield) is the classic harbinger of a U.S. recession. The short end of the curve reflects market expectations about short‑term policy interest rates over the next two years; the long end of the curve mainly reflects market expectations about inflation and economic growth over the next 10 years. As the Fed hikes short‑term rates, the curve tends to flatten as the two‑year yield rises faster than the 10‑year yield. Tighter Fed policy typically reduces inflation and growth expectations for the medium term, dampening moves in the 10‑year yield. Eventually, inversion occurs when the slope turns negative—the two‑year yield rises above the 10‑year yield.
An Inverted Yield Curve Is a Classic Harbinger of Recession
(Fig. 3) Inverted curves have preceded all U.S. recessions since 1976
As of March 31, 2022.
Past performance is not a reliable indicator of future performance.
Sources: Board of Governors of the Federal Reserve System (U.S.), National Bureau of Economic Research (NBER), analysis by T. Rowe Price. Slope of the yield curve is given by 10‑year Treasury yield less the 2‑year Treasury yield. The gray‑shaded areas represent U.S. recessions, as dated by NBER. June 1976 through March 2022. See Appendix: Methodology and Data, for additional information on the analysis.
This slope of the yield curve not only reflects market expectations—it may also help to cause a recession. Banks profit from borrowing short term and lending long term. The flatter the yield curve, the lower the profits that banks can make from lending and the lower the amount of credit in the economy. Subdued credit growth could be one factor contributing to recessions.
For predicting recessions, an inverted yield curve tells us more than a flattening yield curve: Ignoring those that occurred during recessions, inversions preceded each of the six recessions since 1976. The yield curve inverted again in March of this year, albeit with the long end of the curve already pushed down by unconventional monetary policy. It is also worth noting that another classic harbinger of U.S. recessions, U.S. Treasury 10‑year less three‑month yield, is positively sloping, signaling no recession on the horizon.
Preparing for a U.S. Recession—Whenever It Arrives
The economic cycle goes through periods of boom and bust. Recessions are a part of the cycle, bringing economic hardship but also constructive destruction. Based on our key indicators—the oil price, Fed policy, and the slope of the yield curve—a recession in the U.S. seems increasingly likely. However, history shows that these signs have typically preceded a recession by about an average of two years.
In the meantime, investors should consider maintaining diversification while positioning their portfolios for a more volatile economic environment. As the business cycle moves into a downward phase, gains from economically sensitive assets would become more mixed, and investors may look to ensure any gains are banked and stay close to their policy portfolio. Markets tend to price in the risk of a recession before it occurs and may become more turbulent. Diversification, both globally and across asset classes, may help mitigate this volatility.
Investors should closely monitor developments while dynamically adjusting their portfolios as conditions change. The world has recently undergone several swift regime changes: from slowing growth to a pandemic, from near deflation to inflation, and from near‑zero policy rates to tightening. In this fast‑changing environment, agility and the ability to quickly adapt are critical for success.
Finally, we believe investors should plan to reposition their portfolios for a future recession that may be different from prior ones, while considering creative ways to mitigate downside risk. If inflation persists and government bond yields continue to trend upward, government bonds may not fulfil their traditional role of diversifying equity risk. Other approaches, such as active conservative strategies or a wider range of “safe‑haven” assets, may play a defensive role in portfolios.
Appendix: Methodology and Data
In our study, we examined monthly data from June 1976 through March 2022.
We define a surge in oil price as an increase of more than 40% in the spot price of West Texas Intermediate (WTI) relative to the price six months ago. We omit surges in oil price occurring during recessions.
For Fed tightening and easing cycles, we consider the overall trend of Fed Funds rate hikes and cuts and may ignore a small number of interest rate cuts or hikes in the opposite direction of the trend.
We define the slope of the U.S. Treasury yield curve as the 10‑year yield less the two‑year yield. Inversion is defined as a single month or the first month in a period of a number of months when the slope turns negative.
Table 1: Key Data
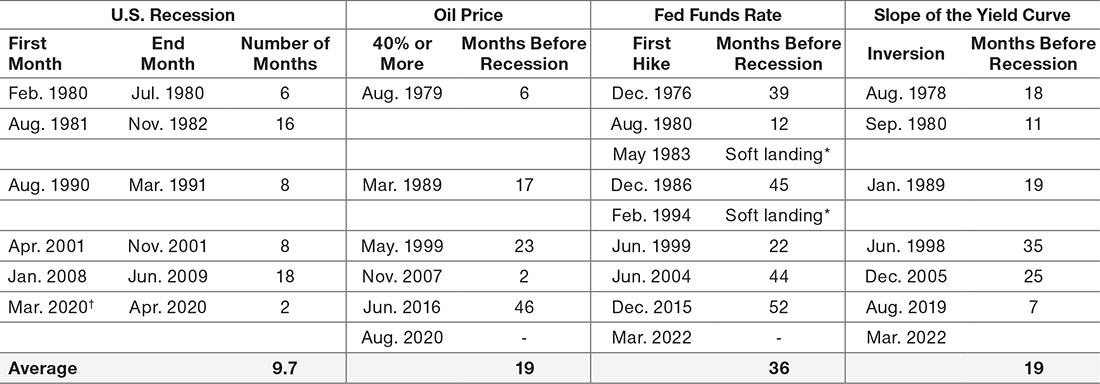
As of March 31, 2022.
*This period is unique because the major cause of the recession was the COVID pandemic.
Past performance is not a reliable indicator of future performance.
Sources: National Bureau of Economic Research (NBER), Energy Information Administration/Chicago Mercantile Exchange/Haver Analytics, Federal Reserve, Board of Governors of the Federal Reserve System (U.S.), analysis by T. Rowe Price. June 1976 through March 2022.
Recessions are dated and defined by the National Bureau of Economic Research (NBER).
Important Information:
Where securities are mentioned, the specific securities identified and described are for informational purposes only and do not represent recommendations.
This material is being furnished for general informational purposes only. The material does not constitute or undertake to give advice of any nature, including fiduciary investment advice, nor is it intended to serve as the primary basis for an investment decision. Prospective investors are recommended to seek independent legal, financial and tax advice before making any investment decision. T. Rowe Price group of companies including T. Rowe Price Associates, Inc. and/or its affiliates receive revenue from T. Rowe Price investment products and services. Past performance is not a reliable indicator of future performance. The value of an investment and any income from it can go down as well as up. Investors may get back less than the amount invested.
The material does not constitute a distribution, an offer, an invitation, a personal or general recommendation or solicitation to sell or buy any securities in any jurisdiction or to conduct any particular investment activity. The material has not been reviewed by any regulatory authority in any jurisdiction.
Information and opinions presented have been obtained or derived from sources believed to be reliable and current; however, we cannot guarantee the sources’ accuracy or completeness. There is no guarantee that any forecasts made will come to pass. The views contained herein are as of the date written and are subject to change without notice; these views may differ from those of other T. Rowe Price group companies and/or associates. Under no circumstances should the material, in whole or in part, be copied or redistributed without consent from T. Rowe Price.
The material is not intended for use by persons in jurisdictions which prohibit or restrict the distribution of the material and in certain countries the material is provided upon specific request.
It is not intended for distribution to retail investors in any jurisdiction.
This material is only for investment professionals that are eligible to access the T. Rowe Price Asia Regional Institutional Website. Not for further distribution.
© 2024 T. Rowe Price. All Rights Reserved. T. ROWE PRICE, INVEST WITH CONFIDENCE, and the Bighorn Sheep design are, collectively and/or apart, trademarks of T. Rowe Price Group, Inc.
April 2022 / INVESTMENT INSIGHTS