
April 2022 / INVESTMENT INSIGHTS
Asset Allocation in the Era of High Inflation
Responding to changing growth and inflation dynamics.
Key Insights
- Inflation is one of the biggest risks facing investors in 2022, made worse by the surge in energy and commodity prices that followed Russia’s war on Ukraine.
- In this study we looked at which asset classes can be used to hedge against inflation, based on monthly historical data from September 1976 to December 2021.
- We provide some guidelines as to how investors could tactically adjust their portfolio asset allocation in response to changing growth and inflation dynamics.
Inflation is one of the biggest risks facing investors in 2022. The risk has increased after the surge in energy and commodity prices that followed Russia’s invasion of Ukraine and the subsequent sanctions against Russia. In the U.S., consumer price inflation rose in February to 7.9%—its highest rate in 40 years—with increases in food, rent, airfares, apparel, and many other items. Inflation is also headline news in other developed countries, posing severe challenges to the ultra-accommodative monetary policies of central banks. Whether high inflation is transitory or permanent has been a hotly debated topic. What is certain is that the short-term outlook has been made worse by the spike in commodities, and inflation is likely to remain elevated relative to pre-pandemic levels for an extended period.
Regardless of its path, inflation affects everyone, particularly those with longer investment horizons. This is because inflation likely reduces our purchasing power, and over time, it can potentially result in a substantial erosion of our net worth in real terms (Fig.1). For retirees, it may also increase the risk of outliving their nest eggs. With elevated inflation in the post-pandemic recovery persisting longer than many had anticipated, it is of paramount importance to manage our portfolios well against inflation risk. It is “real growth,” or the ability to grow purchasing power over time, that matters most to investors.
Impact of Inflation on Long-Term Purchasing Power
(Fig. 1) Real value of USD 100 at end of period

Source: T. Rowe Price. Information presented herein is hypothetical in nature. The diagram above shows the decrease of the face value of USD 100 in different trajectories due to different levels of inflation over time. The analysis is shown for illustrative, informational purposes only and does not constitute any investment advice or recommendations. It is not intended to forecast or predict future events and does not guarantee future results. Actual future outcomes may differ materially.
Is Gold the Best Inflation Hedge?
The next question, naturally, is which asset classes can be used to hedge against inflation? The answer seems obvious: Many believe that inflation-sensitive assets such as gold and inflation-linked government bonds (e.g., U.S. TIPS1) are the best inflation hedges. But is this really the case?
Our research shows that the same asset can display very different inflation sensitivities in different inflationary environments. More specifically, we studied if, and how, major asset classes have behaved differently toward expected and unexpected inflation. The results are shown in Fig. 2. For expected inflation, we found that short-term TIPS were a good hedge, while both long-term TIPS and gold were very poor hedges. For unexpected inflation, gold exhibited a strong beta to inflation, but both long and short duration TIPS fell short.
Inflation Beta* for Expected vs. Unexpected Inflation
(Fig. 2) September 1, 1976, through December 31, 2021
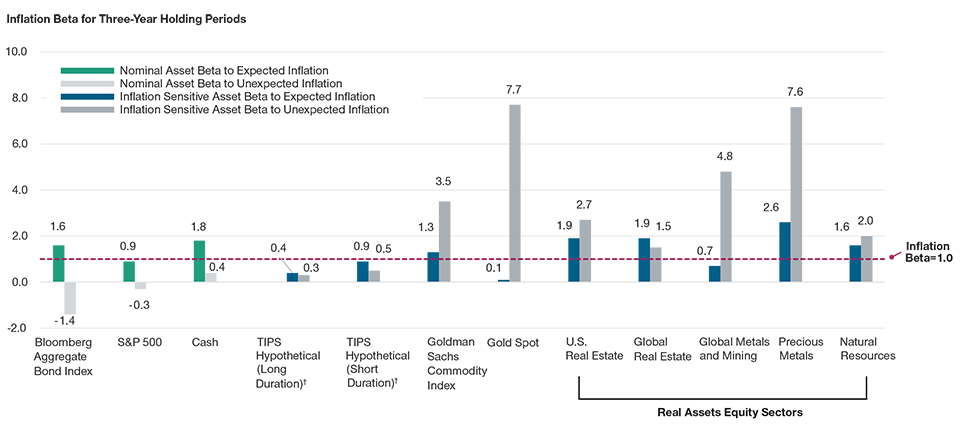
Past performance is not a reliable indicator of future performance.
Inflation measured by Consumer Price Index (CPI) for All Urban Consumers, non-seasonally adjusted. Expected inflation was obtained as that part of current CPI inflation that can be explained by trends in past inflation (using a regression framework), and unexpected inflation then emerges as the residual that can’t be explained by recent inflation trends.
*The inflation beta of an asset measures how much an asset’s price moves (on average) in response to an increase or decrease in inflation. In Fig. 2, inflation beta
provides a useful measure of each asset’s ability to provide a hedge against expected and unexpected inflation.
† Data based on the TIPS return model. See Appendix for assumptions and limitations of the U.S. TIPS return model.
The above analysis is based on historical monthly index return data, September 1976 to December 2021 (sourced from Morningstar EnCorr, St. Louis Federal Reserve Economic Database, and T. Rowe Price internal sources and combined by T. Rowe Price calculations). Historical index returns are used to illustrate the hypothetical performance and characteristics of a portfolio of real assets stocks and do not represent the performance or characteristics of any T. Rowe Price product. See Appendix for a description of each sector analyzed.
Sources for index data: Bloomberg Index Services Limited, ICE BofA, London Stock Exchange Group plc and its group undertakings (collectively, the “LSE Group”), Morningstar, MSCI, Standard & Poor’s, and Wilshire. Please see Additional Disclosures in the Appendix for information about this sourcing information.
Many nominal asset classes, including traditional stocks and bonds, tend to directionally compensate for expected inflation—sometimes better than inflation-sensitive assets. But these nominal assets typically suffer from drawdowns during periods when inflation surprises to the upside. Thus, investors in a typical stock/bond portfolio face a conundrum: When times are good and inflation rises predictably, their current asset mix should rise strongly but leaves them exposed to sudden drawdowns when inflation rises unpredictably.
Real Assets Equities Tend to Perform Better in an Inflationary Environment
T. Rowe Price multi-asset research has found that a mix of commodities (mining, energy, and utilities) and real estate companies, blended together as “real assets equities,” exhibit similar—and in most cases, superior—inflation sensitivities to traditional inflation-linked bonds. This research has found that real assets equities responded more favorably to periods of high or rising inflation than the broad equity market, where returns are relatively weak, at the cost of less favorable returns during periods of low or falling inflation, where broad equity returns are relatively strong. On the contrary, TIPS provide a real rate of return guaranteed by the government, thus eliminating inflation risk, but responded much less strongly to inflation surprises and really only preserve capital that is dedicated to TIPS. Thus, real assets equities can achieve a similar inflation hedge with a much smaller capital allocation than inflation-linked bonds.
Since expected inflation can by and large be absorbed by the growth of nominal asset classes over time, the true risk for investors lies in unexpected inflation, which, by definition, is difficult to forecast. Unexpected inflation shocks are why inflation-sensitive assets are needed, as these assets tend to perform much better in a high or rising inflationary environment while traditional assets struggle.
Tactically Adjusting Portfolio Allocation Is the Key
As such, long-term investors concerned with inflation risk or seeking real growth could consider a combination of growth-oriented and inflation-sensitive assets in strategic allocations of their portfolios, including:
1. A higher equity exposure and allocations to market segments with higher growth potential, such as small-cap stocks and emerging markets equities, to hedge against expected inflation and provide growth potential. Equities in general are less susceptible to an erosion of purchasing power relative to bonds given their ability to grow earnings in real terms during inflationary environments by potentially raising prices in response to higher input costs. In contrast, the real purchasing power of a nominal bond’s coupon will be lessened by the impact of inflation.
2. Dedicated allocations to inflation-sensitive assets that should perform well in periods of unexpected or rising inflation, such as real assets equities and TIPS. The strategic allocation to inflation-sensitive assets may help to smooth real returns and diversify the portfolio through inflation regimes.
While nominal bonds may not act as a good inflation hedge per se, we believe they could still provide income and some potential downside risk management to an inflation-focused portfolio. The fixed income allocation can be anchored by a core exposure to nominal government and high-quality credit bonds, and complemented with higher yield-oriented exposures such as high yield bonds, floating rate loans, and emerging markets debt.
Depending on relative valuations and macroeconomic factors, the underlying components discussed above can play roles of varying importance in the portfolio. This is summarized in Fig. 3, which provides some guidelines as to how investors could tactically adjust portfolio allocations in response to changing growth and inflation dynamics with the goal of pursuing long-term real purchasing power.
Seeking Durable Real Growth Across a Range of Market Environments
(Fig. 3) Tactical asset allocation opportunities
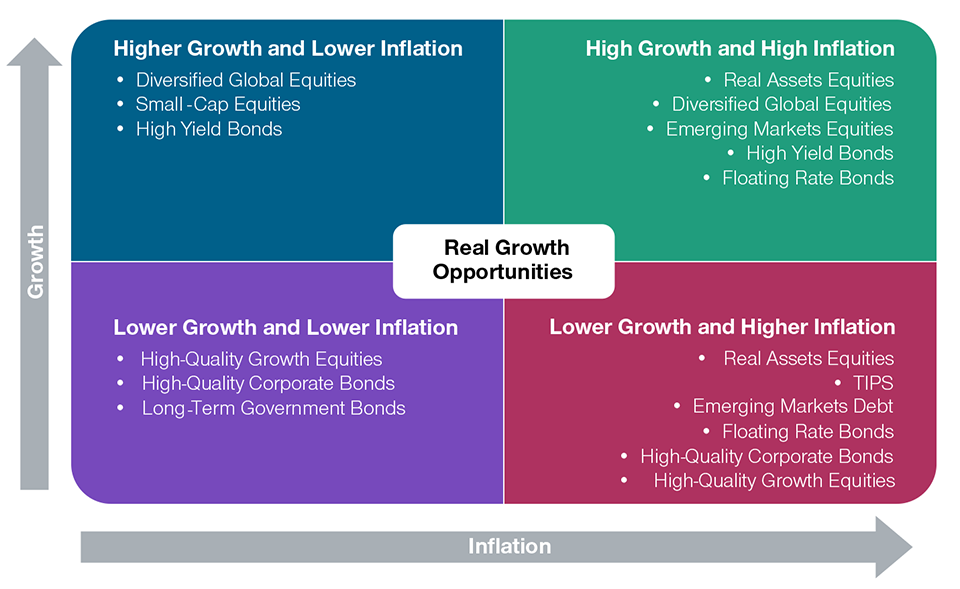
Source: T. Rowe Price. The diagram above is for informational purposes only and does not represent any investment recommendations.
1 Treasury inflation protected securities, or TIPS, are U.S. Treasury bonds whose principal is indexed to the rate of inflation and hence is inflation protected. When inflation rises, the TIPS’ principal value is adjusted upward.
APPENDIX
1. Historical Data Sources

1 Blend as defined for Metals and Mining sector for September 1976 to September 1989.
All data series were obtained from Morningstar EnCorr unless otherwise noted and combined by T. Rowe Price to compute real assets series data. Sources: Bloomberg Index Services Limited, ICE BofA, London Stock Exchange Group plc and its group undertakings (collectively, the “LSE Group”), MSCI, Standard & Poor’s, and Wilshire. Please see Additional Disclosures section for information about this sourcing information. Numbers may not total due to rounding.
2. Assumptions and Limitations of the U.S. TIPS Return Model
The goal of our analysis was to better understand both the potential behavior of TIPS as well as their long-term suitability as a strategic component within a diversified asset allocation portfolio.
In order to conduct a robust analysis focused on the inclusion of TIPS in a diversified portfolio, historical TIPS performance, including the higher inflation period of the 1970s and 1980s, is required.
However, TIPS were introduced in the U.S. in the late 1990s, with index data for shorter-maturity TIPS becoming available in 2002.
To develop the necessary data, our research team derived synthetic TIPS returns for periods prior to 2002 by decomposing historical nominal yields into hypothetical real yields and break-even inflation expectations based on past inflation, real gross domestic product (GDP) growth, and inflation-adjusted Treasury bill returns.
- The part of the nominal yield curve attributed to realized past inflation is assumed to be a reasonable proxy for how the market would have historically formed its inflation expectations.
- Consequently, historical real interest rates are assumed to be explained by the part of the estimation that relates historical nominal Treasury yields to real GDP growth and inflation-adjusted Treasury bill returns.
TIPS returns were modeled by assuming that an investor buys a newly issued hypothetical TIPS each month at par, holds it for a month, and sells it at the new market value. This new market value is determined by:
- Changes in the real yield
- Inflation accrual
- Passage of time, including coupon accrual
This return series serves as the basis for modeling the risk and model return characteristics of TIPS, such as nominal and real volatility and various correlations.
Material assumptions include:
- Historical nominal Treasury yields can be decomposed into a linear model of past inflation, real GDP growth, and inflation-adjusted Treasury bill returns.
- The part of the nominal Treasury yield that is thus attributed to realized past inflation is a reasonable proxy for how the market would have historically formed its inflation expectations.
- Consequently, historical real interest rates are assumed to be explained by the part of the estimation that relates historical nominal Treasury yields to real GDP growth and inflation-adjusted Treasury bill returns.
- TIPS are newly issued monthly beginning in 1972.
- Taxes are not taken into account in this model. Returns do not reflect the deduction of fees; otherwise, returns would have been lower.
Material limitations include:
- Returns are model-based and may not reflect how TIPS would have actually performed.
- TIPS are not issued monthly in reality.
- Historical expected inflation and real interest rates may have behaved differently than in the model estimations.
- Consequently, TIPS, if they had existed during the model period, might have had higher/lower or more/less volatile returns and different correlations to other asset classes than our historical model suggests.
- The model may fail to capture the true short- and long-term dynamics of TIPS returns if they had existed prior to 2002.
- Extreme TIPS market movements may occur more often than in the model.
- Our model does not directly capture liquidity effects or liquidity premiums.
Additional Disclosures
Bloomberg®” and Bloomberg Aggregate Bond Index, Bloomberg U.S. TIPS Index, Bloomberg U.S. Treasury TIPS 1–5 Year Index are service marks of Bloomberg Finance L.P. and its affiliates, including Bloomberg Index Services Limited (“BISL”), the administrator of the index (collectively, “Bloomberg”) and have been licensed for use for certain purposes by T. Rowe Price. Bloomberg is not affiliated with T. Rowe Price, and Bloomberg does not approve, endorse, review, or recommend these products. Bloomberg does not guarantee the timeliness, accurateness, or completeness of any data or information relating to these products.
ICE Data Indices, LLC (“ICE DATA”), is used with permission. ICE DATA, ITS AFFILIATES AND THEIR RESPECTIVE THIRD-PARTY SUPPLIERS DISCLAIM ANY AND ALL WARRANTIES AND REPRESENTATIONS, EXPRESS AND/OR IMPLIED, INCLUDING ANY WARRANTIES OF MERCHANTABILITY OR FITNESS FOR A PARTICULAR PURPOSE OR USE, INCLUDING THE INDICES, INDEX DATA AND ANY DATA INCLUDED IN, RELATED TO, OR DERIVED THEREFROM. NEITHER ICE DATA, ITS AFFILIATES NOR THEIR RESPECTIVE THIRD-PARTY SUPPLIERS SHALL BE SUBJECT TO ANY DAMAGES OR LIABILITY WITH RESPECT TO THE ADEQUACY, ACCURACY, TIMELINESS OR COMPLETENESS OF THE INDICES OR THE INDEX DATA OR ANY COMPONENT THEREOF, AND THE INDICES AND INDEX DATA AND ALL COMPONENTS THEREOF ARE PROVIDED ON AN “AS IS” BASIS AND YOUR USE IS AT YOUR OWN RISK. ICE DATA, ITS AFFILIATES AND THEIR RESPECTIVE THIRD-PARTY SUPPLIERS DO NOT SPONSOR, ENDORSE, OR RECOMMEND T. ROWE PRICE OR ANY OF ITS PRODUCTS OR SERVICES.
London Stock Exchange Group plc and its group undertakings (collectively, the “LSE Group”). © LSE Group 2022. FTSE Russell is a trading name of certain of the LSE Group companies. All rights in the FTSE Russell indexes or data vest in the relevant LSE Group company which owns the index or the data. Neither LSE Group nor its licensors accept any liability for any errors or omissions in the indexes or data and no party may rely on any indexes or data contained in this communication. No further distribution of data from the LSE Group is permitted without the relevant LSE Group company’s express written consent. The LSE Group does not promote, sponsor or endorse the content of this communication.
FTSE is a trade mark of the LSE Group and is used by FTSE International Limited (“FTSE”) under license. “NAREIT” is a trade mark of the Nareit. All rights in the (the “Index”) vest in FTSE and Nareit. Neither FTSE, nor the LSE Group, nor Nareit accept any liability for any errors or omissions in the indexes or data and no party may rely on any indexes or data contained in this communication. No further distribution of data from the FTSE or Nareit is permitted without the relevant FTSE’s express written consent. FTSE, the LSE Group, and Nareit do not promote, sponsor or endorse the content of this communication.
© 2022 Morningstar, Inc. All rights reserved. The information contained herein: (1) is proprietary to Morningstar and/or its content providers; (2) may not be copied or distributed; and (3) is not warranted to be accurate, complete, or timely. Neither Morningstar nor its content providers are responsible for any damages or losses arising from any use of this information. Past performance is no guarantee of future results.
MSCI and its affiliates and third party sources and providers (collectively, “MSCI”) makes no express or implied warranties or representations and shall have no liability whatsoever with respect to any MSCI data contained herein. The MSCI data may not be further redistributed or used as a basis for other indices or any securities or financial products. This report is not approved, reviewed, or produced by MSCI. Historical MSCI data and analysis should not be taken as an indication or guarantee of any future performance analysis, forecast or prediction. None of the MSCI data is intended to constitute investment advice or a recommendation to make (or refrain from making) any kind of investment decision and may not be relied on as such.
The S&P 500 Index is a product of S&P Dow Jones Indices LLC, a division of S&P Global, or its affiliates (“SPDJI”), and has been licensed for use by T. Rowe Price. Standard & Poor’s® and S&P® are registered trademarks of Standard & Poor’s Financial Services LLC, a division of S&P Global (“S&P”); Dow Jones® is a registered trademark of Dow Jones Trademark Holdings LLC (“Dow Jones”). This product is not sponsored, endorsed, sold or promoted by SPDJI, Dow Jones, S&P, their respective affiliates, and none of such parties make any representation regarding the advisability of investing in such product(s) nor do they have any liability for any errors, omissions, or interruptions of the S&P 500 Index.
The Wilshire Indexes(SM) and Wilshire Atlas(SM) have been licensed for use by T. Rowe Price, Associates, Inc. and all content is © 2022 Wilshire Associates Incorporated. All rights reserved.
Important Information:
Where securities are mentioned, the specific securities identified and described are for informational purposes only and do not represent recommendations.
This material is being furnished for general informational purposes only. The material does not constitute or undertake to give advice of any nature, including fiduciary investment advice, nor is it intended to serve as the primary basis for an investment decision. Prospective investors are recommended to seek independent legal, financial and tax advice before making any investment decision. T. Rowe Price group of companies including T. Rowe Price Associates, Inc. and/or its affiliates receive revenue from T. Rowe Price investment products and services. Past performance is not a reliable indicator of future performance. The value of an investment and any income from it can go down as well as up. Investors may get back less than the amount invested.
The material does not constitute a distribution, an offer, an invitation, a personal or general recommendation or solicitation to sell or buy any securities in any jurisdiction or to conduct any particular investment activity. The material has not been reviewed by any regulatory authority in any jurisdiction.
Information and opinions presented have been obtained or derived from sources believed to be reliable and current; however, we cannot guarantee the sources’ accuracy or completeness. There is no guarantee that any forecasts made will come to pass. The views contained herein are as of the date written and are subject to change without notice; these views may differ from those of other T. Rowe Price group companies and/or associates. Under no circumstances should the material, in whole or in part, be copied or redistributed without consent from T. Rowe Price.
The material is not intended for use by persons in jurisdictions which prohibit or restrict the distribution of the material and in certain countries the material is provided upon specific request.
It is not intended for distribution to retail investors in any jurisdiction.
This material is only for investment professionals that are eligible to access the T. Rowe Price Asia Regional Institutional Website. Not for further distribution.
© 2024 T. Rowe Price. All Rights Reserved. T. ROWE PRICE, INVEST WITH CONFIDENCE, and the Bighorn Sheep design are, collectively and/or apart, trademarks of T. Rowe Price Group, Inc.