
October 2022 / INVESTMENT INSIGHTS
As Market Dynamics Pivot, Alpha Opportunities Are Set to Improve
The US equity landscape is changing as key characteristics retreat from extremes
Key Insights
- In the second of our series looking at the role of active management in a changing market environment, we consider the U.S. equity landscape as certain extreme characteristics begin to unwind.
- Based on our research, historically, when U.S. equity markets have displayed similar extreme characteristics—concentration, volatility, return dispersion—active managers have generally outperformed once these extremes rolled over.
- In addition, opportunities for active investors historically have been more pronounced when coming from an extreme starting point.
Active U.S. equity strategies have generally struggled to keep pace with their passive counterparts in recent years. This comes amid a backdrop of very low volatility and an increasingly concentrated and narrow‑performing market. However, our analysis suggests that when U.S. equity markets have displayed similarly extreme characteristics—concentration, volatility, dispersion of returns—active managers have generally outperformed index returns as these extremes began to unwind.
Indeed, history shows us that opportunities for active stock picking become more pronounced when coming from extreme starting points.
A Decade of Challenging Market Dynamics
During the 10 years to 2021, a combination of extraordinary policy action and substantial passive investment flows had a distorting impact on the U.S. equity market. Macro factors and momentum became the main drivers of market performance, overshadowing the fundamental quality of individual companies.
For active managers, this proved an increasingly challenging backdrop as market factors were pushed to extremes, making opportunities for differentiated alpha generation harder to find.
Extreme Market Concentration
In recent years, the powerful gains recorded on major U.S. benchmarks have been disproportionately driven by a small number of large, growth‑oriented stocks. In 2020, for example, five stocks on the S&P 500 Index—Alphabet, Amazon, Apple, Facebook, and Microsoft—returned 55.8% for the year, while the remaining 495 stocks in the index returned 10.8%.1 The stellar performance saw the index become increasingly concentrated in these five companies, with their combined weight peaking in 2020 at 24% of the total index (based on daily data).
Few would argue that these are solid, disruptive businesses, and their respective returns reflected strong profitability and earnings growth. The ultralow interest rate environment during much of the past decade also supported the rising valuations of these companies, given their long duration growth profile. However, the extreme concentration in so few at the top of the index also reflected the distorting effect that heavy passive investment flows can have. With more money being allocated to the largest companies, the loop can become perpetual, with the index becoming increasingly concentrated as the largest stocks grow ever larger. In this scenario, momentum—rather than the underlying performance of the companies themselves—becomes the main driver of asset returns. This is a challenging backdrop for active managers who typically seek to limit portfolio concentration and so often underweight the largest and most expensive stocks.
Heightened Opportunities as Market Extremes Unwind
Fast‑forward to today, however, and the U.S. market environment now appears more favorable for active managers. The impacts of slowing economic growth, high inflation, and rising interest rates are all being reflected on equity markets, with some of the extreme characteristics evident in recent years beginning to unwind.
Market volatility, for example, has noticeably increased from the historic low levels of recent years, creating more differentiated performance between sectors and stocks. Meanwhile,10‑year U.S. Treasury yields are sharply higher than their 2020 lows. Against this backdrop, investors are pivoting away from some of the largest stocks in the S&P 500 and into more value‑oriented and cyclical stocks. This rotation has been producing a wider breadth of performance within the S&P 500 and greater dispersion between stocks’ returns, as market concentration eases from recent extreme levels.
A Potentially Favorable Environment for Quality Stock Pickers
Our analysis of similar equity market environments in the past—i.e., periods when U.S. indices have reached concentration/valuation extremes— suggests that active managers, as a group, went on to outperform their respective benchmark returns once those extreme conditions started to unwind. This makes sense, as a broadening of market drivers gives active managers more opportunity to generate excess returns, while the breadth of stocks potentially outperforming the index also increases.
Perhaps the best example of similarly extreme U.S. market concentration from recent history is during the dot‑com boom, which peaked in 2000 before collapsing shortly thereafter. Looking at the charts below, some interesting observations can be made.
Figure 1 shows the stellar performance of the technology sector from the early 1990s through to 2000, fueled by the early adoption of the internet and surging interest in “next generation” tech companies and helped along by a low interest rate environment. This period saw vast amounts of capital flow into the sector, causing it to expand rapidly and become an increasingly disproportionate weight within the S&P 500. From around 1997 through to early 2000, with index concentration becoming extreme, the drivers of market performance also narrowed to the extent that the performance of the S&P 500 Index was largely dependent on the performance of the growing tech sector “bubble.”
Late 1990s “Tech Bubble” Drives the S&P 500
(Fig. 1) Technology sector weighting in the S&P 500 vs. index return: 1993–2005
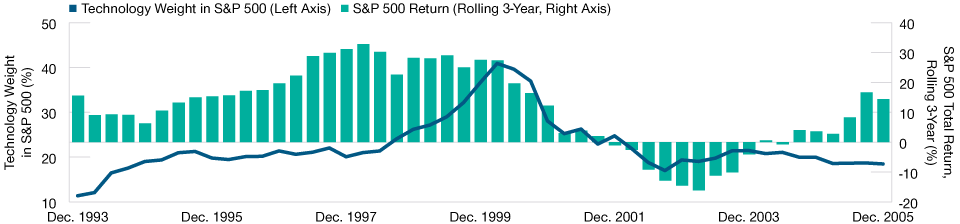
As of December 31, 2005.
Past performance is not a reliable indicator of future performance.
Period covered December 1993–December 2005. Three‑year rolling total returns, calculated quarterly, in U.S. dollars.Sources: S&P Global Market Intelligence (see Additional Disclosures); analysis by T. Rowe Price.
Figure 2 goes on to show the alpha generated by average active equity managers during the buildup of the tech bubble, from the mid‑1990s until the peak in 2000, and in the years immediately following the collapse of the bubble from 2000 to 2004.
Active equity managers underperformed during the buildup phase, as market drivers narrowed, with the performance of the S&P 500 increasingly dependent on the performance of the ever‑expanding technology sector. However, once the bubble burst, and the extreme index concentration began to rapidly unwind from mid‑2000 onward, the average alpha generated by active managers increased sharply.
Active Trailed at the Peak but Delivered Strong Alpha After Bubble Burst
(Fig. 2) Active manager excess returns vs. S&P 500 Index: 1996–2005
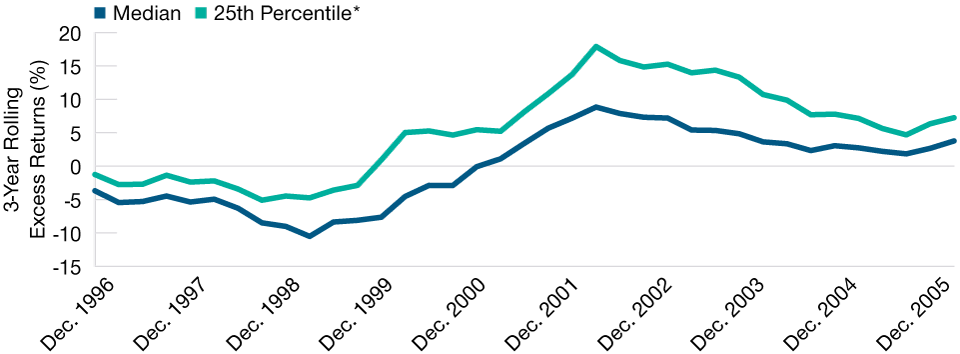
As of December 31, 2005.
Past performance is not a reliable indicator of future performance.
Period covered December 1996–December 2005. Quarterly rolling three‑year returns U.S. active strategy
excess returns (net of fees) versus S&P 500 Index. Based on U.S. Large Cap Equity eVestment universe
active strategies only. eVestment Alliance LLC measures primarily institutional active U.S. strategies
net‑of‑fees.
*25th percentile of top excess returns generated by active U.S. institutional equity strategies.
Sources: S&P Global Market Intelligence and eVestment Alliance, analysis by T. Rowe Price
This peaked in the third quarter of 2002, with the median active manager outperforming the index by 5.27% on a three‑year rolling basis.2
This highlights the potentially heightened opportunities for active managers as extreme market conditions begin to roll over. This unwinding can take time to play out fully, thereby providing a possible multiyear tailwind for active managers.
Dispersion Between Stock Returns Is Trending Higher
(Fig. 3) Active managers have typically performed better in a higher dispersion environment
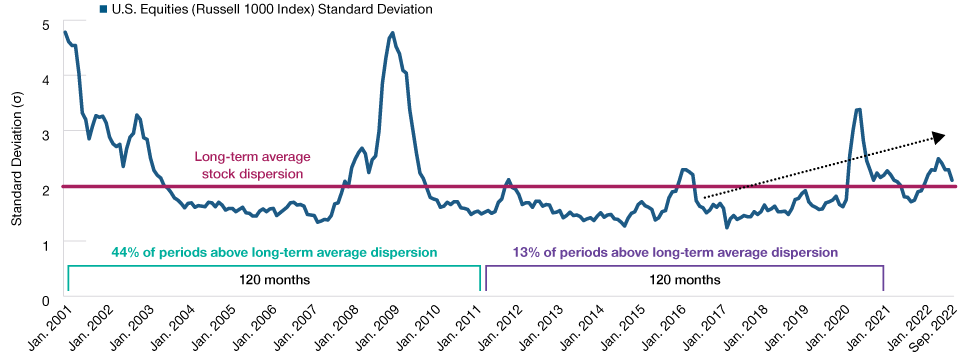
As of September 30, 2022.
Past performance is not a reliable indicator of future performance.
Source: Frank Russell Company “LSE” (see Additional Disclosures); analysis by T. Rowe Price.
Increasing Dispersion of Returns
Another extreme characteristic of the U.S. equity market over the past decade has been the historically low dispersion of stock returns. In recent years, low market volatility has seen dispersion between stock returns also decline, making it increasingly difficult for active managers to generate differentiated performance.
Dispersion is often interpreted as a measure of the level of uncertainty. Historically, there has been a positive correlation between the dispersion of returns and the outperformance of active managers relative to their benchmarks. Active managers have typically outperformed when dispersions were elevated, which should provide greater opportunities for differentiated performance. A passive approach is typically favored when there is a lack of return dispersion. With increased volatility being a feature of the U.S. equity market over recent quarters, we are also seeing an increase in return dispersions, both of which should be beneficial to an active investment approach.
The Stage Looks Set
We believe valuation and underlying earnings quality will return as principal factors driving stock prices. The market dynamics that have prevailed for much of the last decade, such as the exceptionally loose monetary and fiscal policies, are changing. This transitioning backdrop has traditionally worked to the advantage of quality active managers. A number of extreme market characteristics that have proved ongoing headwinds for active managers in recent years—high market concentration, low volatility, low return dispersion—appear to be rolling over. Coming from these extreme starting points, we anticipate more pronounced opportunities for quality active managers to generate alpha moving forward.
IMPORTANT INFORMATION
This material is being furnished for general informational and/or marketing purposes only. The material does not constitute or undertake to give advice of any nature, including fiduciary investment advice, nor is it intended to serve as the primary basis for an investment decision. Prospective investors are recommended to seek independent legal, financial and tax advice before making any investment decision. T. Rowe Price group of companies including T. Rowe Price Associates, Inc. and/or its affiliates receive revenue from T. Rowe Price investment products and services. Past performance is not a reliable indicator of future performance. The value of an investment and any income from it can go down as well as up. Investors may get back less than the amount invested.
The material does not constitute a distribution, an offer, an invitation, a personal or general recommendation or solicitation to sell or buy any securities in any jurisdiction or to conduct any particular investment activity. The material has not been reviewed by any regulatory authority in any jurisdiction.
Information and opinions presented have been obtained or derived from sources believed to be reliable and current; however, we cannot guarantee the sources' accuracy or completeness. There is no guarantee that any forecasts made will come to pass. The views contained herein are as of the date noted on the material and are subject to change without notice; these views may differ from those of other T. Rowe Price group companies and/or associates. Under no circumstances should the material, in whole or in part, be copied or redistributed without consent from T. Rowe Price.
The material is not intended for use by persons in jurisdictions which prohibit or restrict the distribution of the material and in certain countries the material is provided upon specific request.
It is not intended for distribution to retail investors in any jurisdiction.
October 2022 / INVESTMENT INSIGHTS
October 2022 / INVESTMENT INSIGHTS
